Telah dikemas kini
Key Levels: PDH/PDL + ONH/ONL + PWH/PWL + PMH/PML
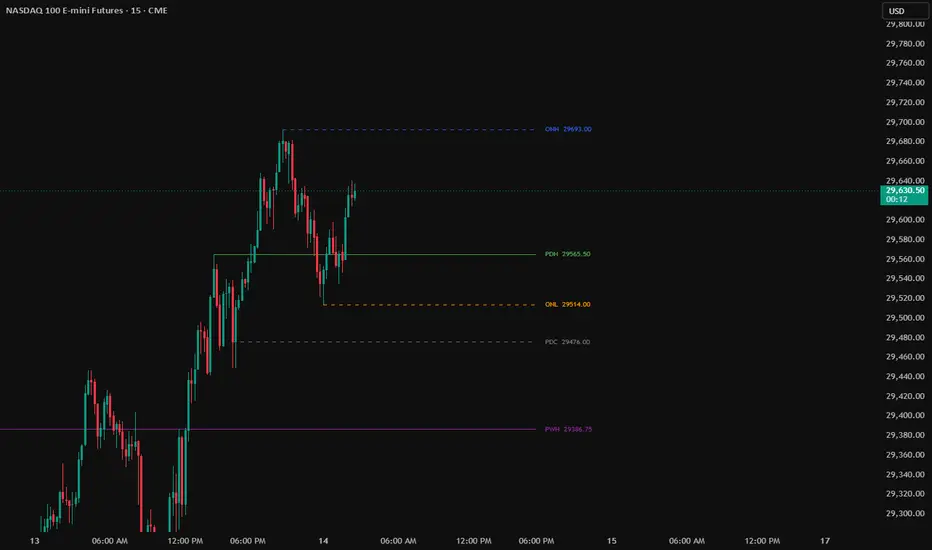
A clean, no-repaint indicator that plots the most important reference levels traders watch every session — anchored exactly at the candle that made each high or low, with right-side labels showing the price.
Levels included:
PDH / PDL — Previous Day High & Low, calculated strictly from your chosen Regular Trading Hours session (default 0930-1600 ET), so overnight wicks don't contaminate the levels
PDC — Previous Day Close (optional), anchored at the actual 4:00 PM RTH close
ONH / ONL — Overnight High & Low, with a fully customizable session window (default 2000-0400 ET, ending before pre-market). The lines paint live during the overnight session, expanding as new highs/lows print, then freeze in place when the session ends
PWH / PWL — Previous Week High & Low
PMH / PML — Previous Month High & Low
Features:
Per-level toggles, colors, line widths (1–5), styles (solid / dashed / dotted), and transparency
Each line is anchored at the actual wick that created the high or low — no floating horizontals
Only one set of lines on the chart at any time — clean and uncluttered
Right-side labels with the level name and exact price
Configurable session timezone (defaults to America/New_York)
Adjustable right-extension distance
Uses time-based anchoring, so it works on every timeframe from 1-minute up to daily without bar-limit errors
No repainting — previous-period values freeze the moment a new period begins
Levels included:
PDH / PDL — Previous Day High & Low, calculated strictly from your chosen Regular Trading Hours session (default 0930-1600 ET), so overnight wicks don't contaminate the levels
PDC — Previous Day Close (optional), anchored at the actual 4:00 PM RTH close
ONH / ONL — Overnight High & Low, with a fully customizable session window (default 2000-0400 ET, ending before pre-market). The lines paint live during the overnight session, expanding as new highs/lows print, then freeze in place when the session ends
PWH / PWL — Previous Week High & Low
PMH / PML — Previous Month High & Low
Features:
Per-level toggles, colors, line widths (1–5), styles (solid / dashed / dotted), and transparency
Each line is anchored at the actual wick that created the high or low — no floating horizontals
Only one set of lines on the chart at any time — clean and uncluttered
Right-side labels with the level name and exact price
Configurable session timezone (defaults to America/New_York)
Adjustable right-extension distance
Uses time-based anchoring, so it works on every timeframe from 1-minute up to daily without bar-limit errors
No repainting — previous-period values freeze the moment a new period begins
Nota Keluaran
-Added "Show Price on Label" toggle: choose whether labels display the price value next to the level name-Set all line widths to default to 1 for a cleaner look — users can still increase any line up to width 5 in its individual style settings

Penafian
Maklumat dan penerbitan adalah tidak bertujuan, dan tidak membentuk, nasihat atau cadangan kewangan, pelaburan, dagangan atau jenis lain yang diberikan atau disahkan oleh TradingView. Baca lebih dalam Terma Penggunaan.
Penafian
Maklumat dan penerbitan adalah tidak bertujuan, dan tidak membentuk, nasihat atau cadangan kewangan, pelaburan, dagangan atau jenis lain yang diberikan atau disahkan oleh TradingView. Baca lebih dalam Terma Penggunaan.