Telah dikemas kini
[blackcat] L1 Ichimoku Cloud with Entry Signals
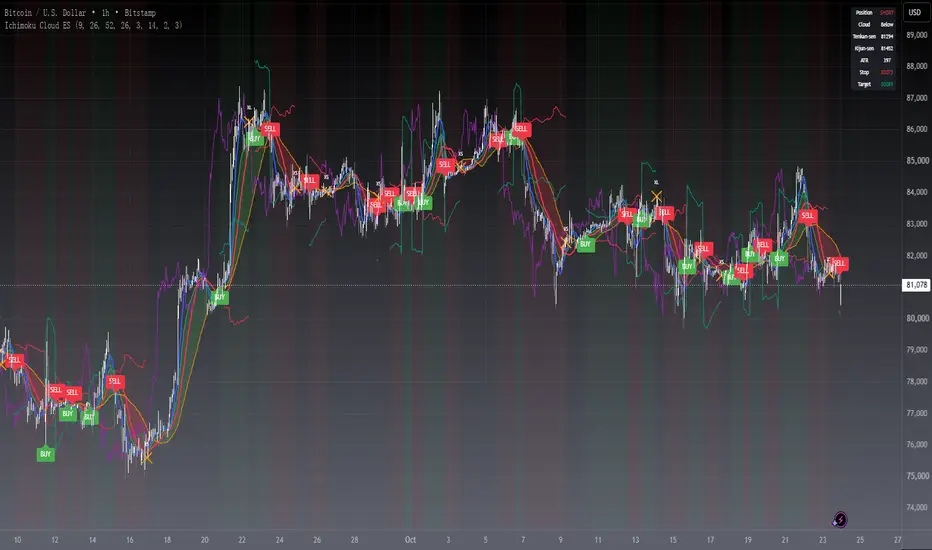
The Ichimoku Cloud is a technical analysis indicator used to identify potential trend reversals, support and resistance levels, and generate entry and exit signals in financial markets. It was developed by a Japanese journalist named Goichi Hosoda, who went by the pen name Ichimoku Sanjin.
The Ichimoku Cloud consists of several components, including the Tenkan-sen (Conversion Line), Kijun-sen (Base Line), Senkou Span A (Leading Span A), Senkou Span B (Leading Span B), and the Cloud. The Tenkan-sen and Kijun-sen lines are calculated based on the average of the highest high and lowest low over a specific period of time. The Senkou Span A is the average of the Tenkan-sen and Kijun-sen, plotted ahead of the current price. The Senkou Span B is calculated based on the average of the highest high and lowest low over a longer period of time, also plotted ahead of the current price. The Cloud is the area between Senkou Span A and Senkou Span B and is often used to identify potential support and resistance levels.
The Ichimoku Cloud with Entry Signals script provided above is a TradingView Pine script that plots the Ichimoku Cloud on a chart, along with entry signals. The entry signals are generated based on the crossover and crossunder of the Tenkan-sen and Kijun-sen lines, as well as the relationship of the closing price with Senkou Span A and Senkou Span B. When the conditions for a long entry signal are met, a green triangle-up shape is plotted below the price bars. Conversely, when the conditions for a short entry signal are met, a red triangle-down shape is plotted above the price bars.
It's important to note that the Ichimoku Cloud is a versatile indicator that can be used in various ways, including identifying trends, determining support and resistance levels, and generating entry and exit signals. Traders and investors often use it in conjunction with other technical analysis tools and indicators to make informed trading decisions.
This piece of code is a TradingView indicator script used to plot Ichimoku Cloud and display entry signals. It is written in Pine Script language.
First, the `indicator` function is used to set the title and short title of the indicator and overlay it on the main chart.
Next, two parameters `tenkanPeriod` and `kijunPeriod` are defined to represent the calculation period of Tenkan-sen (Conversion Line) and Kijun-sen (Base Line) respectively. Then, the `ta.sma` function is used to calculate the values of Tenkan-sen and Kijun-sen, and they are plotted on the chart using the `plot` function.
After that, the value of Senkou Span A (Leading Span A) is calculated using the `math.avg` function, and it is plotted on the chart using the `plot` function. Similarly, the value of Senkou Span B (Leading Span B) is calculated and plotted.
Then, the `fill` function is used to fill the area between Senkou Span A and Senkou Span B with color, forming the cloud.
Finally, entry signals are determined based on certain conditions. If the conditions are met, the `plotshape` function is called to plot arrow shapes at the corresponding positions to represent entry points.
The Ichimoku Cloud consists of several components, including the Tenkan-sen (Conversion Line), Kijun-sen (Base Line), Senkou Span A (Leading Span A), Senkou Span B (Leading Span B), and the Cloud. The Tenkan-sen and Kijun-sen lines are calculated based on the average of the highest high and lowest low over a specific period of time. The Senkou Span A is the average of the Tenkan-sen and Kijun-sen, plotted ahead of the current price. The Senkou Span B is calculated based on the average of the highest high and lowest low over a longer period of time, also plotted ahead of the current price. The Cloud is the area between Senkou Span A and Senkou Span B and is often used to identify potential support and resistance levels.
The Ichimoku Cloud with Entry Signals script provided above is a TradingView Pine script that plots the Ichimoku Cloud on a chart, along with entry signals. The entry signals are generated based on the crossover and crossunder of the Tenkan-sen and Kijun-sen lines, as well as the relationship of the closing price with Senkou Span A and Senkou Span B. When the conditions for a long entry signal are met, a green triangle-up shape is plotted below the price bars. Conversely, when the conditions for a short entry signal are met, a red triangle-down shape is plotted above the price bars.
It's important to note that the Ichimoku Cloud is a versatile indicator that can be used in various ways, including identifying trends, determining support and resistance levels, and generating entry and exit signals. Traders and investors often use it in conjunction with other technical analysis tools and indicators to make informed trading decisions.
This piece of code is a TradingView indicator script used to plot Ichimoku Cloud and display entry signals. It is written in Pine Script language.
First, the `indicator` function is used to set the title and short title of the indicator and overlay it on the main chart.
Next, two parameters `tenkanPeriod` and `kijunPeriod` are defined to represent the calculation period of Tenkan-sen (Conversion Line) and Kijun-sen (Base Line) respectively. Then, the `ta.sma` function is used to calculate the values of Tenkan-sen and Kijun-sen, and they are plotted on the chart using the `plot` function.
After that, the value of Senkou Span A (Leading Span A) is calculated using the `math.avg` function, and it is plotted on the chart using the `plot` function. Similarly, the value of Senkou Span B (Leading Span B) is calculated and plotted.
Then, the `fill` function is used to fill the area between Senkou Span A and Senkou Span B with color, forming the cloud.
Finally, entry signals are determined based on certain conditions. If the conditions are met, the `plotshape` function is called to plot arrow shapes at the corresponding positions to represent entry points.
Nota Keluaran
correct logoNota Keluaran
OVERVIEWThe [blackcat] L1 Ichimoku Cloud with Entry Signals is an enhanced version of the classic Ichimoku Cloud indicator designed to provide clear entry signals based on trend analysis. This script calculates key components such as the Conversion Line (Tenkan-sen), Base Line (Kijun-sen), Leading Span A, and Leading Span B. Additionally, it plots these elements on the chart and generates buy/sell labels when specific conditions are met, helping traders make informed decisions 📊✅.
FEATURES
Calculates essential Ichimoku Cloud components:
Tenkan-sen (Conversion Line): Blue line representing short-term trend.
Kijun-sen (Base Line): Red line indicating medium-term trend.
Senkou Span A: Green line forming part of the cloud's upper boundary.
Senkou Span B: Orange line defining the lower boundary of the cloud.
Plots all components directly on the chart with distinct colors for easy visualization 🎨
Generates buy ('BUY') and sell ('SELL') labels based on crossover events and price action:
Buy Signal: When Tenkan-sen crosses above Kijun-sen, and price is above both spans.
Sell Signal: When Tenkan-sen crosses below Kijun-sen, and price is below both spans.
Provides visual cues for potential trade opportunities without overwhelming the chart.
HOW TO USE
Add the indicator to your TradingView chart by selecting it from the indicators list.
Adjust the period inputs for Tenkan-sen, Kijun-sen, and Senkou Span B according to your preferences ⚙️.
Observe the plotted lines and cloud formation to understand current market trends.
Look for 'BUY' and 'SELL' labels generated on the chart to identify potential entry points.
Use additional confirmation tools alongside this indicator for more reliable trading signals.
LIMITATIONS
The indicator relies heavily on predefined periods which might not suit all assets or timeframes.
False signals can occur in choppy or ranging markets 🌪️.
Users should always confirm signals with other forms of technical analysis.
NOTES
Ensure that you have sufficient historical data available for accurate calculations.
Test the indicator thoroughly on demo accounts before applying it to live trading 🔍.
Customize the appearance and parameters as needed to fit your trading strategy.
Nota Keluaran
█ OVERVIEWThis indicator combines the Ichimoku Cloud with confirmed entry signals, exit markers and volatility-scaled stop/target references on any chart. It keeps the original L1 line engine and adds signal governance, risk levels, alerts and a state dashboard, so trend traders can read entries, exits and context from a single overlay.
█ CONCEPTS
The L1 variant builds the cloud from smoothed mid-price lines (ta.sma of hl2) rather than the classical Donchian midpoints, which makes the lines more gradual on noisy data. Key principles:
• Conversion/Base lines: fast Tenkan-sen and slow Kijun-sen define momentum and equilibrium.
• Cloud filter: entries are only allowed when price closes fully beyond both cloud spans, using the cloud as a trend gate.
• Signal governance: a position state machine with cooldown suppresses whipsaw re-fires and same-bar conflicts.
• Volatility-scaled risk: stop and target references adapt to current volatility via ATR multiples.
█ HOW TO USE
1 — Add the script to your chart; lines, cloud, labels and the dashboard render with no configuration.
2 — Read entries from labels, exits from XL/XS markers, and the background tint for the current long/short state.
3 — Tune the four input groups (Ichimoku, Signal Governance, Risk Management, Visuals) to your market; every added mechanism is a switch that can be disabled.
Reading the signals
• BUY label below a bar: Tenkan-sen crossed above Kijun-sen while price closed above both cloud spans.
• SELL label above a bar: Tenkan-sen crossed below Kijun-sen while price closed below both cloud spans.
• XL / XS orange cross: an opposite Tenkan/Kijun cross closed the active signal state.
• Red / teal stepped lines: suggested stop-loss and take-profit references measured in ATR from the entry.
█ FEATURES
• Dual-direction entry signals with cloud confirmation, plus symmetric exit markers.
• Position state machine with configurable cooldown and same-bar entry/exit exclusivity.
• ATR-based stop and target reference lines with adjustable multipliers.
• On-chart dashboard: position state, cloud location, line values, ATR and active risk levels.
• Four alertcondition hooks (BUY / SELL / Long Exit / Short Exit) plus dynamic any-alert messages with price and levels.
• Optional Chikou (lagging) span and semantic coloring of the cloud fill.
█ IMPLEMENTATION NOTES
Open-source under MPL 2.0, migrated to Pine v6. The lines use ta.sma on hl2, risk distances use ta.atr, and all signals are edge-triggered (crossover/crossunder), evaluated on confirmed bars for alerts. No request.security calls: everything computes on the chart timeframe with no repainting of past signals.
█ LIMITATIONS
• The L1 smoothed-line variant differs from classical Ichimoku formulas; do not expect identical levels.
• Ranging markets can alternate signals; increase the cooldown or add higher-timeframe context.
• Stop/target lines are visual references only — the indicator does not place or manage orders.
• Best suited to liquid markets on intraday and higher timeframes.
█ NOTES
• V2 edition of the L1 Ichimoku Cloud with Entry Signals by blackcat1402, polished with governance, risk references, dashboard and alerts.
• Feel free to use and modify; attribution appreciated.
════════════════════════════════════════════════════════════════════════
For questions or feedback, please use the comments section below.

Don't miss out! The first and most important thing to do is to join my Discord chat now! Click here to start your adventure: discord.com/invite/ZTGpQJq My new github for more pine development soon: github.com/wxt-coder
Penafian
Maklumat dan penerbitan adalah tidak bertujuan, dan tidak membentuk, nasihat atau cadangan kewangan, pelaburan, dagangan atau jenis lain yang diberikan atau disahkan oleh TradingView. Baca lebih dalam Terma Penggunaan.
Don't miss out! The first and most important thing to do is to join my Discord chat now! Click here to start your adventure: discord.com/invite/ZTGpQJq My new github for more pine development soon: github.com/wxt-coder
Penafian
Maklumat dan penerbitan adalah tidak bertujuan, dan tidak membentuk, nasihat atau cadangan kewangan, pelaburan, dagangan atau jenis lain yang diberikan atau disahkan oleh TradingView. Baca lebih dalam Terma Penggunaan.