Dow Theory HH HL LH LL + CHoCH By SachinRkGandhi
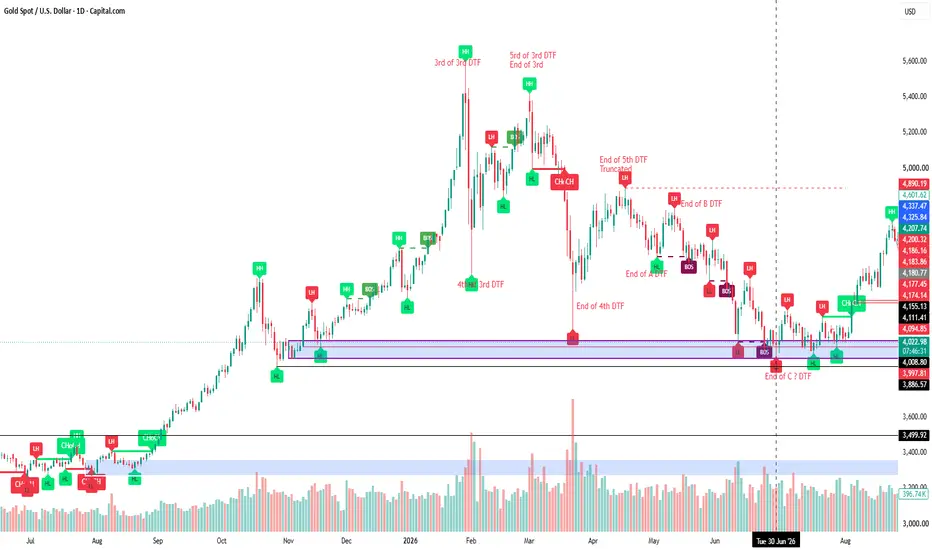
# Dow Theory HH HL LH LL + CHoCH | Market Structure Indicator By Sachin Raj Kumar Gandhi
## Overview
The **Dow Theory HH HL LH LL + CHoCH** indicator is designed to help traders understand market structure by identifying important swing highs, swing lows, trend continuation, and potential trend reversal points.
Based on Dow Theory principles and price action, the indicator automatically marks Higher Highs (HH), Higher Lows (HL), Lower Highs (LH), and Lower Lows (LL). It also plots the latest confirmed swing-high and swing-low levels and identifies Break of Structure (BOS) and Change of Character (CHoCH).
The objective is to make market structure easier to read, helping traders recognize the prevailing trend and identify important price levels directly on the chart.
## Key Features
**1. Automatic Market Structure Detection**
- **HH (Higher High):** Price creates a higher swing high.
- **HL (Higher Low):** Price creates a higher swing low.
- **LH (Lower High):** Price creates a lower swing high.
- **LL (Lower Low):** Price creates a lower swing low.
**2. Recent Swing High & Swing Low Levels**
Automatically draws horizontal levels at the latest confirmed swing high and swing low. These levels can help traders identify potential support, resistance, breakout, and breakdown areas.
**3. Change of Character (CHoCH)**
Highlights a break of the latest confirmed swing level against the previously detected trend direction. A bullish CHoCH occurs when price breaks above the latest confirmed swing high during a bearish trend. A bearish CHoCH occurs when price breaks below the latest confirmed swing low during a bullish trend.
CHoCH can help traders identify a potential change in market behavior, although it does not guarantee a reversal.
**4. Break of Structure (BOS)**
Identifies price breaking through a confirmed swing level in the direction of the currently detected trend. BOS helps distinguish potential trend continuation from a possible change in direction.
**5. Customizable Line Settings**
Personalize your chart using separate controls for CHoCH and BOS:
- Solid, dashed, or dotted line styles.
- Adjustable line width from 1 to 5.
- Independent bullish and bearish colors.
**6. Flexible Chart Display**
Enable or disable HH/HL/LH/LL labels, recent swing levels, BOS markings, and CHoCH signals according to your chart-reading preferences.
**7. Alert Conditions**
The indicator provides alert conditions for bullish and bearish structure breaks and CHoCH events, allowing traders to configure TradingView alerts.
## How to Use the Indicator
**Bullish Market Structure**
A sequence of HH and HL indicates an upward market structure. A bullish BOS can indicate continuation, while a bullish CHoCH during a previously bearish trend may signal a potential reversal.
**Bearish Market Structure**
A sequence of LH and LL indicates a downward market structure. A bearish BOS can indicate continuation, while a bearish CHoCH during a previously bullish trend may signal a potential reversal.
**Swing Levels**
Observe how price reacts around the latest confirmed swing-high and swing-low levels. A candle closing beyond one of these levels can indicate a structural break.
## Recommended Settings
The default Swing Strength is set to 5 bars. Lower values can identify more frequent, smaller swings, while higher values generally highlight larger market movements with fewer signals.
Experiment with the settings according to your trading timeframe and instrument.
## Important Notes
- Swing points are confirmed retrospectively after the selected number of bars. Therefore, HH, HL, LH, and LL labels may appear several candles after the actual turning point.
- The indicator uses a simplified, mechanical market-structure interpretation inspired by Dow Theory. It does not constitute a complete formal Dow Theory analysis.
- The initial detected structure break establishes the indicator's trend direction; subsequent breaks are classified as BOS or CHoCH according to the stored trend state.
- A CHoCH or BOS is not a guaranteed trading signal. Consider broader market context, volume, support and resistance, risk management, and independent confirmation.
- This indicator is an analytical tool, not financial advice.
**Disclaimer:** For educational and research purposes only. Trading involves risk, and past price behavior does not guarantee future results.
## Best Suited For
Price-action traders, Dow Theory learners, market-structure traders, and traders who want a cleaner visual representation of swing points, trend continuation, and potential trend changes on TradingView.
## Overview
The **Dow Theory HH HL LH LL + CHoCH** indicator is designed to help traders understand market structure by identifying important swing highs, swing lows, trend continuation, and potential trend reversal points.
Based on Dow Theory principles and price action, the indicator automatically marks Higher Highs (HH), Higher Lows (HL), Lower Highs (LH), and Lower Lows (LL). It also plots the latest confirmed swing-high and swing-low levels and identifies Break of Structure (BOS) and Change of Character (CHoCH).
The objective is to make market structure easier to read, helping traders recognize the prevailing trend and identify important price levels directly on the chart.
## Key Features
**1. Automatic Market Structure Detection**
- **HH (Higher High):** Price creates a higher swing high.
- **HL (Higher Low):** Price creates a higher swing low.
- **LH (Lower High):** Price creates a lower swing high.
- **LL (Lower Low):** Price creates a lower swing low.
**2. Recent Swing High & Swing Low Levels**
Automatically draws horizontal levels at the latest confirmed swing high and swing low. These levels can help traders identify potential support, resistance, breakout, and breakdown areas.
**3. Change of Character (CHoCH)**
Highlights a break of the latest confirmed swing level against the previously detected trend direction. A bullish CHoCH occurs when price breaks above the latest confirmed swing high during a bearish trend. A bearish CHoCH occurs when price breaks below the latest confirmed swing low during a bullish trend.
CHoCH can help traders identify a potential change in market behavior, although it does not guarantee a reversal.
**4. Break of Structure (BOS)**
Identifies price breaking through a confirmed swing level in the direction of the currently detected trend. BOS helps distinguish potential trend continuation from a possible change in direction.
**5. Customizable Line Settings**
Personalize your chart using separate controls for CHoCH and BOS:
- Solid, dashed, or dotted line styles.
- Adjustable line width from 1 to 5.
- Independent bullish and bearish colors.
**6. Flexible Chart Display**
Enable or disable HH/HL/LH/LL labels, recent swing levels, BOS markings, and CHoCH signals according to your chart-reading preferences.
**7. Alert Conditions**
The indicator provides alert conditions for bullish and bearish structure breaks and CHoCH events, allowing traders to configure TradingView alerts.
## How to Use the Indicator
**Bullish Market Structure**
A sequence of HH and HL indicates an upward market structure. A bullish BOS can indicate continuation, while a bullish CHoCH during a previously bearish trend may signal a potential reversal.
**Bearish Market Structure**
A sequence of LH and LL indicates a downward market structure. A bearish BOS can indicate continuation, while a bearish CHoCH during a previously bullish trend may signal a potential reversal.
**Swing Levels**
Observe how price reacts around the latest confirmed swing-high and swing-low levels. A candle closing beyond one of these levels can indicate a structural break.
## Recommended Settings
The default Swing Strength is set to 5 bars. Lower values can identify more frequent, smaller swings, while higher values generally highlight larger market movements with fewer signals.
Experiment with the settings according to your trading timeframe and instrument.
## Important Notes
- Swing points are confirmed retrospectively after the selected number of bars. Therefore, HH, HL, LH, and LL labels may appear several candles after the actual turning point.
- The indicator uses a simplified, mechanical market-structure interpretation inspired by Dow Theory. It does not constitute a complete formal Dow Theory analysis.
- The initial detected structure break establishes the indicator's trend direction; subsequent breaks are classified as BOS or CHoCH according to the stored trend state.
- A CHoCH or BOS is not a guaranteed trading signal. Consider broader market context, volume, support and resistance, risk management, and independent confirmation.
- This indicator is an analytical tool, not financial advice.
**Disclaimer:** For educational and research purposes only. Trading involves risk, and past price behavior does not guarantee future results.
## Best Suited For
Price-action traders, Dow Theory learners, market-structure traders, and traders who want a cleaner visual representation of swing points, trend continuation, and potential trend changes on TradingView.

Penafian
Maklumat dan penerbitan adalah tidak bertujuan, dan tidak membentuk, nasihat atau cadangan kewangan, pelaburan, dagangan atau jenis lain yang diberikan atau disahkan oleh TradingView. Baca lebih dalam Terma Penggunaan.
Penafian
Maklumat dan penerbitan adalah tidak bertujuan, dan tidak membentuk, nasihat atau cadangan kewangan, pelaburan, dagangan atau jenis lain yang diberikan atau disahkan oleh TradingView. Baca lebih dalam Terma Penggunaan.