OPEN-SOURCE SCRIPT
Telah dikemas kini FlowScope Sweep & Reclaim v1.0
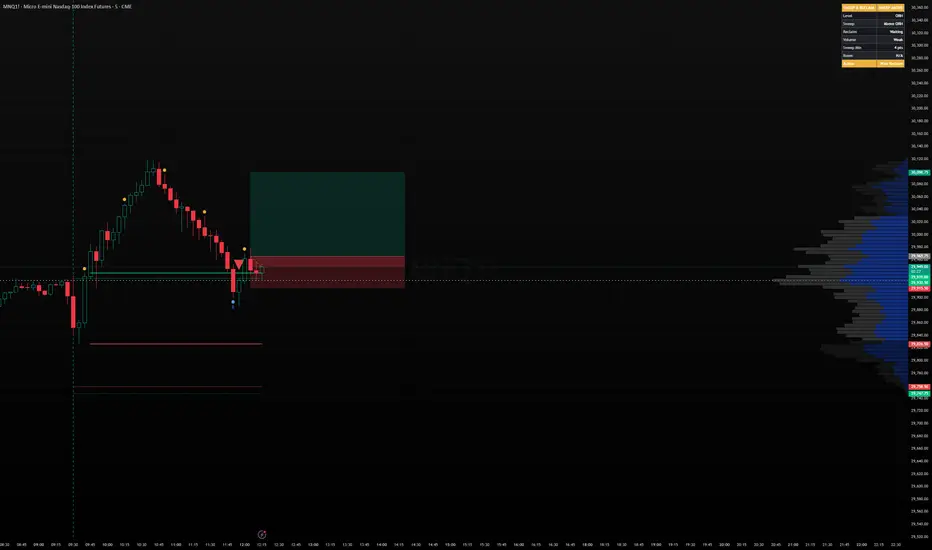
This setup is designed for traders who want to avoid chasing breakouts and instead wait for proof that a move beyond a key level has failed.
What This Indicator Tracks
The indicator automatically plots and monitors important levels, including:
New York open vertical line
Opening range high and low
Premarket high and low
Previous day high and low
Optional opening range midpoint
Sweep markers
Reclaim markers
Long and short trigger triangles
Relative volume / “Trap Fuel” context
A compact dashboard showing the current setup state
How the Setup Works
A bullish Sweep & Reclaim happens when price moves below an obvious support level, triggers stops or breakout shorts, then closes back above that level.
A bearish Sweep & Reclaim happens when price moves above an obvious resistance level, triggers breakout buyers or short stops, then closes back below that level.
The trade idea is not to enter during the sweep. The trade idea is to wait for the reclaim and then use the reclaim candle as the trigger structure.
For a long setup:
Price sweeps below support.
The sweep must exceed the minimum MNQ sweep threshold.
Price closes back above the swept level.
A reclaim marker appears.
A long trigger appears if price breaks above the reclaim candle high.
Stop placement is generally below the sweep low, with a small MNQ buffer.
For a short setup:
Price sweeps above resistance.
The sweep must exceed the minimum MNQ sweep threshold.
Price closes back below the swept level.
A reclaim marker appears.
A short trigger appears if price breaks below the reclaim candle low.
Stop placement is generally above the sweep high, with a small MNQ buffer.
Marker Meanings
S = Sweep
Price has moved beyond an obvious level by the required sweep distance.
R = Reclaim
Price has closed back through the swept level, suggesting the breakout or breakdown may have failed.
Green triangle = Long trigger
Price broke above the bullish reclaim candle high.
Red triangle = Short trigger
Price broke below the bearish reclaim candle low.
Dashboard States
The dashboard summarizes the current condition:
WAITING — No active sweep setup.
SWEEP BELOW — Price has swept below a support level.
SWEEP ABOVE — Price has swept above a resistance level.
LONG TRAP — Bullish reclaim is active.
SHORT TRAP — Bearish reclaim is active.
LONG TRIGGER — Long trigger has appeared.
SHORT TRIGGER — Short trigger has appeared.
OFF SESSION — Outside the active New York session.
Volume Context
The indicator includes relative volume context to help judge whether the sweep may have meaningful participation behind it.
For this setup, strong volume can be interpreted differently than in a normal breakout strategy.
If price sweeps a level on high volume and then reclaims, that volume may become trap fuel, because traders who entered the failed breakout may be forced to exit.
Volume states include:
Weak
Normal
Elevated
Trap Fuel
Best Used For
This indicator is best used on:
5-minute charts
New York cash session
Failed breakout / failed breakdown reversal setups
It is especially useful around:
Opening range high
Opening range low
Premarket high
Premarket low
Previous day high
Previous day low
Important Notes
This indicator is not intended to predict every reversal. A sweep does not automatically mean price must reverse.
The strongest setups usually happen when:
The level is obvious.
The sweep is meaningful.
Price reclaims quickly.
The reclaim candle is strong.
There is enough room to target at least 1.5R–2R.
The trade is not directly into a major opposing level.
Always use proper risk management and confirm the broader market context before entering a trade.
Nota Keluaran
- Showing less sweep dots to aid visual clarity.Skrip sumber terbuka
Dalam semangat TradingView sebenar, pencipta skrip ini telah menjadikannya sumber terbuka, jadi pedagang boleh menilai dan mengesahkan kefungsiannya. Terima kasih kepada penulis! Walaupuan anda boleh menggunakan secara percuma, ingat bahawa penerbitan semula kod ini tertakluk kepada Peraturan Dalaman.

Penafian
Maklumat dan penerbitan adalah tidak bertujuan, dan tidak membentuk, nasihat atau cadangan kewangan, pelaburan, dagangan atau jenis lain yang diberikan atau disahkan oleh TradingView. Baca lebih dalam Terma Penggunaan.
Skrip sumber terbuka
Dalam semangat TradingView sebenar, pencipta skrip ini telah menjadikannya sumber terbuka, jadi pedagang boleh menilai dan mengesahkan kefungsiannya. Terima kasih kepada penulis! Walaupuan anda boleh menggunakan secara percuma, ingat bahawa penerbitan semula kod ini tertakluk kepada Peraturan Dalaman.
Penafian
Maklumat dan penerbitan adalah tidak bertujuan, dan tidak membentuk, nasihat atau cadangan kewangan, pelaburan, dagangan atau jenis lain yang diberikan atau disahkan oleh TradingView. Baca lebih dalam Terma Penggunaan.