Telah dikemas kini
Monthly DCA Tracker by Equityram
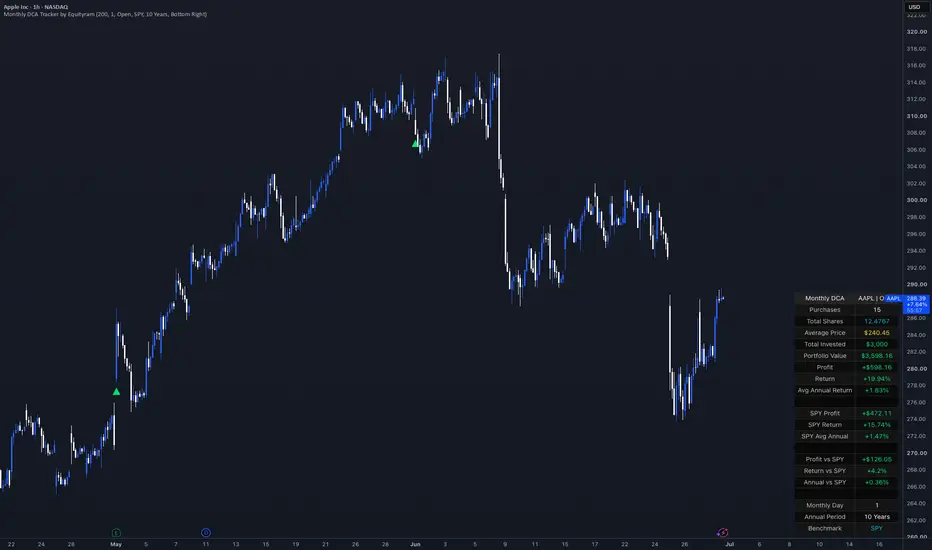
Monthly DCA Tracker by Equityram helps investors test how a simple dollar-cost averaging strategy would have performed on any chart.
The indicator simulates investing a fixed amount every month, starting from a selected date. Users can choose the monthly investment amount, preferred monthly investment day, execution price type, benchmark symbol, annual return period, and table position.
The table shows:
• Total purchases
• Total shares accumulated
• Average purchase price
• Total invested
• Current portfolio value
• Profit
• Total return
• Average annual return
• Benchmark profit
• Benchmark return
• Benchmark average annual return
• Profit and return comparison versus the selected benchmark
If the selected monthly investment day is not available on the chart, the script uses the next available trading day.
This tool is designed for educational backtesting and long-term investing analysis. It does not provide financial advice, buy/sell recommendations, or future performance predictions.
The indicator simulates investing a fixed amount every month, starting from a selected date. Users can choose the monthly investment amount, preferred monthly investment day, execution price type, benchmark symbol, annual return period, and table position.
The table shows:
• Total purchases
• Total shares accumulated
• Average purchase price
• Total invested
• Current portfolio value
• Profit
• Total return
• Average annual return
• Benchmark profit
• Benchmark return
• Benchmark average annual return
• Profit and return comparison versus the selected benchmark
If the selected monthly investment day is not available on the chart, the script uses the next available trading day.
This tool is designed for educational backtesting and long-term investing analysis. It does not provide financial advice, buy/sell recommendations, or future performance predictions.
Nota Keluaran
-
Penafian
Maklumat dan penerbitan adalah tidak bertujuan, dan tidak membentuk, nasihat atau cadangan kewangan, pelaburan, dagangan atau jenis lain yang diberikan atau disahkan oleh TradingView. Baca lebih dalam Terma Penggunaan.
Penafian
Maklumat dan penerbitan adalah tidak bertujuan, dan tidak membentuk, nasihat atau cadangan kewangan, pelaburan, dagangan atau jenis lain yang diberikan atau disahkan oleh TradingView. Baca lebih dalam Terma Penggunaan.