ZACS Market Toolkit, Sessions, PD PS, HTF EQ , EMA, MACD
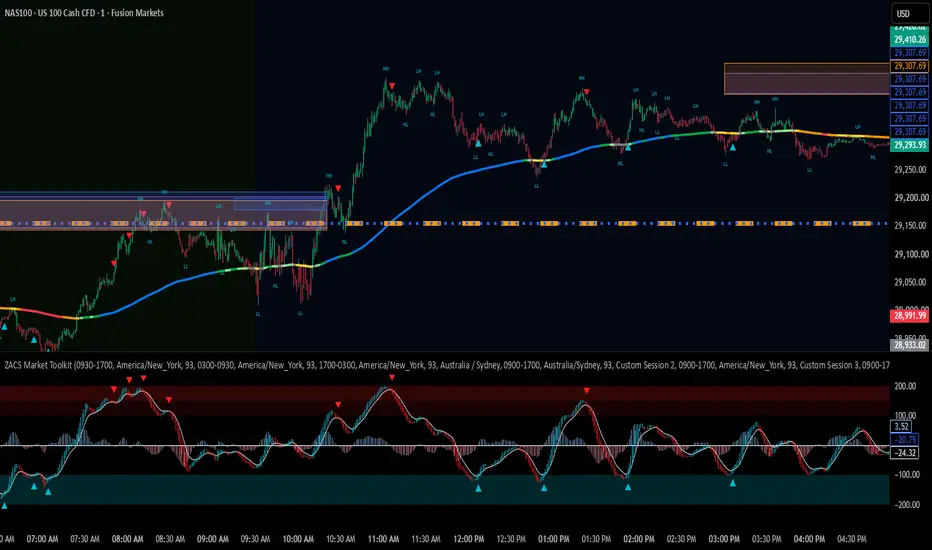
**ZACS Market Toolkit** is an advanced, all-in-one technical analysis indicator designed to bring multiple forms of market confluence into a single TradingView workspace.
The toolkit combines five analytical systems:
1. Six customizable trading session backgrounds
2. Previous Day and Previous Session High/Low levels with ATR-based clustering
3. CHoCH/BOS market structure and multi-timeframe Equal Swing Zones
4. Seven-state EMA slope strength and trend analysis
5. Heikin-Ashi MACD with Overbought/Oversold reversal signals
Each system can be customized independently, allowing traders to build a workspace around their preferred trading style.
The indicator is primarily designed for intraday trading and multi-timeframe analysis, particularly on 1-minute, 3-minute, and 5-minute charts, although it can be used on other compatible timeframes.
---
## 1. Trading Session Backgrounds
Identify major trading sessions directly on the price chart using customizable background shading.
**Default sessions (New York time):**
- New York: 09:30–17:00
- London: 03:00–09:30
- Asia: 17:00–03:00
Three additional customizable sessions are included, allowing users to define their own market windows.
Each session supports:
- Adjustable opening and closing times
- Independent time zones with daylight-saving support
- Custom background colors and transparency
- Optional session-opening labels
- Overnight trading windows
The three primary session definitions are shared with the Previous Session High/Low calculations to maintain consistent session boundaries.
## 2. Previous Day & Previous Session High/Low Levels
Automatically identifies and plots important historical liquidity and reference levels.
**Available levels:**
- Previous Day High (PDH)
- Previous Day Low (PDL)
- Previous New York High/Low
- Previous London High/Low
- Previous Asia High/Low
Previous-day levels are calculated from the instrument's completed TradingView daily periods, while previous-session levels use completed trading session ranges.
**ATR-Based Level Clustering**
The toolkit includes an advanced clustering engine that identifies nearby PD/PS levels.
Instead of displaying every level independently, traders can optionally display only levels that form meaningful clusters.
Customizable settings include:
- Maximum cluster width measured in ATR
- Minimum number of levels required
- PD + PS, any-two-level, or PS-only qualification
- Historical same-session ATR averaging
- Independent level colors, widths, and line styles
- Historical line retention and active-level projection
This can help identify areas where multiple historical support, resistance, or liquidity reference levels converge.
## 3. Market Structure — CHoCH / BOS
The integrated market structure engine identifies changes in price structure using confirmed internal and swing pivots.
**Features include:**
- Internal and swing market structure
- Break of Structure (BOS)
- Change of Character (CHoCH)
- Higher High, Higher Low, Lower High, and Lower Low labels
- Adjustable internal and swing detection lengths
- Optional candle coloring based on market structure direction
- Swing and internal trend confluence coloring
- Automatic structure-label staggering
Internal and swing structure can be displayed independently to reduce chart clutter.
These tools help traders recognize potential trend continuation, structure transitions, and changes in market direction.
## 4. Multi-Timeframe Equal Swing Zones
One of the toolkit's primary features is its ability to detect zones formed by two or more confirmed equal or near-equal swing highs or lows.
**Three independent higher-timeframe sources are included:**
- Source 1: 15-minute (default)
- Source 2: 30-minute (default)
- Source 3: 1-hour (default)
Each timeframe can be enabled or disabled independently, with customizable swing sensitivity and zone colors.
**Zone Detection**
The indicator compares confirmed swing points using an ATR-based price tolerance.
When qualifying swing highs or lows are sufficiently close, the indicator creates a zone representing their shared price area.
**Realistic Historical Zone Shading**
An important feature is the option to begin shading a zone only after its second qualifying swing point has been confirmed.
This setting is enabled by default.
Traditional historical pivot-zone indicators often draw zones backward from the first swing point, making it appear that a zone existed before sufficient information was available to confirm it.
With realistic shading enabled, zones begin only when they become available through the confirmation process.
This provides a more realistic historical representation of when zones could have been used for trading.
**Zone Management Features:**
- Adjustable equal-swing tolerance
- ATR-based zone padding
- Automatic zone extension
- Optional termination after confirmed close-through
- Chart-timeframe or source-timeframe invalidation
- Optional full-zone traversal invalidation
- Swing-wick anchor verification
- Optional confirmed pivot touch markers
- Independent timeframe colors
- Adjustable maximum displayed zones
These zones can help traders identify potential liquidity concentrations, repeated rejection areas, and future support or resistance interactions.
Confirmed pivot detection requires subsequent price information. A newly confirmed zone is therefore not necessarily available at the original swing candle.
## 5. Seven-State EMA Slope Strength
The toolkit includes the ZACS seven-state EMA trend analysis engine.
Unlike a simple bullish/bearish EMA color system, this engine measures EMA movement relative to Average True Range (ATR).
The EMA slope is classified into seven states:
1. Strongest Bullish
2. Strong Bullish
3. Weak Bullish
4. Neutral
5. Weak Bearish
6. Strong Bearish
7. Strongest Bearish
**Default EMA length: 200**
Users can customize:
- EMA length and source
- Slope calculation lookback
- ATR normalization period
- Neutral, strong, and strongest thresholds
- Individual colors, line widths, and styles
- Optional color locking until candle close
**Directional Qualification Filters**
The indicator also supports optional bullish and bearish qualification signals based on:
- Minimum slope strength (Weak+, Strong+, or Strongest Only)
- Price position relative to the EMA
- Entire candle body above or below the EMA
- Consecutive qualifying candles
**Trend Resumption Detection**
An additional signal engine identifies when an established bullish or bearish EMA slope temporarily becomes neutral before resuming in its original direction.
The maximum neutral-pause duration is adjustable, with a default of three candles.
Optional chart signals and a compact slope dashboard are included.
## 6. Heikin-Ashi MACD Overbought/Oversold Oscillator
The integrated Heikin-Ashi MACD provides momentum analysis in a separate lower indicator pane.
The oscillator combines normalized MACD calculations with synthetic Heikin-Ashi candles, allowing traders to examine momentum direction, transitions, and extreme conditions.
**Features include:**
- Adjustable MACD fast and slow lengths
- Custom signal-line smoothing
- Hybrid, MACD, and Histogram display modes
- Heikin-Ashi oscillator candles
- Momentum histogram
- Adjustable overbought and oversold levels
- Optional candle coloring
- OB/OS reversal signals
**Delayed Signal-Line Confirmation**
Rather than requiring immediate entry at the initial overbought or oversold reversal setup, the indicator can wait for additional confirmation.
When enabled, an initial OB/OS setup remains pending until the oscillator crosses its signal line in the appropriate direction.
The confirmation window is adjustable, with a default of six candles.
This allows traders to distinguish the initial momentum-extreme setup from the subsequent confirmation event.
Signals can be displayed both in the oscillator pane and directly on the price chart.
## 7. Alerts and Signal Notifications
The toolkit includes multiple TradingView alert conditions, including:
- Bullish and bearish EMA slope qualification
- Bullish and bearish trend resumption
- MACD overbought and oversold signals
- MACD signal-line crosses
- MACD midline crosses
- Heikin-Ashi momentum direction changes
A unified MACD OB/OS Buy/Sell alert is also included, allowing both directions to be monitored using a single alert condition.
The indicator supports confirmed-candle signal filtering to help avoid signals changing during an unfinished candle.
## 8. Combining the Systems for Confluence
The primary purpose of ZACS Market Toolkit is to bring independent analytical tools into one environment.
For example, a trader might observe:
- Price reaching a previously confirmed 15-minute equal-swing zone
- The same area overlapping a Previous Session High or Low
- A market structure transition
- The 200 EMA displaying directional slope strength
- A Heikin-Ashi MACD reversal receiving signal-line confirmation
The combination can provide additional context for evaluating a potential trade setup.
**Important:** These are complementary analytical observations, not a single automatically enforced entry strategy. Individual signals are generated according to their respective indicator logic.
## 9. Customization and Intended Use
The toolkit is designed to support traders who use:
- Intraday price action
- Multi-timeframe analysis
- Liquidity and support/resistance zones
- Market structure
- Trend-following strategies
- Momentum reversals
- Session-based trading
- Technical confluence
Its modular design allows users to activate only the features relevant to their trading methodology.
The indicator is especially suited to traders who prefer to assess multiple independent conditions before making discretionary trading decisions.
---
## Important Notes
ZACS Market Toolkit is an analytical indicator, not an automated trading strategy.
It does not guarantee profitable signals or predict future price movements.
Confirmed swing points require additional candles before they become identifiable. Historical displays should always be interpreted with confirmation timing in mind.
Some live-bar values and signals may change before candle confirmation, depending on the selected settings.
Traders should independently test all setups, account for trading costs, and use appropriate risk management.
## Credits
Developed and integrated by Zac.
The Heikin-Ashi MACD component incorporates original work by **EliCobra**, distributed under the Creative Commons Attribution-NonCommercial-ShareAlike 4.0 International (CC BY-NC-SA 4.0) license.
Original component attribution and license information are retained in the source code.
**ZACS Market Toolkit — Multiple market perspectives. One integrated trading workspace.**

Penafian
Maklumat dan penerbitan adalah tidak bertujuan, dan tidak membentuk, nasihat atau cadangan kewangan, pelaburan, dagangan atau jenis lain yang diberikan atau disahkan oleh TradingView. Baca lebih dalam Terma Penggunaan.
Penafian
Maklumat dan penerbitan adalah tidak bertujuan, dan tidak membentuk, nasihat atau cadangan kewangan, pelaburan, dagangan atau jenis lain yang diberikan atau disahkan oleh TradingView. Baca lebih dalam Terma Penggunaan.