█ Overview
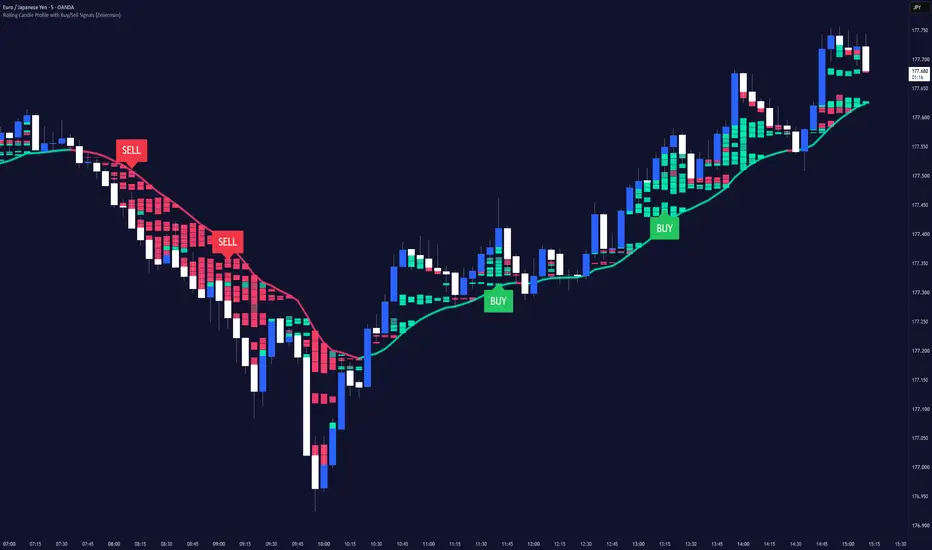
Rolling Candle Profile with Buy/Sell Signals (Zeiierman) is a dynamic price-pressure indicator that visualizes buying and selling dominance, directional pressure concentrations, and weak-pressure regions directly on the chart.
The indicator constructs a 12-layer Rolling Pressure Profile between the current candle body and a selected price anchor.
Each layer independently measures directional pressure, creating a continuously updating gradient.
• Green Bands = dominant buying pressure
• Red Bands = dominant selling pressure
• Transparent Regions = weak or insufficient directional pressure
• Green/Red Anchor = rising or falling anchor direction

Three pressure calculation modes are available:
• Price Pressure = price movement, follow-through, and wick rejection
• Volume Delta = estimated directional buying and selling volume
• Hybrid = combines price response with volume
The indicator also generates BUY and SELL signals when the Rolling Profile, price position, and anchor direction align.

█ How It Works
█ How to Use
⚪ Trend Trading
Use the anchor direction and Rolling Profile to identify the prevailing pressure environment.
• Bullish: Price above a rising anchor with predominantly green bands
• Bearish: Price below a falling anchor with predominantly red bands
BUY/SELL labels identify fresh directional alignments.

█ Settings
-----------------
Disclaimer
The content provided in my scripts, indicators, ideas, algorithms, and systems is for educational and informational purposes only. It does not constitute financial advice, investment recommendations, or a solicitation to buy or sell any financial instruments. I will not accept liability for any loss or damage, including without limitation any loss of profit, which may arise directly or indirectly from the use of or reliance on such information.
All investments involve risk, and the past performance of a security, industry, sector, market, financial product, trading strategy, backtest, or individual's trading does not guarantee future results or returns. Investors are fully responsible for any investment decisions they make. Such decisions should be based solely on an evaluation of their financial circumstances, investment objectives, risk tolerance, and liquidity needs.
Rolling Candle Profile with Buy/Sell Signals (Zeiierman) is a dynamic price-pressure indicator that visualizes buying and selling dominance, directional pressure concentrations, and weak-pressure regions directly on the chart.
The indicator constructs a 12-layer Rolling Pressure Profile between the current candle body and a selected price anchor.
Each layer independently measures directional pressure, creating a continuously updating gradient.
• Green Bands = dominant buying pressure
• Red Bands = dominant selling pressure
• Transparent Regions = weak or insufficient directional pressure
• Green/Red Anchor = rising or falling anchor direction
Three pressure calculation modes are available:
• Price Pressure = price movement, follow-through, and wick rejection
• Volume Delta = estimated directional buying and selling volume
• Hybrid = combines price response with volume
The indicator also generates BUY and SELL signals when the Rolling Profile, price position, and anchor direction align.
█ How It Works
⚪ Rolling Pressure Profile
The indicator divides the distance between the anchor and the nearest candle-body edge into 12 independent pressure bands.
Each band analyzes localized buying and selling activity using the most recent 60 candles, with stronger weighting toward recent pressure.Pine Script®
Band colors reflect directional imbalance and activity. Stronger pressure produces more prominent colors, while weak-pressure regions become transparent.
⚪ Pressure Engine
• Price Pressure measures price displacement, candle-body direction, closing location, and wick rejection. Consecutive directional movements receive additional weight.
• Volume Delta estimates buying and selling participation using candle direction and available volume. It does not represent true bid/ask delta.
• Hybrid combines volume with directional price response.
⚪ Dynamic Anchor
The anchor defines the reference point for the pressure corridor.
Available anchors include EMA, SMA, VWMA, VWAP, and Donchian Mid.
The line turns green when rising and red when falling, with a subtle glow to highlight directional changes.
⚪ BUY / SELL Signals
Signals are calculated from the pressure of the visible colored bands.
BUY requires:
• Dominant buying pressure
• Sufficient colored profile bands
• Price above a rising anchor
• Fresh bullish alignment
SELL requires:
• Dominant selling pressure
• Sufficient colored profile bands
• Price below a falling anchor
• Fresh bearish alignment
█ How to Use
⚪ Trend Trading
Use the anchor direction and Rolling Profile to identify the prevailing pressure environment.
• Bullish: Price above a rising anchor with predominantly green bands
• Bearish: Price below a falling anchor with predominantly red bands
BUY/SELL labels identify fresh directional alignments.
█ Settings
- Anchor: EMA, SMA, VWMA, VWAP, or Donchian Mid.
- Length: Anchor calculation period. Default: 21.
- Pressure Input: Price Pressure, Volume Delta, or Hybrid.
- Intrabar Timeframe: Automatic or manual timeframe selection.
- Manual Timeframe: Selected timeframe for intrabar analysis.
- Price-Localization Width: Controls the concentration or smoothness of pressure pockets.
- Wick Rejection Influence: Controls how strongly wick rejection contributes to directional pressure.
- Brightness: Controls gradient intensity.
- Buying/Selling Pressure: Customizable directional colors.
- Show Anchor: Displays the direction-colored anchor and glow.
- BUY / SELL Signals: Enables or disables signals.
- Pressure Dominance Threshold: Required directional imbalance. Default: 0.25.
- Minimum Colored Bands: Minimum visible bands required. Default: 7.
- Minimum Signal Spacing: Bars between repeated same-direction signals. Default: 6.
-----------------
Disclaimer
The content provided in my scripts, indicators, ideas, algorithms, and systems is for educational and informational purposes only. It does not constitute financial advice, investment recommendations, or a solicitation to buy or sell any financial instruments. I will not accept liability for any loss or damage, including without limitation any loss of profit, which may arise directly or indirectly from the use of or reliance on such information.
All investments involve risk, and the past performance of a security, industry, sector, market, financial product, trading strategy, backtest, or individual's trading does not guarantee future results or returns. Investors are fully responsible for any investment decisions they make. Such decisions should be based solely on an evaluation of their financial circumstances, investment objectives, risk tolerance, and liquidity needs.
Skrip sumber terbuka
Dalam semangat TradingView sebenar, pencipta skrip ini telah menjadikannya sumber terbuka, jadi pedagang boleh menilai dan mengesahkan kefungsiannya. Terima kasih kepada penulis! Walaupuan anda boleh menggunakan secara percuma, ingat bahawa penerbitan semula kod ini tertakluk kepada Peraturan Dalaman.

Access my indicators at: zeiierman.com
Join Our Free Discord: discord.gg/zeiiermantrading
Join Our Free Discord: discord.gg/zeiiermantrading
Penafian
Maklumat dan penerbitan adalah tidak bertujuan, dan tidak membentuk, nasihat atau cadangan kewangan, pelaburan, dagangan atau jenis lain yang diberikan atau disahkan oleh TradingView. Baca lebih dalam Terma Penggunaan.
Skrip sumber terbuka
Dalam semangat TradingView sebenar, pencipta skrip ini telah menjadikannya sumber terbuka, jadi pedagang boleh menilai dan mengesahkan kefungsiannya. Terima kasih kepada penulis! Walaupuan anda boleh menggunakan secara percuma, ingat bahawa penerbitan semula kod ini tertakluk kepada Peraturan Dalaman.
Access my indicators at: zeiierman.com
Join Our Free Discord: discord.gg/zeiiermantrading
Join Our Free Discord: discord.gg/zeiiermantrading
Penafian
Maklumat dan penerbitan adalah tidak bertujuan, dan tidak membentuk, nasihat atau cadangan kewangan, pelaburan, dagangan atau jenis lain yang diberikan atau disahkan oleh TradingView. Baca lebih dalam Terma Penggunaan.