OPEN-SOURCE SCRIPT
Parabolic Move Detector
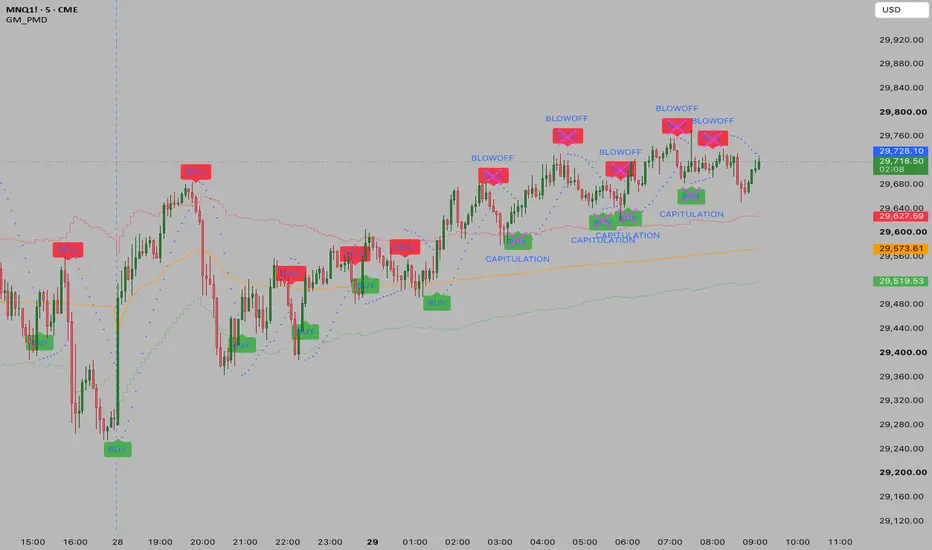
It achieves this by combining two completely different mathematical concepts: Momentum Acceleration and Mean Reversion Overextension.
Here is how the script works under the hood:
1. Momentum Acceleration (Parabolic SAR)
First, the script calculates the standard Parabolic SAR (Stop and Reverse).
PSAR prints small dots above or below the price candles.
It is designed to trail the price and physically "accelerate" (move closer to the price) the longer a trend goes on.
When the price finally hits the PSAR dots, the dots flip to the other side. This generates the baseline BUY (bullish momentum shift) and SELL (bearish momentum shift) signals you see on the chart.
2. Overextension (VWAP + ATR Stretch)
A momentum flip alone isn't enough to call a "parabolic reversal"—you need to know if the asset is historically overextended.
The script calculates the VWAP (Volume Weighted Average Price), which acts as the asset's "fair value" mean for the day/session.
It then calculates the ATR (Average True Range) to measure the current volatility.
It draws an Upper Stretch Limit and a Lower Stretch Limit. These are created by adding/subtracting a multiple of the ATR (default 2.0x) from the VWAP. If the price travels outside these bands, the script flags the asset as isStretched (officially in a parabolic/overextended state).
3. The Reversal Detection (The "Blowoff")
The true power of the script lies in combining these two concepts to filter out false signals.
A standard PSAR flip happens all the time in choppy markets. But a Blow-off Top or Capitulation Bottom is exceptionally rare. The script demands two things happen simultaneously to trigger the major alerts:
The price must be heavily deviated from its mean volume price (isStretched).
The accelerating momentum must break (buySignal or sellSignal).
pinescript
blowoffTop = isStretched and sellSignal
capitulationBottom = isStretched and buySignal
BLOWOFF: Prints a large fuchsia cross above the candle. It means the price went on a massive run above the Upper Stretch Limit, and the buyers just failed to hold the momentum, causing the PSAR to flip bearish.
CAPITULATION: Prints a large fuchsia cross below the candle. It means the price dumped severely below the Lower Stretch Limit, and sellers just exhausted themselves, causing the PSAR to flip bullish.
These exact moments are often the highest-probability, lowest-risk areas to catch a violent mean-reversion trade!
Skrip sumber terbuka
Dalam semangat TradingView sebenar, pencipta skrip ini telah menjadikannya sumber terbuka, jadi pedagang boleh menilai dan mengesahkan kefungsiannya. Terima kasih kepada penulis! Walaupuan anda boleh menggunakan secara percuma, ingat bahawa penerbitan semula kod ini tertakluk kepada Peraturan Dalaman.

Penafian
Maklumat dan penerbitan adalah tidak bertujuan, dan tidak membentuk, nasihat atau cadangan kewangan, pelaburan, dagangan atau jenis lain yang diberikan atau disahkan oleh TradingView. Baca lebih dalam Terma Penggunaan.
Skrip sumber terbuka
Dalam semangat TradingView sebenar, pencipta skrip ini telah menjadikannya sumber terbuka, jadi pedagang boleh menilai dan mengesahkan kefungsiannya. Terima kasih kepada penulis! Walaupuan anda boleh menggunakan secara percuma, ingat bahawa penerbitan semula kod ini tertakluk kepada Peraturan Dalaman.
Penafian
Maklumat dan penerbitan adalah tidak bertujuan, dan tidak membentuk, nasihat atau cadangan kewangan, pelaburan, dagangan atau jenis lain yang diberikan atau disahkan oleh TradingView. Baca lebih dalam Terma Penggunaan.