[core convexity] annualized projection
old project
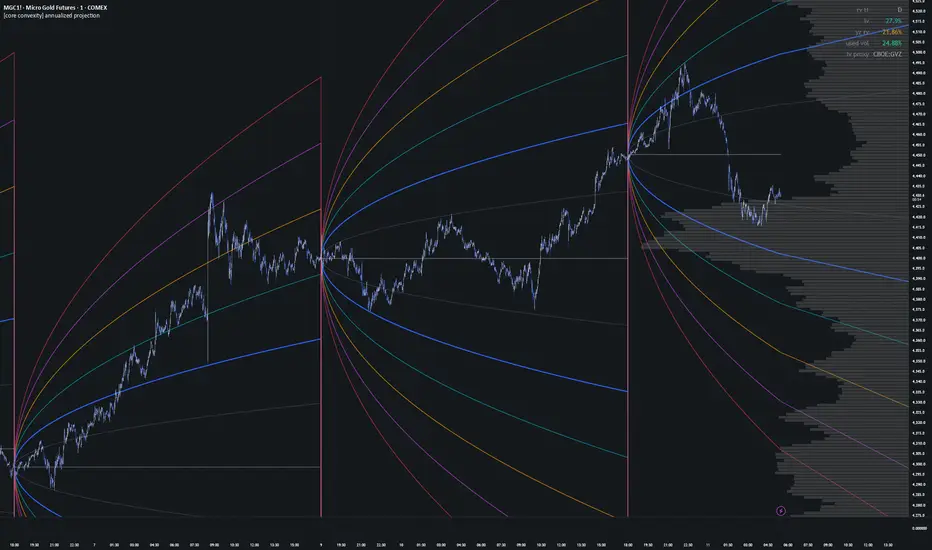
a volatility framework for mapping expected price movement around an anchor using annualized implied and realized volatility.
the core idea is pretty simple: volatility is expressed on a yearly basis, then scaled down to whatever amount of time has actually passed. if annualized volatility is v, the expected standard deviation over some fraction of a year is approximately v × √t. the bands then translate that volatility into price space around the selected anchor using a lognormal-style exponential projection.
that lets the same volatility estimate be used consistently across different horizons. a 20% annualized volatility input does not mean price is expected to move 20% today — it means the one-year standard deviation is roughly 20%, and shorter horizons are scaled by the square-root-of-time relationship.
realized volatility uses the yang-zhang estimator only. it combines overnight moves, open-to-close variance and the rogers-satchell range component, which makes it useful for markets where gaps and intraday range both matter. the result is annualized using the selected number of rv periods per year.
implied volatility can come from an automatically selected volatility proxy, a manual symbol, or a fixed percentage. the volatility model can use iv only, yang-zhang rv only, or blend the two. conceptually, iv represents what the options market is pricing forward while rv represents what the underlying has actually been realizing.
in anchored cone mode, volatility expands outward from a fixed price anchor as elapsed time increases. the width grows with √t, so the cone naturally widens more slowly over time rather than linearly.
in rolling bands mode, the structure behaves more like live volatility bands: the center follows current price and the envelope continuously expands or contracts as the active volatility estimate changes. instead of asking “how far could price move from this old anchor by now?”, it asks “given volatility right now, what does the current expected-move envelope look like?”
standard bands are expressed in sigma multiples, with optional fibonacci-style deviation levels for finer subdivisions. these are volatility-based reference levels, not probability guarantees or directional forecasts.
yang-zhang can run on its own timeframe independently of the chart, including lower-timeframe rv sampling when used on a higher-timeframe chart. the anchor and cone geometry remain separate from the rv timeframe so changing the volatility sampling resolution does not redefine where the cone starts.
forward projection extends the current structure beyond the last bar. anchored mode continues widening from the original anchor, while rolling mode projects the current recalculated envelope as a live snapshot.
all plot colors are implemented with compile-time constant colors so tradingview keeps the normal color controls available in settings → style.
a volatility framework for mapping expected price movement around an anchor using annualized implied and realized volatility.
the core idea is pretty simple: volatility is expressed on a yearly basis, then scaled down to whatever amount of time has actually passed. if annualized volatility is v, the expected standard deviation over some fraction of a year is approximately v × √t. the bands then translate that volatility into price space around the selected anchor using a lognormal-style exponential projection.
that lets the same volatility estimate be used consistently across different horizons. a 20% annualized volatility input does not mean price is expected to move 20% today — it means the one-year standard deviation is roughly 20%, and shorter horizons are scaled by the square-root-of-time relationship.
realized volatility uses the yang-zhang estimator only. it combines overnight moves, open-to-close variance and the rogers-satchell range component, which makes it useful for markets where gaps and intraday range both matter. the result is annualized using the selected number of rv periods per year.
implied volatility can come from an automatically selected volatility proxy, a manual symbol, or a fixed percentage. the volatility model can use iv only, yang-zhang rv only, or blend the two. conceptually, iv represents what the options market is pricing forward while rv represents what the underlying has actually been realizing.
in anchored cone mode, volatility expands outward from a fixed price anchor as elapsed time increases. the width grows with √t, so the cone naturally widens more slowly over time rather than linearly.
in rolling bands mode, the structure behaves more like live volatility bands: the center follows current price and the envelope continuously expands or contracts as the active volatility estimate changes. instead of asking “how far could price move from this old anchor by now?”, it asks “given volatility right now, what does the current expected-move envelope look like?”
standard bands are expressed in sigma multiples, with optional fibonacci-style deviation levels for finer subdivisions. these are volatility-based reference levels, not probability guarantees or directional forecasts.
yang-zhang can run on its own timeframe independently of the chart, including lower-timeframe rv sampling when used on a higher-timeframe chart. the anchor and cone geometry remain separate from the rv timeframe so changing the volatility sampling resolution does not redefine where the cone starts.
forward projection extends the current structure beyond the last bar. anchored mode continues widening from the original anchor, while rolling mode projects the current recalculated envelope as a live snapshot.
all plot colors are implemented with compile-time constant colors so tradingview keeps the normal color controls available in settings → style.

Penafian
Maklumat dan penerbitan adalah tidak bertujuan, dan tidak membentuk, nasihat atau cadangan kewangan, pelaburan, dagangan atau jenis lain yang diberikan atau disahkan oleh TradingView. Baca lebih dalam Terma Penggunaan.
Penafian
Maklumat dan penerbitan adalah tidak bertujuan, dan tidak membentuk, nasihat atau cadangan kewangan, pelaburan, dagangan atau jenis lain yang diberikan atau disahkan oleh TradingView. Baca lebih dalam Terma Penggunaan.