OPEN-SOURCE SCRIPT
Pressure Zone Analyzer [JOAT]
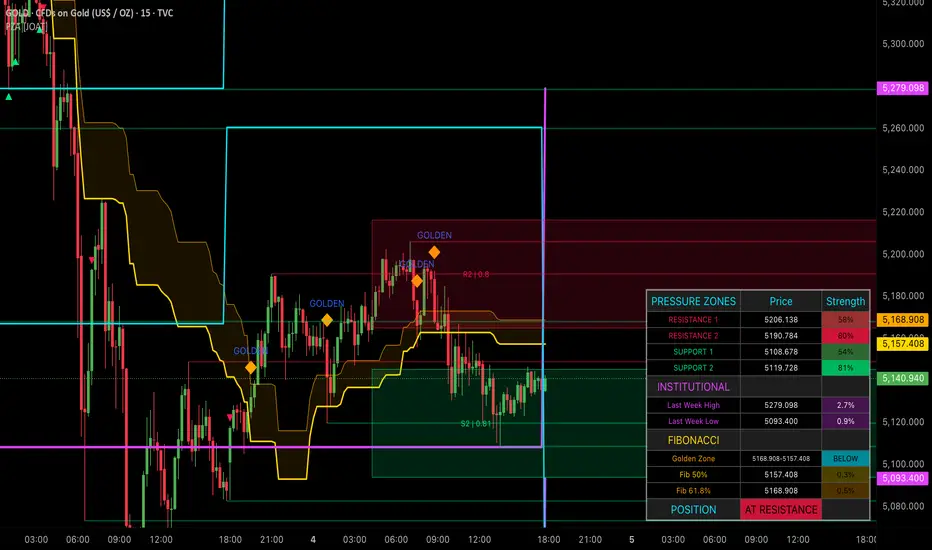
Pressure Zone Analyzer [JOAT]
Introduction
The Pressure Zone Analyzer is an advanced open-source support/resistance indicator that combines dynamic pivot-based zone detection, Fibonacci level analysis, institutional level tracking, zone strength scoring, and multi-timeframe analysis into a comprehensive pressure zone intelligence system. This indicator helps traders identify where significant buying and selling pressure exists, where institutional levels act as magnets for price, and which zones have the highest probability of holding.
Unlike basic support/resistance indicators that draw static horizontal lines, this analyzer dynamically tracks pressure zones based on pivot points, calculates zone strength using volume, touches, and age, integrates Fibonacci golden zone analysis, monitors institutional weekly/daily levels, and provides real-time position assessment. The indicator is designed for traders who understand that not all support/resistance levels are equal and that zone quality determines trading success.

Why This Indicator Exists
This indicator addresses the challenge of identifying high-quality support and resistance zones in real-time. Markets respect some levels and ignore others. By systematically analyzing zone characteristics, this indicator reveals:
Each component provides different zone intelligence. Pivot-based zones show where price reversed, strength scoring shows zone quality, Fibonacci shows mathematical levels, institutional levels show reference points, premium/discount shows institutional bias, and position assessment shows current market context. Together, they create a comprehensive pressure zone system.
Core Components Explained
1. Dynamic Pivot-Based Zone Detection
Pressure zones are identified using pivot highs and lows:
Pine Script®
When a pivot high is detected, a resistance zone is created:
Pine Script®
Similarly for support zones with pivot lows. Zones are stored in arrays and automatically managed (old zones are removed when maximum count is reached).
Zone thickness is calculated as a percentage of price:
Pine Script®

Default thickness is 0.5% of price, creating a zone rather than a single line. This accounts for the fact that support/resistance is a zone, not a precise price level.
2. Zone Strength Scoring System
Zone strength is calculated using three weighted components:
Pine Script®
Default weights:
Strength interpretation:
The indicator tracks touches in real-time:
Pine Script®
Each touch increases zone strength, and high-volume touches increase it further.
3. Fibonacci Level Analysis
Fibonacci levels are calculated based on recent swing range:
Pine Script®
The indicator focuses on key levels:
Golden Zone is calculated as the area between 50% and 61.8%:
Pine Script®
The golden zone represents optimal entry area with best risk:reward ratio. Entries in the golden zone allow tight stops below 50% with targets at swing high.
4. Institutional Level Tracking
The indicator monitors key institutional reference levels:
Weekly High/Low:
Pine Script®
Daily High/Low:
Pine Script®
These levels act as magnets for price because:
5. Premium/Discount Zone System
Based on weekly range, the indicator calculates institutional bias zones:
Pine Script®
Trading logic:
This concept is based on institutional order flow: institutions buy in discount zones (value area) and sell in premium zones (overvalued area).
6. Multi-Timeframe Level Analysis
The indicator tracks higher timeframe levels for additional confluence:
Pine Script®
HTF timeframe is customizable (default: Daily). When current timeframe zones align with HTF levels, confluence increases zone strength.
7. Real-Time Position Assessment
The indicator continuously assesses price position:
Pine Script®
Position status:

Visual Elements
Input Parameters
Pressure Zone Settings:
Fibonacci Settings:
Institutional Levels:
Strength Scoring:
Multi-Timeframe:
Colors:
All colors are fully customizable including resistance, support, Fibonacci, golden zone, HTF levels, and institutional levels.
How to Use This Indicator
Step 1: Identify Strongest Zones
Look at the table to see top 2 resistance and support zones with strength percentages. Focus on zones with strength > 70%.
Step 2: Check Institutional Levels
Monitor weekly and daily highs/lows. These act as magnets for price and often provide strong support/resistance.
Step 3: Assess Premium/Discount Position
Determine if price is in premium zone (look for shorts), discount zone (look for longs), or golden zone (optimal entries).
Step 4: Look for Fibonacci Confluence
When pressure zones align with Fibonacci levels (especially 50% and 61.8%), zone strength increases significantly.
Step 5: Monitor Position Status
Check the table's position row. "AT RESISTANCE" or "AT SUPPORT" signals potential reversal or bounce areas.
Step 6: Wait for Zone Tests
Don't chase price. Wait for price to return to strong zones before entering. The best entries occur when price tests a zone and shows rejection.
Step 7: Use HTF Confluence
When current timeframe zones align with HTF levels, probability of zone holding increases. Look for these high-confluence areas.

Best Practices
Indicator Limitations
Technical Implementation
Built with Pine Script v6 using:
The code is fully open-source and can be modified to suit individual trading styles and preferences.
Originality Statement
This indicator is original in its comprehensive pressure zone analysis. While individual components (pivot-based S/R, Fibonacci, institutional levels) are established concepts, this indicator is justified because:
Each component contributes unique zone intelligence: pivot zones show where price reversed, strength scoring shows zone quality, Fibonacci shows mathematical levels, institutional levels show reference points, premium/discount shows institutional bias, HTF levels show confluence, and position assessment shows current context. The indicator's value lies in presenting these complementary perspectives simultaneously with quantitative strength scoring and intelligent display management.
Disclaimer
This indicator is provided for educational and informational purposes only. It is not financial advice or a recommendation to buy or sell any financial instrument. Trading involves substantial risk of loss and is not suitable for all investors.
Pressure zone analysis is a tool for identifying potential support and resistance areas, not a crystal ball for predicting future price movement. Strong zones, high strength scores, and institutional levels do not guarantee profitable trades. Past zone behavior does not guarantee future zone behavior. Market conditions change, and strategies that worked historically may not work in the future.
The zones and levels displayed are mathematical calculations based on current market data, not predictions of future price movement. High-strength zones can break, golden zone entries can fail, and institutional levels can be violated. Users must conduct their own analysis and risk assessment before making trading decisions.
Always use proper risk management, including stop losses and position sizing appropriate for your account size and risk tolerance. Never risk more than you can afford to lose. Consider consulting with a qualified financial advisor before making investment decisions.
The author is not responsible for any losses incurred from using this indicator. Users assume full responsibility for all trading decisions made using this tool.
-Made with passion by officialjackofalltrades
Introduction
The Pressure Zone Analyzer is an advanced open-source support/resistance indicator that combines dynamic pivot-based zone detection, Fibonacci level analysis, institutional level tracking, zone strength scoring, and multi-timeframe analysis into a comprehensive pressure zone intelligence system. This indicator helps traders identify where significant buying and selling pressure exists, where institutional levels act as magnets for price, and which zones have the highest probability of holding.
Unlike basic support/resistance indicators that draw static horizontal lines, this analyzer dynamically tracks pressure zones based on pivot points, calculates zone strength using volume, touches, and age, integrates Fibonacci golden zone analysis, monitors institutional weekly/daily levels, and provides real-time position assessment. The indicator is designed for traders who understand that not all support/resistance levels are equal and that zone quality determines trading success.
Why This Indicator Exists
This indicator addresses the challenge of identifying high-quality support and resistance zones in real-time. Markets respect some levels and ignore others. By systematically analyzing zone characteristics, this indicator reveals:
- Dynamic Pressure Zones: Identifies support and resistance zones based on pivot points with automatic updates
- Zone Strength Scoring: Calculates zone quality (0-100%) using volume, touch count, and age
- Fibonacci Integration: Tracks key Fibonacci levels (23.6%, 38.2%, 50%, 61.8%, 78.6%) and golden zone (50-61.8%)
- Institutional Levels: Monitors weekly and daily highs/lows that act as institutional reference points
- Premium/Discount Zones: Identifies institutional buying zones (discount 0-30%) and selling zones (premium 70-100%)
- Multi-Timeframe Analysis: Tracks higher timeframe levels for additional confluence
- Position Assessment: Provides real-time analysis of price position relative to all zones
Each component provides different zone intelligence. Pivot-based zones show where price reversed, strength scoring shows zone quality, Fibonacci shows mathematical levels, institutional levels show reference points, premium/discount shows institutional bias, and position assessment shows current market context. Together, they create a comprehensive pressure zone system.
Core Components Explained
1. Dynamic Pivot-Based Zone Detection
Pressure zones are identified using pivot highs and lows:
When a pivot high is detected, a resistance zone is created:
Similarly for support zones with pivot lows. Zones are stored in arrays and automatically managed (old zones are removed when maximum count is reached).
Zone thickness is calculated as a percentage of price:
Default thickness is 0.5% of price, creating a zone rather than a single line. This accounts for the fact that support/resistance is a zone, not a precise price level.
2. Zone Strength Scoring System
Zone strength is calculated using three weighted components:
Default weights:
- Volume Weight: 40% - Higher volume at zone formation indicates institutional interest
- Touch Weight: 30% - More touches indicate stronger zone
- Age Weight: 30% - Newer zones are more relevant than old zones
Strength interpretation:
- > 70%: Strong zone - high probability of holding
- 50-70%: Moderate zone - decent probability of holding
- < 50%: Weak zone - lower probability of holding
The indicator tracks touches in real-time:
Each touch increases zone strength, and high-volume touches increase it further.
3. Fibonacci Level Analysis
Fibonacci levels are calculated based on recent swing range:
The indicator focuses on key levels:
- 50% (0.5): Equilibrium level - often acts as support/resistance
- 61.8% (0.618): Golden ratio - strongest Fibonacci level
Golden Zone is calculated as the area between 50% and 61.8%:
The golden zone represents optimal entry area with best risk:reward ratio. Entries in the golden zone allow tight stops below 50% with targets at swing high.
4. Institutional Level Tracking
The indicator monitors key institutional reference levels:
Weekly High/Low:
Daily High/Low:
These levels act as magnets for price because:
- Institutional algorithms reference these levels for order placement
- Retail traders watch these levels for breakouts/breakdowns
- Options and futures contracts often reference these levels
- Previous day/week ranges provide context for current price action
5. Premium/Discount Zone System
Based on weekly range, the indicator calculates institutional bias zones:
Trading logic:
- In Discount Zone: Look for long entries - institutions are likely buying
- In Premium Zone: Look for short entries - institutions are likely selling
- In Golden Zone: Optimal risk:reward for entries in direction of trend
- Between Zones: Neutral area - wait for price to reach discount or premium
This concept is based on institutional order flow: institutions buy in discount zones (value area) and sell in premium zones (overvalued area).
6. Multi-Timeframe Level Analysis
The indicator tracks higher timeframe levels for additional confluence:
HTF timeframe is customizable (default: Daily). When current timeframe zones align with HTF levels, confluence increases zone strength.
7. Real-Time Position Assessment
The indicator continuously assesses price position:
Position status:
- AT RESISTANCE: Price near strong resistance zone - consider shorts or exits
- AT SUPPORT: Price near strong support zone - consider longs or exits
- GOLDEN ZONE: Price in optimal entry area - look for entries in trend direction
- NEUTRAL: Price not near any significant zones - wait for better positioning
Visual Elements
- Pressure Zone Lines: Horizontal lines showing resistance (red) and support (green) zones
- Zone Strength Boxes: Filled boxes showing only strongest zones (strength > 60%) with strength percentage
- Fibonacci Lines: Key Fibonacci levels (50% and 61.8%) with distinct colors
- Golden Zone Fill: Shaded area between 50% and 61.8% Fibonacci levels
- Institutional Lines: Weekly high/low (purple, thick) and Daily high/low (yellow, medium)
- HTF Lines: Higher timeframe high/low (cyan) for additional confluence
- Premium/Discount Fills: Shaded zones showing premium (red), discount (green), and golden (orange) areas
- Position Markers: Visual alerts when price enters golden zone or approaches strong zones
- Comprehensive Table: Dashboard showing top 2 resistance zones, top 2 support zones, institutional levels, Fibonacci levels, and current position status
Input Parameters
Pressure Zone Settings:
- Zone Detection Length: Period for swing range calculation (default: 50, range: 20-200)
- Pivot Length: Period for pivot detection (default: 10, range: 5-50)
- Max Zones: Maximum zones to display (default: 8, range: 4-20)
- Zone Thickness Percent: Zone width as percentage of price (default: 0.5%, range: 0.1-2.0%)
Fibonacci Settings:
- Show Fibonacci Levels: Toggle Fib lines (default: enabled)
- Show Golden Zone: Toggle golden zone fill (default: enabled)
Institutional Levels:
- Show Last Week High/Low: Toggle weekly levels (default: enabled)
- Show Yesterday High/Low: Toggle daily levels (default: enabled)
Strength Scoring:
- Show Zone Strength: Toggle strength boxes (default: enabled)
- Volume Weight: Weight for volume component (default: 0.4, range: 0.0-1.0)
- Touch Weight: Weight for touch component (default: 0.3, range: 0.0-1.0)
- Age Weight: Weight for age component (default: 0.3, range: 0.0-1.0)
Multi-Timeframe:
- HTF Timeframe: Higher timeframe for level tracking (default: Daily)
- Show HTF Levels: Toggle HTF lines (default: enabled)
Colors:
All colors are fully customizable including resistance, support, Fibonacci, golden zone, HTF levels, and institutional levels.
How to Use This Indicator
Step 1: Identify Strongest Zones
Look at the table to see top 2 resistance and support zones with strength percentages. Focus on zones with strength > 70%.
Step 2: Check Institutional Levels
Monitor weekly and daily highs/lows. These act as magnets for price and often provide strong support/resistance.
Step 3: Assess Premium/Discount Position
Determine if price is in premium zone (look for shorts), discount zone (look for longs), or golden zone (optimal entries).
Step 4: Look for Fibonacci Confluence
When pressure zones align with Fibonacci levels (especially 50% and 61.8%), zone strength increases significantly.
Step 5: Monitor Position Status
Check the table's position row. "AT RESISTANCE" or "AT SUPPORT" signals potential reversal or bounce areas.
Step 6: Wait for Zone Tests
Don't chase price. Wait for price to return to strong zones before entering. The best entries occur when price tests a zone and shows rejection.
Step 7: Use HTF Confluence
When current timeframe zones align with HTF levels, probability of zone holding increases. Look for these high-confluence areas.
Best Practices
- Use on 15-minute to 4-hour timeframes for optimal zone clarity
- Focus on zones with strength > 70% - these have highest probability of holding
- Multiple touches increase zone strength - zones that held before are likely to hold again
- Golden zone entries offer best risk:reward - tight stops with large targets
- Premium/discount zones work best in trending markets
- Weekly levels are stronger than daily levels - prioritize weekly when they conflict
- Wait for price to reach zones - don't anticipate, react
- Look for volume confirmation when zones are tested - high volume rejections are strongest
- Combine with price action - zones show where, price action shows when
- HTF confluence significantly increases zone strength - prioritize these areas
Indicator Limitations
- Zones don't always hold - even strong zones can break during major news or trend changes
- Zone strength is relative to recent history - not absolute
- Pivot-based detection requires sufficient price history - may not work on newly listed instruments
- Maximum zone limits (8 default) mean some valid zones may not be displayed
- Zone thickness is a percentage - may be too wide or narrow for some instruments
- Premium/discount zones are relative to weekly range - not absolute value areas
- Fibonacci levels are based on recent swing - may not align with longer-term structure
- The indicator shows zones, not direction - requires trader interpretation
- Works best on liquid instruments with clear support/resistance behavior
- Zone strength scoring is a guide, not a guarantee - strong zones can still fail
Technical Implementation
Built with Pine Script v6 using:
- Custom type definition for PressureZone with strength tracking
- Array-based storage for resistance and support zones
- Pivot-based zone detection with confirmation
- Multi-component zone strength scoring
- Touch and volume tracking for each zone
- Fibonacci level calculations
- Golden zone identification
- Multi-timeframe security requests for institutional levels
- Premium/discount zone calculations based on weekly range
- Real-time position assessment
- Dynamic table with 13 rows showing all metrics
- Overlap prevention for visual clarity
- Automatic zone cleanup when maximum count is reached
The code is fully open-source and can be modified to suit individual trading styles and preferences.
Originality Statement
This indicator is original in its comprehensive pressure zone analysis. While individual components (pivot-based S/R, Fibonacci, institutional levels) are established concepts, this indicator is justified because:
- It synthesizes five distinct zone analysis methodologies into a unified system
- Zone strength scoring combines volume, touches, and age with customizable weights
- Automatic zone management prevents clutter while highlighting strongest zones
- Integration of Fibonacci golden zone with pivot-based zones
- Premium/discount zone system based on institutional order flow concepts
- Multi-timeframe level tracking for confluence analysis
- Real-time position assessment provides actionable trading context
- Comprehensive table shows all metrics simultaneously for holistic analysis
- Overlap prevention ensures clean charts without sacrificing information
Each component contributes unique zone intelligence: pivot zones show where price reversed, strength scoring shows zone quality, Fibonacci shows mathematical levels, institutional levels show reference points, premium/discount shows institutional bias, HTF levels show confluence, and position assessment shows current context. The indicator's value lies in presenting these complementary perspectives simultaneously with quantitative strength scoring and intelligent display management.
Disclaimer
This indicator is provided for educational and informational purposes only. It is not financial advice or a recommendation to buy or sell any financial instrument. Trading involves substantial risk of loss and is not suitable for all investors.
Pressure zone analysis is a tool for identifying potential support and resistance areas, not a crystal ball for predicting future price movement. Strong zones, high strength scores, and institutional levels do not guarantee profitable trades. Past zone behavior does not guarantee future zone behavior. Market conditions change, and strategies that worked historically may not work in the future.
The zones and levels displayed are mathematical calculations based on current market data, not predictions of future price movement. High-strength zones can break, golden zone entries can fail, and institutional levels can be violated. Users must conduct their own analysis and risk assessment before making trading decisions.
Always use proper risk management, including stop losses and position sizing appropriate for your account size and risk tolerance. Never risk more than you can afford to lose. Consider consulting with a qualified financial advisor before making investment decisions.
The author is not responsible for any losses incurred from using this indicator. Users assume full responsibility for all trading decisions made using this tool.
-Made with passion by officialjackofalltrades
Skrip sumber terbuka
Dalam semangat TradingView sebenar, pencipta skrip ini telah menjadikannya sumber terbuka, jadi pedagang boleh menilai dan mengesahkan kefungsiannya. Terima kasih kepada penulis! Walaupuan anda boleh menggunakan secara percuma, ingat bahawa penerbitan semula kod ini tertakluk kepada Peraturan Dalaman.

The AI Trading Ecosystem, Built to win trades 📈
Get Full Access 👇
jackofalltrades.vip 🌐
t.me/jackofalltradesvip 🃏
Get Full Access 👇
jackofalltrades.vip 🌐
t.me/jackofalltradesvip 🃏
Penafian
Maklumat dan penerbitan adalah tidak bertujuan, dan tidak membentuk, nasihat atau cadangan kewangan, pelaburan, dagangan atau jenis lain yang diberikan atau disahkan oleh TradingView. Baca lebih dalam Terma Penggunaan.
Skrip sumber terbuka
Dalam semangat TradingView sebenar, pencipta skrip ini telah menjadikannya sumber terbuka, jadi pedagang boleh menilai dan mengesahkan kefungsiannya. Terima kasih kepada penulis! Walaupuan anda boleh menggunakan secara percuma, ingat bahawa penerbitan semula kod ini tertakluk kepada Peraturan Dalaman.
The AI Trading Ecosystem, Built to win trades 📈
Get Full Access 👇
jackofalltrades.vip 🌐
t.me/jackofalltradesvip 🃏
Get Full Access 👇
jackofalltrades.vip 🌐
t.me/jackofalltradesvip 🃏
Penafian
Maklumat dan penerbitan adalah tidak bertujuan, dan tidak membentuk, nasihat atau cadangan kewangan, pelaburan, dagangan atau jenis lain yang diberikan atau disahkan oleh TradingView. Baca lebih dalam Terma Penggunaan.