OPEN-SOURCE SCRIPT
Volume vs MA20 Multiple
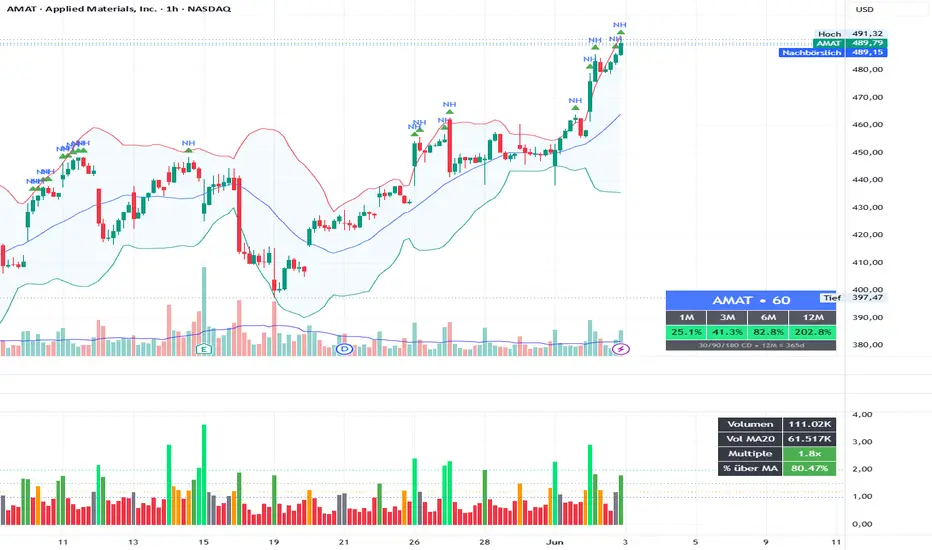
Volume vs MA20 Multiple
This indicator shows how the current candle’s volume compares to its moving average volume.
Instead of only displaying raw volume, it calculates a volume multiple relative to the selected volume moving average, for example:
The default setting uses a 20-period volume moving average, which means:
This makes it easier to judge whether a breakout, reversal, or pullback move is supported by meaningful volume.
How I use it
For breakout trades, I usually want to see price breaking above a key level while volume is clearly above average.
Typical interpretation:
The indicator can display both the multiple and the percentage above the moving average, making it useful for quickly validating whether a price move has real participation behind it.
This indicator is not a standalone buy or sell signal. It is intended to be used together with price action, support/resistance, trend structure, and risk management.
This indicator shows how the current candle’s volume compares to its moving average volume.
Instead of only displaying raw volume, it calculates a volume multiple relative to the selected volume moving average, for example:
- 1.0x = current volume equals the volume moving average
- 1.2x = current volume is 20% above average
- 1.5x = current volume is 50% above average
- 2.0x = current volume is twice the average volume
The default setting uses a 20-period volume moving average, which means:
- on the 1H chart, it compares the current hourly volume to the average of the last 20 hourly candles
- on the daily chart, it compares the current daily volume to the average of the last 20 daily candles
- on any timeframe, it automatically adapts to the selected chart timeframe
This makes it easier to judge whether a breakout, reversal, or pullback move is supported by meaningful volume.
How I use it
For breakout trades, I usually want to see price breaking above a key level while volume is clearly above average.
Typical interpretation:
- Below 1.0x: weak / below-average volume
- Around 1.0x: normal volume
- 1.2x – 1.5x: increased volume, potential confirmation
- 1.5x – 2.0x: strong volume confirmation
- Above 2.0x: very strong participation
The indicator can display both the multiple and the percentage above the moving average, making it useful for quickly validating whether a price move has real participation behind it.
- Best used for
- Breakout confirmation
- Pullback entries
- Reversal setups
- Intraday momentum analysis
- Comparing volume strength across different timeframes
This indicator is not a standalone buy or sell signal. It is intended to be used together with price action, support/resistance, trend structure, and risk management.
Skrip sumber terbuka
Dalam semangat TradingView sebenar, pencipta skrip ini telah menjadikannya sumber terbuka, jadi pedagang boleh menilai dan mengesahkan kefungsiannya. Terima kasih kepada penulis! Walaupuan anda boleh menggunakan secara percuma, ingat bahawa penerbitan semula kod ini tertakluk kepada Peraturan Dalaman.

Penafian
Maklumat dan penerbitan adalah tidak bertujuan, dan tidak membentuk, nasihat atau cadangan kewangan, pelaburan, dagangan atau jenis lain yang diberikan atau disahkan oleh TradingView. Baca lebih dalam Terma Penggunaan.
Skrip sumber terbuka
Dalam semangat TradingView sebenar, pencipta skrip ini telah menjadikannya sumber terbuka, jadi pedagang boleh menilai dan mengesahkan kefungsiannya. Terima kasih kepada penulis! Walaupuan anda boleh menggunakan secara percuma, ingat bahawa penerbitan semula kod ini tertakluk kepada Peraturan Dalaman.
Penafian
Maklumat dan penerbitan adalah tidak bertujuan, dan tidak membentuk, nasihat atau cadangan kewangan, pelaburan, dagangan atau jenis lain yang diberikan atau disahkan oleh TradingView. Baca lebih dalam Terma Penggunaan.