OPEN-SOURCE SCRIPT
Historical Pattern Projection [MarkitTick]
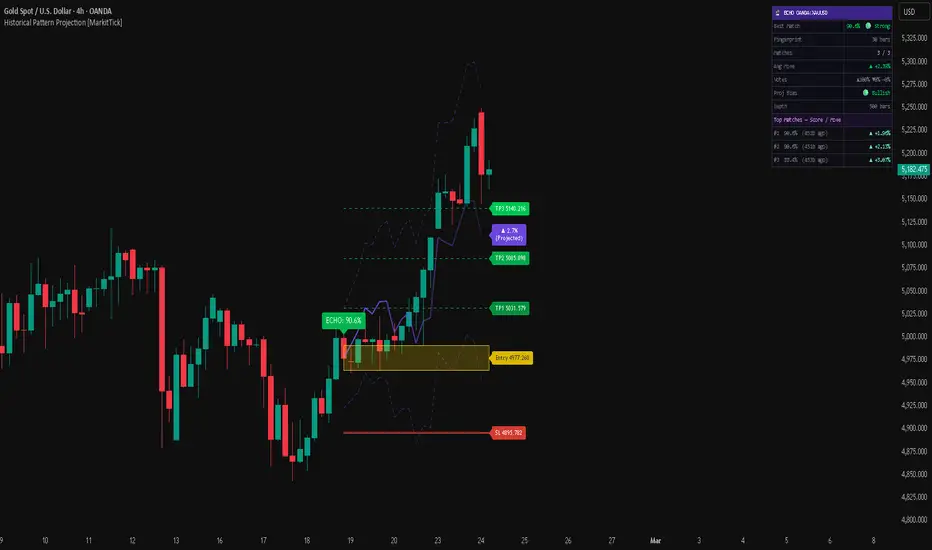
💡 An advanced analytical framework engineered to identify, isolate, and project current price action based on historically correlated market structures. Rather than relying on traditional lagging oscillators or subjective chart patterns, this tool continuously evaluates the most recent sequence of price movements—termed the "fingerprint"—and algorithmically scans historical data to find statistically similar precedents. By projecting the historical outcomes of these matching patterns onto the current chart, it provides an empirical, data-driven perspective on potential near-term price trajectories, seamlessly bridging the gap between quantitative correlation analysis and practical trade management.
✨ Originality and Utility
🔬 Methodology and Concepts

● Core Recognition Engine
● Outcome Synthesis and Extrapolation
🎨 Visual Guide

● On-Chart Projections and Highlights
● Trade Management Ecosystem
● The ECHO Dashboard Table
📖 How to Use

⚙️ Inputs and Settings

● Core Settings
● Projection & Risk Settings
🔍 Deconstruction of the Underlying Scientific and Academic Framework
⚠️ Disclaimer
All provided scripts and indicators are strictly for educational exploration and must not be interpreted as financial advice or a recommendation to execute trades. We expressly disclaim all liability for any financial losses or damages that may result, directly or indirectly, from the reliance on or application of these tools. Market participation carries inherent risk where past performance never guarantees future returns, leaving all investment decisions and due diligence solely at your own discretion.
✨ Originality and Utility
- Traditional technical analysis often relies on rigid, subjective patterns (such as head-and-shoulders or flags) which can be open to interpretation and cognitive bias.
- This script completely bypasses subjective pattern drawing by employing a strictly mathematical approach to shape-matching.
- It normalizes price action into a pure structural format, allowing it to compare the geometry of the current market with historical markets, regardless of the absolute price levels.
- The utility lies in its ability to automatically synthesize the "what happened next" data from historical matches.
- Instead of merely signaling overbought or oversold conditions, it provides a probabilistic projection path—a "ghost line"—complete with expected volatility bands and automated risk management levels based on the anticipated outcome.
🔬 Methodology and Concepts
● Core Recognition Engine
- • Data Normalization: The current price sequence (the fingerprint) is converted using a statistical Z-Score. This transformation removes the absolute price values and leaves behind the raw volatility-adjusted shape of the trend.
- • Deep Historical Scanning: The algorithm iterates backwards through user-defined historical bars (Search Depth) to extract rolling arrays of previous price action.
- • Statistical Correlation: Each historical array is compared to the current fingerprint using the Pearson Correlation Coefficient. The resulting value (-1.0 to +1.0) is mathematically scaled into a percentage (0% to 100%) to represent a "Similarity Score."
● Outcome Synthesis and Extrapolation
- • Match Aggregation: The script filters out matches that fall below the minimum Similarity Score threshold, keeping only the top configured matches.
- • Trajectory Calculation: For each valid match, the script records the price movement that occurred immediately after the historical pattern completed.
- • Price Scaling: The historical outcomes are structurally scaled and tethered to the current closing price, allowing the indicator to plot a composite average of these historical outcomes directly into the future empty space of the chart.
🎨 Visual Guide
● On-Chart Projections and Highlights
- • ECHO Match Zones: The historical periods that closely match the current price action are highlighted with thick, colored vertical bands (defaulting to deep orange). These zones allow for immediate visual verification of the structural similarity.
- • Ghost Line (Projection): Plotted into the future, this solid, fading purple line illustrates the average expected trajectory based on the historical matches. It features an arrow and percentage label at the terminus to indicate the total projected directional move.
- • Range Bands: Dashed, semi-transparent purple lines expanding outward from the Ghost Line. These bands represent the expected volatility expansion over the projection period, calculated using a dynamically scaling Average True Range (ATR).
● Trade Management Ecosystem
- • Entry Box: A highlighted zone (default yellow) projecting forward from the current bar, representing an optimal entry width based on a fraction of the current ATR.
- • Stop Loss (SL) Line: A solid red horizontal line indicating the suggested invalidation level, dynamically placed away from the entry using an ATR multiplier.
- • Take Profit (TP) Lines: Three dashed green horizontal lines representing tiered profit targets (TP1, TP2, and TP3), scaled mathematically via ATR multipliers in the direction of the historical bias.
● The ECHO Dashboard Table
- • Top Match Score: Displays the similarity percentage of the most highly correlated historical pattern. Color-coded for rapid assessment (Green for Strong >80%, Yellow for Moderate, Orange for Weak).
- • Fingerprint & Depth: Confirms the lookback length and the total bars scanned.
- • Outcome Metrics: Displays the historical "Votes" (percentage of matches that went Bullish, Bearish, or Neutral) and the overall Average Move.
- • Historical Roster: The bottom half of the dashboard ranks the individual top historical matches, detailing their exact score, how many bars ago they occurred, and their specific post-pattern return.
📖 How to Use
- • Pattern Validation: Monitor the ECHO Dashboard for patterns that achieve a Similarity Score of 80% or higher. Lower correlation scores should be treated with high skepticism as the historical geometries are not closely aligned.
- • Bias Confirmation: Check the "Proj Bias" and "Votes" metrics on the dashboard. A strong projection should ideally have unanimous or near-unanimous historical consensus (e.g., 100% Bullish votes).
- • Trade Execution: If a high-probability setup is identified, utilize the projected Trade Management levels. The highlighted Entry Box provides a buffer for execution, while the SL and TP lines offer an objective, volatility-adjusted framework for placing orders.
- • Alert Integration: The indicator can be tied to dynamic webhooks. Set an alert on the indicator, and when a "Strong" match is found, it will automatically transmit a JSON payload containing the Entry, Stop Loss, and Take Profit levels for automated systems or notifications.
⚙️ Inputs and Settings
● Core Settings
- • Freeze Data: A toggle that stops the algorithm from updating on every tick, locking the current projection in place for stable analysis.
- • Fingerprint Length: The number of current bars used to form the recognizable pattern. Shorter lengths are highly responsive but prone to noise; longer lengths find deep structural macro-patterns.
- • Search Depth: The maximum number of historical bars the algorithm will scan. Increasing this expands the database but requires more computational resources.
- • Min Score (%): The correlation threshold required for a historical pattern to be considered valid.
● Projection & Risk Settings
- • Ghost Length: Defines how many bars into the future the algorithm should project the historical outcome.
- • Entry Width (xATR): Defines the vertical height of the entry box based on current volatility.
- • SL & TP Multipliers: Adjustable factors that determine the distance of Stop Loss and Take Profit levels based on the current 14-period ATR.
🔍 Deconstruction of the Underlying Scientific and Academic Framework
- • Z-Score Standardization: The algorithm employs standard score normalization to analyze price action. By subtracting the moving average (mean) from the price and dividing by the standard deviation, the data is transformed into a dimensionless unit. This ensures that a pattern occurring in a low-volatility environment can be mathematically matched to the exact same geometric structure occurring in a high-volatility environment.
- • Pearson Correlation Coefficient: The core matching engine relies on Pearson's *r*, a measure of linear correlation between two sets of data. The formula computes the covariance of the current fingerprint and the historical candidate window, divided by the product of their standard deviations. This rigorously quantifies how closely the two price paths mirror each other over the specified timeframe.
- • Volatility-Adjusted Target Extrapolation: Rather than using fixed percentages or subjective support/resistance, the script utilizes the Average True Range (ATR) to govern its forward-looking risk management bands. Because market regimes shift, the ATR ensures that the projected bands and trade levels expand during turbulent market phases and contract during periods of consolidation, maintaining mathematical proportionality to current market conditions.
- • Algorithmic Caveats: Because the script continuously scans and matches the most recent data, the projected path will shift dynamically as new bars form, unless the "Freeze" function is engaged. Furthermore, the indicator evaluates the close of bars; running this framework on non-standard synthetic charts (such as Heikin Ashi or Renko) is fundamentally flawed due to the artificial smoothing of synthetic price data, which alters the underlying statistical distribution.
⚠️ Disclaimer
All provided scripts and indicators are strictly for educational exploration and must not be interpreted as financial advice or a recommendation to execute trades. We expressly disclaim all liability for any financial losses or damages that may result, directly or indirectly, from the reliance on or application of these tools. Market participation carries inherent risk where past performance never guarantees future returns, leaving all investment decisions and due diligence solely at your own discretion.
Skrip sumber terbuka
Dalam semangat TradingView sebenar, pencipta skrip ini telah menjadikannya sumber terbuka, jadi pedagang boleh menilai dan mengesahkan kefungsiannya. Terima kasih kepada penulis! Walaupuan anda boleh menggunakan secara percuma, ingat bahawa penerbitan semula kod ini tertakluk kepada Peraturan Dalaman.

💡 Proprietary indicators. Original research. Built by analysts who trade.
📢 Free Telegram: t.me/MarkitTick_Updates
👑 Premium: markittick.com
📢 Free Telegram: t.me/MarkitTick_Updates
👑 Premium: markittick.com
Penafian
Maklumat dan penerbitan adalah tidak bertujuan, dan tidak membentuk, nasihat atau cadangan kewangan, pelaburan, dagangan atau jenis lain yang diberikan atau disahkan oleh TradingView. Baca lebih dalam Terma Penggunaan.
Skrip sumber terbuka
Dalam semangat TradingView sebenar, pencipta skrip ini telah menjadikannya sumber terbuka, jadi pedagang boleh menilai dan mengesahkan kefungsiannya. Terima kasih kepada penulis! Walaupuan anda boleh menggunakan secara percuma, ingat bahawa penerbitan semula kod ini tertakluk kepada Peraturan Dalaman.
💡 Proprietary indicators. Original research. Built by analysts who trade.
📢 Free Telegram: t.me/MarkitTick_Updates
👑 Premium: markittick.com
📢 Free Telegram: t.me/MarkitTick_Updates
👑 Premium: markittick.com
Penafian
Maklumat dan penerbitan adalah tidak bertujuan, dan tidak membentuk, nasihat atau cadangan kewangan, pelaburan, dagangan atau jenis lain yang diberikan atau disahkan oleh TradingView. Baca lebih dalam Terma Penggunaan.