Telah dikemas kini
Supply Demand Volume Zones
Supply Demand Volume Zones
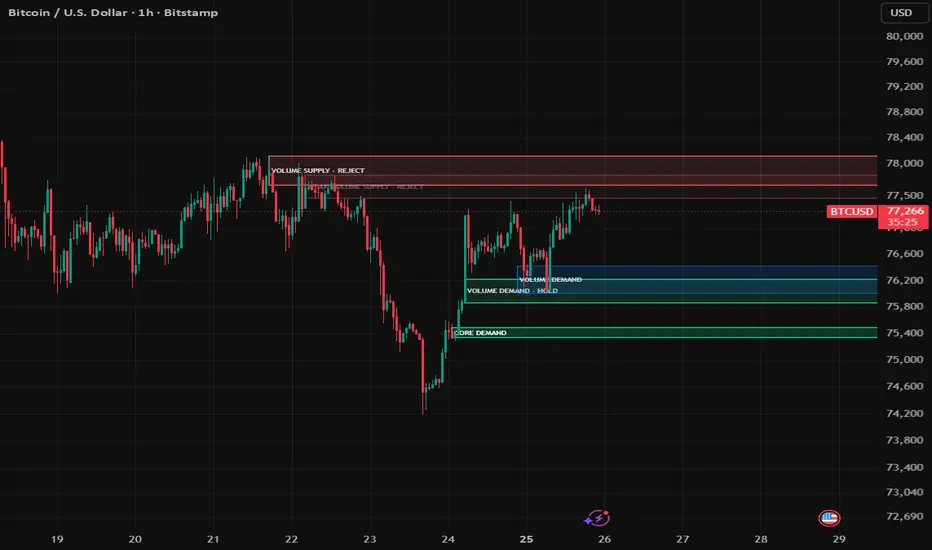
Supply Demand Volume Zones is a chart study designed to identify potential supply and demand areas using pivot-based price structure, zone width normalization, volume context, reaction strength, and proximity-based ranking.
The script builds supply zones near confirmed pivot highs and demand zones near confirmed pivot lows. Each zone can be scored using the average volume inside the base area and the size of the reaction that followed the pivot.
It does not provide buy or sell recommendations. The purpose of this script is to help users study possible support and resistance areas created by prior price reactions and volume activity.
────────────────────
Core Concept
────────────────────
Supply and demand analysis is often used to study where price previously reacted from a defined area.
A supply zone generally represents a prior area where selling pressure or resistance appeared.
A demand zone generally represents a prior area where buying pressure or support appeared.
This script focuses on four main zone concepts:
• Pivot-based reaction areas
• Base-zone range construction
• Volume and reaction-strength scoring
• Distance-based zone ranking
When price approaches a prior supply zone, users may observe whether resistance or rejection appears.
When price approaches a prior demand zone, users may observe whether support or reaction appears.
When a zone is broken completely, the script can remove it to keep the chart focused on active areas.
────────────────────
What This Script Shows
────────────────────
The script can display:
• Supply zones
• Demand zones
• Zone labels
• Strength labels
• Score labels
• Distance-adjusted zone ranking
• Optional session background
• Active zone touch alerts
• Active zone break alerts
These elements are intended to make supply and demand areas easier to review on the chart.
────────────────────
How It Works
────────────────────
1. The script detects pivot highs and pivot lows using configurable left and right pivot bars.
2. When a pivot high is confirmed, it builds a potential supply zone from the selected base area.
3. When a pivot low is confirmed, it builds a potential demand zone from the selected base area.
4. The zone range can be built from wick range, body range, or a hybrid method.
5. The script normalizes zone height using ATR-based minimum and maximum height limits.
6. It calculates average volume across the base zone.
7. It compares base volume against a volume moving average to estimate volume expansion.
8. It measures the reaction move after the pivot in ATR units.
9. It combines volume context and reaction strength into a zone score.
10. It can filter zones with weak volume if the volume filter is enabled.
11. It prevents same-side duplicate zones using an ATR-based merge tolerance.
12. It can hide conflicting supply and demand overlap areas.
13. It ranks active zones by score and proximity to current price.
14. It fades distant zones and can delete zones after a complete break.
15. It updates active boxes and labels as the chart progresses.
────────────────────
Visual Elements
────────────────────
The script includes:
• Orange supply / resistance zones
• Blue demand / support zones
• Zone strength labels
• Optional score display
• Optional session background
• Transparent box styling for older or distant zones
Zone labels can show a simple meaning label, a score label, or both.
Examples:
• SUP 1 STRONG
• SUP 2 MID
• DEM 1 STRONG
• DEM 2 BASE
The rank number reflects the relative priority of the active zone after considering strength and distance from current price.
────────────────────
Inputs And Customization
────────────────────
Users can adjust:
• Pivot left bars
• Pivot right bars
• Base zone bars
• ATR length
• Supply-only, demand-only, or both-side display
• Zone height calculation mode
• Minimum and maximum ATR-based zone height
• Right-side box extension
• Volume filter
• Volume moving average length
• Minimum volume multiplier
• Volume score weight
• Reaction score weight
• Strong and mid score thresholds
• Maximum number of supply zones
• Maximum number of demand zones
• Label display mode
• Broken-zone deletion
• Same-side merge tolerance
• Opposite-side conflict filter
• Far-zone fading
• Zone colors and transparency
• Optional session background
The default settings are designed to keep the chart readable while preserving the nearest and higher-ranked supply / demand zones.
────────────────────
Reference Markers
────────────────────
The script includes optional zone labels and alert conditions.
Supply Zone:
Shows a potential resistance area built from a confirmed pivot high and its surrounding base range.
Demand Zone:
Shows a potential support area built from a confirmed pivot low and its surrounding base range.
Strength Label:
Shows whether the zone is classified as BASE, MID, or STRONG according to the calculated score.
Score Label:
Shows the raw strength score based on the selected volume and reaction-weighting settings.
Zone Touch Alert:
Triggers when price enters or touches an active supply or demand zone.
Zone Break Alert:
Triggers when price completely breaks through an active supply or demand zone.
These markers and alerts are not trading signals. They are visual reference points for studying support, resistance, reaction zones, and price-location context.
────────────────────
How To Use
────────────────────
Use this script as a supply and demand zone viewer.
General interpretation examples:
• A supply zone above current price may act as a resistance reference area.
• A demand zone below current price may act as a support reference area.
• A zone with a higher score means the base area had stronger internal volume and/or a larger reaction move.
• A nearby high-ranked zone may be more relevant for short-term chart review than a distant lower-ranked zone.
• A complete break through a zone may reduce the usefulness of that zone as an active reference area.
• Overlapping or conflicting zones can be filtered to keep the chart cleaner.
This script should be used with independent analysis, risk management, and a defined trading plan.
────────────────────
Confirmation And Repainting Notes
────────────────────
Supply and demand zones are based on pivot logic.
A pivot requires the selected number of right-side bars to confirm, so a new zone appears only after the pivot has been confirmed.
The script does not use future price data beyond the required pivot confirmation window.
Because active candles can change before close, users who want confirmed conditions should evaluate zone touches and zone breaks after bar close.
Zone boxes are extended forward and updated as new bars appear. If broken-zone deletion is enabled, zones can disappear after price completely breaks through them.
────────────────────
Limitations
────────────────────
This script does not predict future price movement.
It does not provide buy or sell recommendations.
Supply and demand zones are approximate visual reference areas, not exact price guarantees.
Pivot-based zones can appear after the initial reaction has already started because pivot confirmation requires additional bars.
In sideways or low-liquidity markets, many zones may form close to each other and may require additional filtering.
A high score does not guarantee that price will react from a zone.
The script should not be used as a standalone trading system.
────────────────────
Disclaimer
────────────────────
This publication is for educational and informational chart analysis only.
It does not constitute financial advice, investment advice, or a recommendation to buy or sell any financial instrument.
All trading and investment decisions are the responsibility of the user.
━━━━━━━━━━━━━━━━━━━━
Supply Demand Volume Zones
Supply Demand Volume Zones는 피벗 기반 가격 구조, 구간 폭 정규화, 거래량 컨텍스트, 반응 강도, 가격 근접도 기반 랭킹을 사용해 잠재적인 Supply / Demand 구간을 표시하는 차트 분석 보조지표입니다.
이 스크립트는 확정된 피벗 고점 부근에는 Supply 구간을, 확정된 피벗 저점 부근에는 Demand 구간을 생성합니다. 각 구간은 base 영역의 평균 거래량과 피벗 이후 발생한 반응 크기를 바탕으로 점수화할 수 있습니다.
이 지표는 매수 또는 매도 추천을 제공하지 않습니다.
목적은 과거 가격 반응과 거래량 활동으로 형성된 잠재적 지지 / 저항 영역을 관찰하는 것입니다.
────────────────────
핵심 개념
────────────────────
Supply / Demand 분석은 가격이 과거에 특정 구간에서 어떻게 반응했는지 관찰하는 데 자주 사용됩니다.
Supply 구간은 일반적으로 과거에 매도 압력 또는 저항이 나타난 영역을 의미합니다.
Demand 구간은 일반적으로 과거에 매수 압력 또는 지지가 나타난 영역을 의미합니다.
이 스크립트는 네 가지 구간 개념에 초점을 둡니다.
• 피벗 기반 반응 구간
• Base zone 범위 구성
• 거래량 및 반응 강도 점수
• 가격 거리 기반 구간 랭킹
가격이 이전 Supply 구간에 접근할 때 사용자는 저항이나 반락 반응이 나타나는지 관찰할 수 있습니다.
가격이 이전 Demand 구간에 접근할 때 사용자는 지지나 반등 반응이 나타나는지 관찰할 수 있습니다.
구간이 완전히 돌파되면, 설정에 따라 해당 구간을 삭제하여 차트에 활성 구간만 남길 수 있습니다.
────────────────────
표시 요소
────────────────────
이 스크립트는 다음 요소를 표시할 수 있습니다.
• Supply 구간
• Demand 구간
• 구간 라벨
• 강도 라벨
• 점수 라벨
• 거리 반영 구간 랭킹
• 선택 가능한 세션 배경
• 활성 구간 터치 알림
• 활성 구간 돌파 알림
이 요소들은 차트 위에서 Supply / Demand 영역을 더 쉽게 복기하기 위한 시각적 참고 자료입니다.
────────────────────
작동 방식
────────────────────
1. 설정 가능한 left / right pivot bars를 사용해 피벗 고점과 피벗 저점을 감지합니다.
2. 피벗 고점이 확정되면 선택한 base 영역을 기준으로 잠재 Supply 구간을 생성합니다.
3. 피벗 저점이 확정되면 선택한 base 영역을 기준으로 잠재 Demand 구간을 생성합니다.
4. 구간 범위는 wick range, body range, hybrid 방식 중 하나로 구성할 수 있습니다.
5. ATR 기반 최소 / 최대 구간 높이를 적용해 zone height를 정규화합니다.
6. Base zone 안의 평균 거래량을 계산합니다.
7. Base volume을 거래량 이동평균과 비교해 거래량 확장 정도를 추정합니다.
8. 피벗 이후 발생한 반응 움직임을 ATR 단위로 측정합니다.
9. 거래량 컨텍스트와 반응 강도를 조합해 구간 점수를 계산합니다.
10. Volume Filter를 활성화하면 약한 거래량 구간을 필터링할 수 있습니다.
11. ATR 기반 merge tolerance를 사용해 같은 방향의 중복 구간을 줄입니다.
12. Supply와 Demand가 충돌하는 중첩 구간을 숨길 수 있습니다.
13. 활성 구간을 점수와 현재 가격과의 거리 기준으로 랭킹화합니다.
14. 먼 구간은 더 흐리게 표시하고, 완전히 돌파된 구간은 삭제할 수 있습니다.
15. 차트가 진행됨에 따라 활성 박스와 라벨을 계속 업데이트합니다.
────────────────────
시각 요소
────────────────────
이 스크립트는 다음 시각 요소를 포함합니다.
• 주황색 Supply / Resistance 구간
• 파란색 Demand / Support 구간
• 구간 강도 라벨
• 선택 가능한 점수 표시
• 선택 가능한 세션 배경
• 오래되었거나 먼 구간을 위한 투명 박스 스타일
구간 라벨은 단순 의미, 점수, 또는 둘 다 표시할 수 있습니다.
예시:
• SUP 1 STRONG
• SUP 2 MID
• DEM 1 STRONG
• DEM 2 BASE
랭킹 숫자는 현재 가격과의 거리 및 구간 강도를 반영한 활성 구간의 상대적 우선순위를 의미합니다.
────────────────────
입력값 및 설정
────────────────────
사용자는 다음 항목을 조정할 수 있습니다.
• Pivot Left Bars
• Pivot Right Bars
• Base Zone Bars
• ATR Length
• Supply only, Demand only, 양방향 표시
• Zone Height 계산 방식
• ATR 기반 최소 / 최대 구간 높이
• 우측 박스 연장 길이
• Volume Filter
• Volume MA Length
• Minimum Volume Multiplier
• Volume Score Weight
• Reaction Score Weight
• Strong / Mid Score 기준
• 최대 Supply 구간 수
• 최대 Demand 구간 수
• 라벨 표시 방식
• 돌파된 구간 삭제
• 같은 방향 구간 병합 허용 범위
• 반대 방향 중첩 구간 필터
• 먼 구간 흐림 처리
• 구간 색상 및 투명도
• 선택 가능한 세션 배경
기본 설정은 차트 가독성을 유지하면서 현재 가격과 가까운 주요 Supply / Demand 구간을 남기도록 구성되어 있습니다.
────────────────────
참고 마커
────────────────────
이 스크립트에는 선택 가능한 구간 라벨과 알림 조건이 포함되어 있습니다.
Supply Zone:
확정된 피벗 고점과 주변 base range를 기준으로 만들어진 잠재 저항 구간을 표시합니다.
Demand Zone:
확정된 피벗 저점과 주변 base range를 기준으로 만들어진 잠재 지지 구간을 표시합니다.
Strength Label:
계산된 점수에 따라 BASE, MID, STRONG 중 하나로 구간 강도를 표시합니다.
Score Label:
선택한 거래량 및 반응 강도 가중치 설정을 기준으로 계산된 원시 강도 점수를 표시합니다.
Zone Touch Alert:
가격이 활성 Supply 또는 Demand 구간에 진입하거나 터치할 때 발생합니다.
Zone Break Alert:
가격이 활성 Supply 또는 Demand 구간을 완전히 돌파할 때 발생합니다.
이 마커와 알림은 매매 신호가 아닙니다.
지지, 저항, 반응 구간, 가격 위치 컨텍스트를 관찰하기 위한 시각적 참고 지점입니다.
────────────────────
사용 방법
────────────────────
이 스크립트는 Supply / Demand 구간 확인용 보조지표로 사용할 수 있습니다.
일반적인 해석 예시는 다음과 같습니다.
• 현재 가격 위의 Supply 구간은 저항 참고 영역으로 볼 수 있습니다.
• 현재 가격 아래의 Demand 구간은 지지 참고 영역으로 볼 수 있습니다.
• 점수가 높은 구간은 base 영역의 거래량이 상대적으로 강했거나 이후 반응 움직임이 컸다는 의미입니다.
• 현재 가격과 가까운 높은 순위의 구간은 멀리 있는 낮은 순위 구간보다 단기 차트 복기에 더 유용할 수 있습니다.
• 구간이 완전히 돌파되면 해당 구간의 활성 참고 가치가 낮아졌다고 볼 수 있습니다.
• 중복되거나 충돌하는 구간은 필터링하여 차트를 더 깔끔하게 유지할 수 있습니다.
이 스크립트는 독립적인 분석, 리스크 관리, 본인의 매매 계획과 함께 참고해야 합니다.
────────────────────
확인봉 및 리페인트 안내
────────────────────
Supply / Demand 구간은 피벗 기반 로직으로 계산됩니다.
피벗은 선택한 우측 확인 캔들이 필요하므로, 새로운 구간은 피벗이 확정된 뒤에 표시됩니다.
이 스크립트는 필요한 피벗 확인 구간 외에 미래 가격 데이터를 사용하지 않습니다.
현재 진행 중인 캔들은 마감 전까지 값이 변할 수 있으므로, 확정 조건을 원하는 사용자는 구간 터치와 구간 돌파를 봉 마감 이후 기준으로 확인해야 합니다.
구간 박스는 우측으로 연장되며 새 캔들이 형성될 때마다 업데이트됩니다. Broken-zone deletion이 활성화되어 있으면 가격이 구간을 완전히 돌파한 뒤 해당 구간이 사라질 수 있습니다.
────────────────────
한계
────────────────────
이 스크립트는 미래 가격 움직임을 예측하지 않습니다.
매수 또는 매도 추천을 제공하지 않습니다.
Supply / Demand 구간은 정확한 가격 보장이 아니라 대략적인 시각 참고 영역입니다.
피벗 기반 구간은 우측 확인 캔들이 필요하므로, 초기 반응이 이미 발생한 뒤 구간이 표시될 수 있습니다.
횡보장 또는 저유동성 시장에서는 많은 구간이 가까운 위치에 형성될 수 있으며 추가 필터링이 필요할 수 있습니다.
높은 점수는 해당 구간에서 반드시 가격이 반응한다는 의미가 아닙니다.
이 스크립트를 단독 매매 시스템으로 사용해서는 안 됩니다.
────────────────────
중요 고지
────────────────────
본 게시물은 교육 및 정보 제공 목적의 차트 분석 자료입니다.
투자 자문, 매수·매도 추천, 특정 금융상품 거래 권유를 의미하지 않습니다.
모든 투자 판단과 그 결과에 대한 책임은 이용자 본인에게 있습니다.
Supply Demand Volume Zones is a chart study designed to identify potential supply and demand areas using pivot-based price structure, zone width normalization, volume context, reaction strength, and proximity-based ranking.
The script builds supply zones near confirmed pivot highs and demand zones near confirmed pivot lows. Each zone can be scored using the average volume inside the base area and the size of the reaction that followed the pivot.
It does not provide buy or sell recommendations. The purpose of this script is to help users study possible support and resistance areas created by prior price reactions and volume activity.
────────────────────
Core Concept
────────────────────
Supply and demand analysis is often used to study where price previously reacted from a defined area.
A supply zone generally represents a prior area where selling pressure or resistance appeared.
A demand zone generally represents a prior area where buying pressure or support appeared.
This script focuses on four main zone concepts:
• Pivot-based reaction areas
• Base-zone range construction
• Volume and reaction-strength scoring
• Distance-based zone ranking
When price approaches a prior supply zone, users may observe whether resistance or rejection appears.
When price approaches a prior demand zone, users may observe whether support or reaction appears.
When a zone is broken completely, the script can remove it to keep the chart focused on active areas.
────────────────────
What This Script Shows
────────────────────
The script can display:
• Supply zones
• Demand zones
• Zone labels
• Strength labels
• Score labels
• Distance-adjusted zone ranking
• Optional session background
• Active zone touch alerts
• Active zone break alerts
These elements are intended to make supply and demand areas easier to review on the chart.
────────────────────
How It Works
────────────────────
1. The script detects pivot highs and pivot lows using configurable left and right pivot bars.
2. When a pivot high is confirmed, it builds a potential supply zone from the selected base area.
3. When a pivot low is confirmed, it builds a potential demand zone from the selected base area.
4. The zone range can be built from wick range, body range, or a hybrid method.
5. The script normalizes zone height using ATR-based minimum and maximum height limits.
6. It calculates average volume across the base zone.
7. It compares base volume against a volume moving average to estimate volume expansion.
8. It measures the reaction move after the pivot in ATR units.
9. It combines volume context and reaction strength into a zone score.
10. It can filter zones with weak volume if the volume filter is enabled.
11. It prevents same-side duplicate zones using an ATR-based merge tolerance.
12. It can hide conflicting supply and demand overlap areas.
13. It ranks active zones by score and proximity to current price.
14. It fades distant zones and can delete zones after a complete break.
15. It updates active boxes and labels as the chart progresses.
────────────────────
Visual Elements
────────────────────
The script includes:
• Orange supply / resistance zones
• Blue demand / support zones
• Zone strength labels
• Optional score display
• Optional session background
• Transparent box styling for older or distant zones
Zone labels can show a simple meaning label, a score label, or both.
Examples:
• SUP 1 STRONG
• SUP 2 MID
• DEM 1 STRONG
• DEM 2 BASE
The rank number reflects the relative priority of the active zone after considering strength and distance from current price.
────────────────────
Inputs And Customization
────────────────────
Users can adjust:
• Pivot left bars
• Pivot right bars
• Base zone bars
• ATR length
• Supply-only, demand-only, or both-side display
• Zone height calculation mode
• Minimum and maximum ATR-based zone height
• Right-side box extension
• Volume filter
• Volume moving average length
• Minimum volume multiplier
• Volume score weight
• Reaction score weight
• Strong and mid score thresholds
• Maximum number of supply zones
• Maximum number of demand zones
• Label display mode
• Broken-zone deletion
• Same-side merge tolerance
• Opposite-side conflict filter
• Far-zone fading
• Zone colors and transparency
• Optional session background
The default settings are designed to keep the chart readable while preserving the nearest and higher-ranked supply / demand zones.
────────────────────
Reference Markers
────────────────────
The script includes optional zone labels and alert conditions.
Supply Zone:
Shows a potential resistance area built from a confirmed pivot high and its surrounding base range.
Demand Zone:
Shows a potential support area built from a confirmed pivot low and its surrounding base range.
Strength Label:
Shows whether the zone is classified as BASE, MID, or STRONG according to the calculated score.
Score Label:
Shows the raw strength score based on the selected volume and reaction-weighting settings.
Zone Touch Alert:
Triggers when price enters or touches an active supply or demand zone.
Zone Break Alert:
Triggers when price completely breaks through an active supply or demand zone.
These markers and alerts are not trading signals. They are visual reference points for studying support, resistance, reaction zones, and price-location context.
────────────────────
How To Use
────────────────────
Use this script as a supply and demand zone viewer.
General interpretation examples:
• A supply zone above current price may act as a resistance reference area.
• A demand zone below current price may act as a support reference area.
• A zone with a higher score means the base area had stronger internal volume and/or a larger reaction move.
• A nearby high-ranked zone may be more relevant for short-term chart review than a distant lower-ranked zone.
• A complete break through a zone may reduce the usefulness of that zone as an active reference area.
• Overlapping or conflicting zones can be filtered to keep the chart cleaner.
This script should be used with independent analysis, risk management, and a defined trading plan.
────────────────────
Confirmation And Repainting Notes
────────────────────
Supply and demand zones are based on pivot logic.
A pivot requires the selected number of right-side bars to confirm, so a new zone appears only after the pivot has been confirmed.
The script does not use future price data beyond the required pivot confirmation window.
Because active candles can change before close, users who want confirmed conditions should evaluate zone touches and zone breaks after bar close.
Zone boxes are extended forward and updated as new bars appear. If broken-zone deletion is enabled, zones can disappear after price completely breaks through them.
────────────────────
Limitations
────────────────────
This script does not predict future price movement.
It does not provide buy or sell recommendations.
Supply and demand zones are approximate visual reference areas, not exact price guarantees.
Pivot-based zones can appear after the initial reaction has already started because pivot confirmation requires additional bars.
In sideways or low-liquidity markets, many zones may form close to each other and may require additional filtering.
A high score does not guarantee that price will react from a zone.
The script should not be used as a standalone trading system.
────────────────────
Disclaimer
────────────────────
This publication is for educational and informational chart analysis only.
It does not constitute financial advice, investment advice, or a recommendation to buy or sell any financial instrument.
All trading and investment decisions are the responsibility of the user.
━━━━━━━━━━━━━━━━━━━━
Supply Demand Volume Zones
Supply Demand Volume Zones는 피벗 기반 가격 구조, 구간 폭 정규화, 거래량 컨텍스트, 반응 강도, 가격 근접도 기반 랭킹을 사용해 잠재적인 Supply / Demand 구간을 표시하는 차트 분석 보조지표입니다.
이 스크립트는 확정된 피벗 고점 부근에는 Supply 구간을, 확정된 피벗 저점 부근에는 Demand 구간을 생성합니다. 각 구간은 base 영역의 평균 거래량과 피벗 이후 발생한 반응 크기를 바탕으로 점수화할 수 있습니다.
이 지표는 매수 또는 매도 추천을 제공하지 않습니다.
목적은 과거 가격 반응과 거래량 활동으로 형성된 잠재적 지지 / 저항 영역을 관찰하는 것입니다.
────────────────────
핵심 개념
────────────────────
Supply / Demand 분석은 가격이 과거에 특정 구간에서 어떻게 반응했는지 관찰하는 데 자주 사용됩니다.
Supply 구간은 일반적으로 과거에 매도 압력 또는 저항이 나타난 영역을 의미합니다.
Demand 구간은 일반적으로 과거에 매수 압력 또는 지지가 나타난 영역을 의미합니다.
이 스크립트는 네 가지 구간 개념에 초점을 둡니다.
• 피벗 기반 반응 구간
• Base zone 범위 구성
• 거래량 및 반응 강도 점수
• 가격 거리 기반 구간 랭킹
가격이 이전 Supply 구간에 접근할 때 사용자는 저항이나 반락 반응이 나타나는지 관찰할 수 있습니다.
가격이 이전 Demand 구간에 접근할 때 사용자는 지지나 반등 반응이 나타나는지 관찰할 수 있습니다.
구간이 완전히 돌파되면, 설정에 따라 해당 구간을 삭제하여 차트에 활성 구간만 남길 수 있습니다.
────────────────────
표시 요소
────────────────────
이 스크립트는 다음 요소를 표시할 수 있습니다.
• Supply 구간
• Demand 구간
• 구간 라벨
• 강도 라벨
• 점수 라벨
• 거리 반영 구간 랭킹
• 선택 가능한 세션 배경
• 활성 구간 터치 알림
• 활성 구간 돌파 알림
이 요소들은 차트 위에서 Supply / Demand 영역을 더 쉽게 복기하기 위한 시각적 참고 자료입니다.
────────────────────
작동 방식
────────────────────
1. 설정 가능한 left / right pivot bars를 사용해 피벗 고점과 피벗 저점을 감지합니다.
2. 피벗 고점이 확정되면 선택한 base 영역을 기준으로 잠재 Supply 구간을 생성합니다.
3. 피벗 저점이 확정되면 선택한 base 영역을 기준으로 잠재 Demand 구간을 생성합니다.
4. 구간 범위는 wick range, body range, hybrid 방식 중 하나로 구성할 수 있습니다.
5. ATR 기반 최소 / 최대 구간 높이를 적용해 zone height를 정규화합니다.
6. Base zone 안의 평균 거래량을 계산합니다.
7. Base volume을 거래량 이동평균과 비교해 거래량 확장 정도를 추정합니다.
8. 피벗 이후 발생한 반응 움직임을 ATR 단위로 측정합니다.
9. 거래량 컨텍스트와 반응 강도를 조합해 구간 점수를 계산합니다.
10. Volume Filter를 활성화하면 약한 거래량 구간을 필터링할 수 있습니다.
11. ATR 기반 merge tolerance를 사용해 같은 방향의 중복 구간을 줄입니다.
12. Supply와 Demand가 충돌하는 중첩 구간을 숨길 수 있습니다.
13. 활성 구간을 점수와 현재 가격과의 거리 기준으로 랭킹화합니다.
14. 먼 구간은 더 흐리게 표시하고, 완전히 돌파된 구간은 삭제할 수 있습니다.
15. 차트가 진행됨에 따라 활성 박스와 라벨을 계속 업데이트합니다.
────────────────────
시각 요소
────────────────────
이 스크립트는 다음 시각 요소를 포함합니다.
• 주황색 Supply / Resistance 구간
• 파란색 Demand / Support 구간
• 구간 강도 라벨
• 선택 가능한 점수 표시
• 선택 가능한 세션 배경
• 오래되었거나 먼 구간을 위한 투명 박스 스타일
구간 라벨은 단순 의미, 점수, 또는 둘 다 표시할 수 있습니다.
예시:
• SUP 1 STRONG
• SUP 2 MID
• DEM 1 STRONG
• DEM 2 BASE
랭킹 숫자는 현재 가격과의 거리 및 구간 강도를 반영한 활성 구간의 상대적 우선순위를 의미합니다.
────────────────────
입력값 및 설정
────────────────────
사용자는 다음 항목을 조정할 수 있습니다.
• Pivot Left Bars
• Pivot Right Bars
• Base Zone Bars
• ATR Length
• Supply only, Demand only, 양방향 표시
• Zone Height 계산 방식
• ATR 기반 최소 / 최대 구간 높이
• 우측 박스 연장 길이
• Volume Filter
• Volume MA Length
• Minimum Volume Multiplier
• Volume Score Weight
• Reaction Score Weight
• Strong / Mid Score 기준
• 최대 Supply 구간 수
• 최대 Demand 구간 수
• 라벨 표시 방식
• 돌파된 구간 삭제
• 같은 방향 구간 병합 허용 범위
• 반대 방향 중첩 구간 필터
• 먼 구간 흐림 처리
• 구간 색상 및 투명도
• 선택 가능한 세션 배경
기본 설정은 차트 가독성을 유지하면서 현재 가격과 가까운 주요 Supply / Demand 구간을 남기도록 구성되어 있습니다.
────────────────────
참고 마커
────────────────────
이 스크립트에는 선택 가능한 구간 라벨과 알림 조건이 포함되어 있습니다.
Supply Zone:
확정된 피벗 고점과 주변 base range를 기준으로 만들어진 잠재 저항 구간을 표시합니다.
Demand Zone:
확정된 피벗 저점과 주변 base range를 기준으로 만들어진 잠재 지지 구간을 표시합니다.
Strength Label:
계산된 점수에 따라 BASE, MID, STRONG 중 하나로 구간 강도를 표시합니다.
Score Label:
선택한 거래량 및 반응 강도 가중치 설정을 기준으로 계산된 원시 강도 점수를 표시합니다.
Zone Touch Alert:
가격이 활성 Supply 또는 Demand 구간에 진입하거나 터치할 때 발생합니다.
Zone Break Alert:
가격이 활성 Supply 또는 Demand 구간을 완전히 돌파할 때 발생합니다.
이 마커와 알림은 매매 신호가 아닙니다.
지지, 저항, 반응 구간, 가격 위치 컨텍스트를 관찰하기 위한 시각적 참고 지점입니다.
────────────────────
사용 방법
────────────────────
이 스크립트는 Supply / Demand 구간 확인용 보조지표로 사용할 수 있습니다.
일반적인 해석 예시는 다음과 같습니다.
• 현재 가격 위의 Supply 구간은 저항 참고 영역으로 볼 수 있습니다.
• 현재 가격 아래의 Demand 구간은 지지 참고 영역으로 볼 수 있습니다.
• 점수가 높은 구간은 base 영역의 거래량이 상대적으로 강했거나 이후 반응 움직임이 컸다는 의미입니다.
• 현재 가격과 가까운 높은 순위의 구간은 멀리 있는 낮은 순위 구간보다 단기 차트 복기에 더 유용할 수 있습니다.
• 구간이 완전히 돌파되면 해당 구간의 활성 참고 가치가 낮아졌다고 볼 수 있습니다.
• 중복되거나 충돌하는 구간은 필터링하여 차트를 더 깔끔하게 유지할 수 있습니다.
이 스크립트는 독립적인 분석, 리스크 관리, 본인의 매매 계획과 함께 참고해야 합니다.
────────────────────
확인봉 및 리페인트 안내
────────────────────
Supply / Demand 구간은 피벗 기반 로직으로 계산됩니다.
피벗은 선택한 우측 확인 캔들이 필요하므로, 새로운 구간은 피벗이 확정된 뒤에 표시됩니다.
이 스크립트는 필요한 피벗 확인 구간 외에 미래 가격 데이터를 사용하지 않습니다.
현재 진행 중인 캔들은 마감 전까지 값이 변할 수 있으므로, 확정 조건을 원하는 사용자는 구간 터치와 구간 돌파를 봉 마감 이후 기준으로 확인해야 합니다.
구간 박스는 우측으로 연장되며 새 캔들이 형성될 때마다 업데이트됩니다. Broken-zone deletion이 활성화되어 있으면 가격이 구간을 완전히 돌파한 뒤 해당 구간이 사라질 수 있습니다.
────────────────────
한계
────────────────────
이 스크립트는 미래 가격 움직임을 예측하지 않습니다.
매수 또는 매도 추천을 제공하지 않습니다.
Supply / Demand 구간은 정확한 가격 보장이 아니라 대략적인 시각 참고 영역입니다.
피벗 기반 구간은 우측 확인 캔들이 필요하므로, 초기 반응이 이미 발생한 뒤 구간이 표시될 수 있습니다.
횡보장 또는 저유동성 시장에서는 많은 구간이 가까운 위치에 형성될 수 있으며 추가 필터링이 필요할 수 있습니다.
높은 점수는 해당 구간에서 반드시 가격이 반응한다는 의미가 아닙니다.
이 스크립트를 단독 매매 시스템으로 사용해서는 안 됩니다.
────────────────────
중요 고지
────────────────────
본 게시물은 교육 및 정보 제공 목적의 차트 분석 자료입니다.
투자 자문, 매수·매도 추천, 특정 금융상품 거래 권유를 의미하지 않습니다.
모든 투자 판단과 그 결과에 대한 책임은 이용자 본인에게 있습니다.
Nota Keluaran
Update NotesThis update improves the zone detection and visualization logic of the script.
Key changes:
• Added volume-weighted pivot fallback zones
The script can now identify additional supply and demand areas from pivot-based structures, using volume and reaction strength as part of the zone-quality logic.
• Improved supply / demand zone classification
Zones are now separated more clearly between regular supply / demand zones and volume-weighted supply / demand zones.
• Added reaction-state tracking
The script now provides clearer state behavior for zones, including mitigation, hold, rejection, breaker, and invalidated conditions.
• Improved zone priority and visibility
The display logic has been refined so that key zones near current price, recently created zones, core zones, and reaction zones remain easier to review.
• Improved zone scoring logic
The script now combines displacement-based quality scoring with volume/reaction-based scoring for pivot fallback zones.
• Cleaned up public-facing labels and alerts
Labels, alert messages, and chart text were adjusted to focus on the indicator’s analytical function rather than branding or promotional language.
How to read this update:
Regular supply / demand zones are mainly based on displacement and opposite-candle structure.
Volume supply / demand zones are based on pivot structure, volume participation, and reaction strength.
HOLD and REJECT states highlight zones where price has interacted with the area and produced a directional reaction.
BRK and INV states help users review when a zone has been weakened or structurally invalidated.
This script remains an educational chart-analysis tool. It does not provide buy or sell recommendations, financial advice, or guaranteed outcomes.
━━━━━━━━━━━━━━━━━━━━
업데이트 노트
이번 업데이트는 지표의 존 감지 방식과 시각화 로직을 개선한 버전입니다.
주요 변경 사항:
• 거래량 기반 피벗 보조 존 추가
이제 스크립트는 피벗 기반 구조에서 추가적인 공급 / 수요 구간을 감지할 수 있으며, 거래량과 반응 강도를 존 품질 평가에 함께 반영합니다.
• 공급 / 수요 존 분류 개선
일반 Supply / Demand Zone과 Volume-weighted Supply / Demand Zone이 더 명확하게 구분되도록 정리했습니다.
• 반응 상태 추적 개선
존이 형성된 이후 mitigation, hold, rejection, breaker, invalidated 상태를 더 명확하게 확인할 수 있도록 개선했습니다.
• 존 우선순위 및 표시 방식 개선
현재 가격 근처의 주요 존, 최근 생성된 존, 핵심 존, 반응이 확인된 존이 더 보기 쉽게 표시되도록 로직을 정리했습니다.
• 존 점수 계산 개선
Displacement 기반 품질 점수와 피벗 보조 존의 volume / reaction 기반 점수를 함께 사용할 수 있도록 구조를 확장했습니다.
• 공개용 라벨 및 알림 문구 정리
차트 라벨, 알림 메시지, 표시 문구를 브랜드나 홍보성 표현이 아닌 지표의 분석 기능 중심으로 정리했습니다.
이번 업데이트 해석 방법:
일반 공급 / 수요 존은 주로 강한 변위 움직임과 직전 반대 캔들 구조를 기반으로 합니다.
Volume Supply / Demand Zone은 피벗 구조, 거래량 참여도, 이후 가격 반응 강도를 기반으로 합니다.
HOLD와 REJECT 상태는 가격이 해당 존과 상호작용한 뒤 방향성 반응이 나타난 구간을 의미합니다.
BRK와 INV 상태는 해당 존이 약화되었거나 구조적으로 무효화된 상황을 복기하는 데 사용할 수 있습니다.
이 스크립트는 교육 및 차트 분석 목적의 도구입니다. 매수·매도 추천, 투자 자문, 수익 보장을 제공하지 않습니다.

Penafian
Maklumat dan penerbitan adalah tidak bertujuan, dan tidak membentuk, nasihat atau cadangan kewangan, pelaburan, dagangan atau jenis lain yang diberikan atau disahkan oleh TradingView. Baca lebih dalam Terma Penggunaan.
Penafian
Maklumat dan penerbitan adalah tidak bertujuan, dan tidak membentuk, nasihat atau cadangan kewangan, pelaburan, dagangan atau jenis lain yang diberikan atau disahkan oleh TradingView. Baca lebih dalam Terma Penggunaan.