Halo SOL-ETH 4H Scenario Map
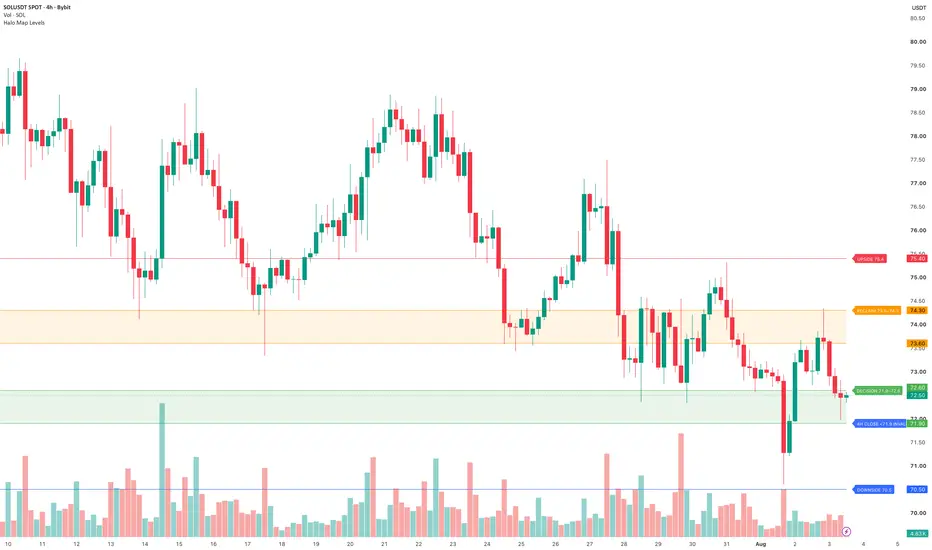
An open-source visual scenario map for the SOLUSDT and ETHUSDT 4-hour charts. It plots two transparent decision zones and the key upside, invalidation and downside levels used in the accompanying Halo market analysis.
SOL map: 71.9–72.6 decision zone, 73.6–74.3 reclaim zone, 75.4 upside and 70.5 downside after a 4H close below 71.9.
ETH map: 1,820–1,840 demand zone, 1,879–1,900 reclaim zone, 1,940 upside and 1,800 downside after a 4H close below 1,820.
The colors are intentionally simple: green for demand/decision, orange for reclaim, red for upside decision and blue for invalidation/downside. The script is a visual analysis aid only. It does not generate entries, execute trades or predict outcomes. Maps, not predictions.
SOL map: 71.9–72.6 decision zone, 73.6–74.3 reclaim zone, 75.4 upside and 70.5 downside after a 4H close below 71.9.
ETH map: 1,820–1,840 demand zone, 1,879–1,900 reclaim zone, 1,940 upside and 1,800 downside after a 4H close below 1,820.
The colors are intentionally simple: green for demand/decision, orange for reclaim, red for upside decision and blue for invalidation/downside. The script is a visual analysis aid only. It does not generate entries, execute trades or predict outcomes. Maps, not predictions.

Penafian
Maklumat dan penerbitan adalah tidak bertujuan, dan tidak membentuk, nasihat atau cadangan kewangan, pelaburan, dagangan atau jenis lain yang diberikan atau disahkan oleh TradingView. Baca lebih dalam Terma Penggunaan.
Penafian
Maklumat dan penerbitan adalah tidak bertujuan, dan tidak membentuk, nasihat atau cadangan kewangan, pelaburan, dagangan atau jenis lain yang diberikan atau disahkan oleh TradingView. Baca lebih dalam Terma Penggunaan.