Dow Theory Market Structure [Levels]
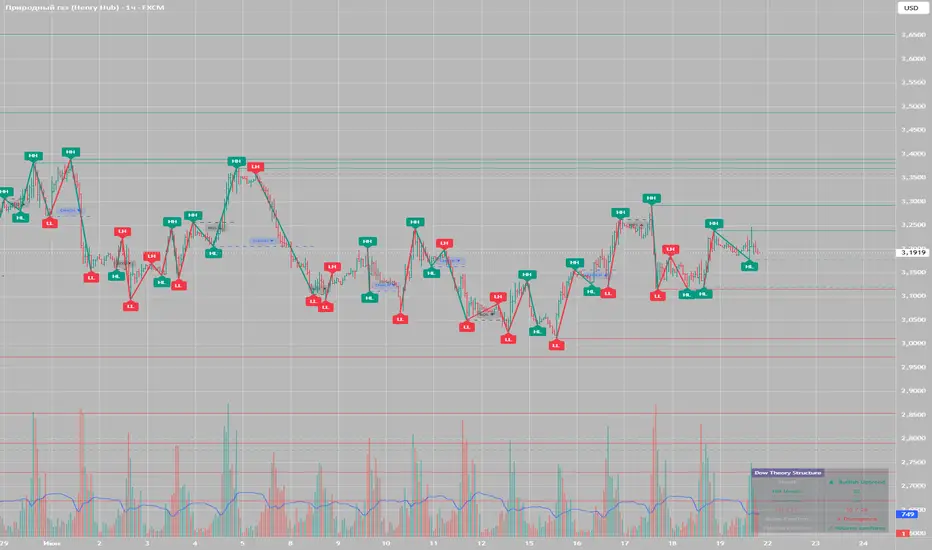
Theory and User Guide for "Dow Theory Market Structure [Levels]" Indicator
Theoretical Background
The indicator applies the core principles of Dow Theory in a modern context, suitable for any market (stocks, indices, crypto, forex). Developed by Charles Dow in the late 19th century, Dow Theory is the foundation of trend analysis. Its key tenets implemented in the indicator are:
1. Trend Defined by Successive Peaks and Troughs
Bullish Uptrend – each new high is higher than the previous one (Higher High, HH), and each new low is higher than the previous (Higher Low, HL).
Bearish Downtrend – each new high is lower (Lower High, LH), and each new low is lower (Lower Low, LL).
A violation of this structure signals a potential trend reversal.
2. Support and Resistance Levels
Previous significant highs and lows become future support (former highs after breakout) and resistance (former lows after breakout). The indicator automatically draws horizontal lines from each confirmed pivot and extends them until price closes beyond the level.
3. Volume Confirmation
Volume should expand in the direction of the primary trend and contract during corrections. The indicator uses directional volume:
In an uptrend, average volume on up‑bars (close > open) must exceed average volume on down‑bars.
In a downtrend, down‑bar volume must exceed up‑bar volume.
4. Inter‑Market Confirmation
Two key indices (e.g., Industrials and Transports) must confirm each other. The indicator allows selecting a confirming asset (an index or correlated instrument). The trend is considered confirmed when the confirming asset’s trend direction matches the main chart.
5. BOS (Break of Structure) and CHoCH (Change of Character)
Modern interpretation of Dow’s reversal signals:
BOS – continuation of the current trend when an extreme is renewed in its direction.
CHoCH – first reversal signal when price breaks the last opposing extreme (e.g., a new high after a series of lower highs). For strict Dow compliance, the indicator offers Strict Dow CHoCH: the signal appears only when both index and volume confirmations are satisfied (if active).
User Guide
Purpose
Visualize Dow market structure, auto‑plot key levels, determine the current trend, and generate continuation/reversal signals with optional strict confirmation.
Main Chart Elements
HH / HL / LH / LL Labels at each confirmed pivot.
Horizontal Levels – lines drawn from HH (resistance), HL (support), LH (resistance), LL (support). Levels are automatically deleted when price closes beyond them (or on a wick touch, depending on settings).
ZigZag Lines connecting consecutive highs and lows.
BOS ▲ / BOS ▼ Labels – trend continuation.
CHoCH ▲ / CHoCH ▼ Labels – potential reversal.
Info Panel (bottom‑right) – shows current trend, number of active levels, index and volume confirmation status.
Settings
Organized into functional groups:
⚙️ Main Parameters
Swing Length (bars) – number of bars left/right to confirm an extreme. Smaller values give micro‑structure; larger values capture the main trend.
📐 Levels (Horizontal Lines)
Customize visibility, color, line style, width, and break conditions (close vs. wick).
Limit the maximum number of displayed levels per type.
〰️ ZigZag
Color and thickness for up and down segments.
🏷️ HH/HL/LH/LL Labels
Size, color of labels and text.
🔔 BOS / CHoCH
Toggle BOS/CHoCH display, colors, label size.
📊 Confirmation (Dow Theory)
Use Confirming Asset – enable inter‑market confirmation.
Confirming Asset Symbol – ticker of the confirming instrument.
Confirming Swing Length – swing period for the confirming asset.
Confirming Asset Timeframe – timeframe (empty = current).
Volume Confirms Trend – enable directional volume check.
Volume Lookback Period – averaging period for volume.
Strict Dow CHoCH (require confirmations) – when on, a CHoCH appears only if the index trend matches and volume supports the new direction (when those confirmations are active).
Signal Interpretation
Trend Identification:
Check the info panel («Trend: ▲ Bullish Uptrend» or «▼ Bearish Downtrend»).
Visually: rising price makes HH and HL; falling price makes LH and LL.
Levels:
Use horizontal lines as potential support/resistance zones.
When a level is broken, it disappears – price “confirms” beyond it.
BOS:
BOS ▲ – price makes a new high in an uptrend, signaling strength.
BOS ▼ – new low in a downtrend, continuation of weakness.
CHoCH:
CHoCH ▲ – price exceeds the previous high after a series of lower highs (LH). Possible upward reversal.
CHoCH ▼ – price breaks the previous low after a series of higher lows (HL). Possible downward reversal.
When Strict Dow CHoCH is active, the signal will only appear if the index trend already aligns and volume supports the new direction.
Index Confirmation:
The panel shows «✓ Confirmed» – trends align; «✗ Divergence» – discrepancy (caution); «Waiting…» – not enough data.
Volume Confirmation:
«✓ Volume confirms» – directional volume agrees with the trend.
«✗ Volume weak» – volume does not support the move (potential weakness).
Usage Recommendations
Start with default settings. For long‑term analysis, increase Swing Length to 20–50.
For strict Dow Theory compliance, activate both confirmations and enable «Strict Dow CHoCH».
Choose a confirming asset correlated with the main chart (e.g., SPX for stocks, TOTAL for crypto).
Note: with strict filtering, CHoCH signals will be rare but more reliable.
Theoretical Background
The indicator applies the core principles of Dow Theory in a modern context, suitable for any market (stocks, indices, crypto, forex). Developed by Charles Dow in the late 19th century, Dow Theory is the foundation of trend analysis. Its key tenets implemented in the indicator are:
1. Trend Defined by Successive Peaks and Troughs
Bullish Uptrend – each new high is higher than the previous one (Higher High, HH), and each new low is higher than the previous (Higher Low, HL).
Bearish Downtrend – each new high is lower (Lower High, LH), and each new low is lower (Lower Low, LL).
A violation of this structure signals a potential trend reversal.
2. Support and Resistance Levels
Previous significant highs and lows become future support (former highs after breakout) and resistance (former lows after breakout). The indicator automatically draws horizontal lines from each confirmed pivot and extends them until price closes beyond the level.
3. Volume Confirmation
Volume should expand in the direction of the primary trend and contract during corrections. The indicator uses directional volume:
In an uptrend, average volume on up‑bars (close > open) must exceed average volume on down‑bars.
In a downtrend, down‑bar volume must exceed up‑bar volume.
4. Inter‑Market Confirmation
Two key indices (e.g., Industrials and Transports) must confirm each other. The indicator allows selecting a confirming asset (an index or correlated instrument). The trend is considered confirmed when the confirming asset’s trend direction matches the main chart.
5. BOS (Break of Structure) and CHoCH (Change of Character)
Modern interpretation of Dow’s reversal signals:
BOS – continuation of the current trend when an extreme is renewed in its direction.
CHoCH – first reversal signal when price breaks the last opposing extreme (e.g., a new high after a series of lower highs). For strict Dow compliance, the indicator offers Strict Dow CHoCH: the signal appears only when both index and volume confirmations are satisfied (if active).
User Guide
Purpose
Visualize Dow market structure, auto‑plot key levels, determine the current trend, and generate continuation/reversal signals with optional strict confirmation.
Main Chart Elements
HH / HL / LH / LL Labels at each confirmed pivot.
Horizontal Levels – lines drawn from HH (resistance), HL (support), LH (resistance), LL (support). Levels are automatically deleted when price closes beyond them (or on a wick touch, depending on settings).
ZigZag Lines connecting consecutive highs and lows.
BOS ▲ / BOS ▼ Labels – trend continuation.
CHoCH ▲ / CHoCH ▼ Labels – potential reversal.
Info Panel (bottom‑right) – shows current trend, number of active levels, index and volume confirmation status.
Settings
Organized into functional groups:
⚙️ Main Parameters
Swing Length (bars) – number of bars left/right to confirm an extreme. Smaller values give micro‑structure; larger values capture the main trend.
📐 Levels (Horizontal Lines)
Customize visibility, color, line style, width, and break conditions (close vs. wick).
Limit the maximum number of displayed levels per type.
〰️ ZigZag
Color and thickness for up and down segments.
🏷️ HH/HL/LH/LL Labels
Size, color of labels and text.
🔔 BOS / CHoCH
Toggle BOS/CHoCH display, colors, label size.
📊 Confirmation (Dow Theory)
Use Confirming Asset – enable inter‑market confirmation.
Confirming Asset Symbol – ticker of the confirming instrument.
Confirming Swing Length – swing period for the confirming asset.
Confirming Asset Timeframe – timeframe (empty = current).
Volume Confirms Trend – enable directional volume check.
Volume Lookback Period – averaging period for volume.
Strict Dow CHoCH (require confirmations) – when on, a CHoCH appears only if the index trend matches and volume supports the new direction (when those confirmations are active).
Signal Interpretation
Trend Identification:
Check the info panel («Trend: ▲ Bullish Uptrend» or «▼ Bearish Downtrend»).
Visually: rising price makes HH and HL; falling price makes LH and LL.
Levels:
Use horizontal lines as potential support/resistance zones.
When a level is broken, it disappears – price “confirms” beyond it.
BOS:
BOS ▲ – price makes a new high in an uptrend, signaling strength.
BOS ▼ – new low in a downtrend, continuation of weakness.
CHoCH:
CHoCH ▲ – price exceeds the previous high after a series of lower highs (LH). Possible upward reversal.
CHoCH ▼ – price breaks the previous low after a series of higher lows (HL). Possible downward reversal.
When Strict Dow CHoCH is active, the signal will only appear if the index trend already aligns and volume supports the new direction.
Index Confirmation:
The panel shows «✓ Confirmed» – trends align; «✗ Divergence» – discrepancy (caution); «Waiting…» – not enough data.
Volume Confirmation:
«✓ Volume confirms» – directional volume agrees with the trend.
«✗ Volume weak» – volume does not support the move (potential weakness).
Usage Recommendations
Start with default settings. For long‑term analysis, increase Swing Length to 20–50.
For strict Dow Theory compliance, activate both confirmations and enable «Strict Dow CHoCH».
Choose a confirming asset correlated with the main chart (e.g., SPX for stocks, TOTAL for crypto).
Note: with strict filtering, CHoCH signals will be rare but more reliable.

Penafian
Maklumat dan penerbitan adalah tidak bertujuan, dan tidak membentuk, nasihat atau cadangan kewangan, pelaburan, dagangan atau jenis lain yang diberikan atau disahkan oleh TradingView. Baca lebih dalam Terma Penggunaan.
Penafian
Maklumat dan penerbitan adalah tidak bertujuan, dan tidak membentuk, nasihat atau cadangan kewangan, pelaburan, dagangan atau jenis lain yang diberikan atau disahkan oleh TradingView. Baca lebih dalam Terma Penggunaan.