Telah dikemas kini
ATR Dynamic ZigZag with Real-Time Confirmation Stats
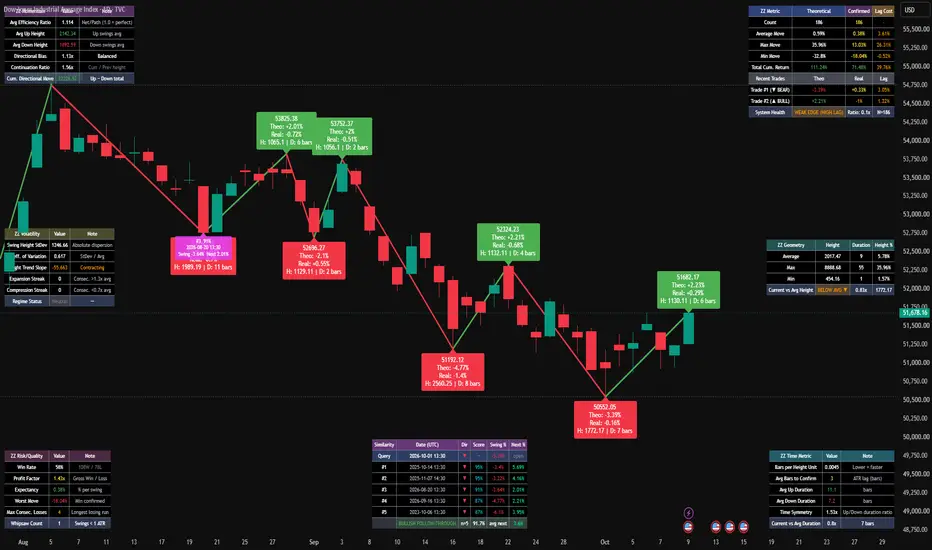
This Pine Script indicator, "ATR Dynamic ZigZag with Real-Time Confirmation Stats", is a sophisticated tool that combines a volatility‑adjusted ZigZag with a statistical dashboard. Below is a clear breakdown of its purpose, mechanics, and how to interpret the data it provides.
🎯 What It Does
Dynamic ZigZag: Plots swing highs/lows only when price moves by a user‑defined multiple of Average True Range (ATR) – this filters out minor noise and adapts to current volatility.
Real‑Time Confirmation Stats: Tracks every confirmed swing and displays a live table with:
Theoretical vs. actual (confirmed) move percentages.
ATR lag cost (how much of the move was missed due to the confirmation rule).
System health diagnostics to help you tune the ATR multiplier.
Visual Overlays: Optionally shows Bollinger Bands, an EMA, and price/percentage labels on each ZigZag pivot.
⚙️ How It Works (Core Logic)
ATR Threshold
Calculates threshold = ATR(14) × Multiplier (default 2.0).
A new swing is confirmed only when price moves away from the current extreme by at least this amount.
Direction Tracking
Bullish mode (dir = 1): Tracks new highs. If price drops below extreme_high - threshold, the swing ends, and a new bearish swing begins.
Bearish mode (dir = -1): Tracks new lows. If price rises above extreme_low + threshold, the swing ends, and a new bullish swing begins.
Data Capture on Confirmation
When a swing completes, the script records:
Theoretical Move: % change between the two extreme pivot prices.
Confirmed (Real) Move: % change from the confirmation bar’s close to the new pivot (simulating an entry at the moment the reversal is confirmed).
Lag Cost: The difference between the two (i.e., missed profit due to waiting for ATR confirmation).
📊 Dashboard (Table) Interpretation
The table (top‑right) updates on the last bar and shows:
Row Metric What It Tells You
Count Number of completed swings Sample size for the stats.
Average / Max / Min Move Theoretical vs. Confirmed
If confirmed averages are much lower than theoretical, the ATR multiplier may be too large (lag) or too small (whipsaw).
Total Cum. Return Sum of all theoretical & confirmed % moves
A quick view of overall performance.
Positive = net upward swings, negative = net downward swings.
Recent Trades
Last 2 swings with direction (▲ BULL / ▼ BEAR)
Shows the most recent trade performance in detail.
ATR System Health Diagnostic status
Green = healthy edge (confirmed profits > lag).
Orange/Red = weak or unprofitable – adjust the ATR Multiplier.
🧠 How to Use & Optimize
Tuning the ATR Multiplier:
Too low → many small swings (whipsaw) – diagnostic will show “UNPROFITABLE EDGE”.
Too high → late entries (high lag) – diagnostic will show “WEAK EDGE”.
Aim for a value where “HEALTHY EDGE” appears and confirmed profits remain strong.
Visual Confirmation:
ZigZag lines change colour (green/red) based on direction.
Labels show the pivot price, theoretical %, and confirmed %. This helps you see if the system would have captured a move in real time.
Date Range: You can restrict the analysis to a specific period (e.g., only recent data) using the Start/End Date inputs.
🔧 Key Inputs You Can Adjust
Input Default Effect
ATR Length 14 Sensitivity of volatility measurement.
ATR Multiplier 2.0 Most important – controls the minimum swing size.
Show Zig Lines On Toggle the ZigZag drawing.
Show Percentage & Price Labels On Shows labels on each pivot.
EMA Length / Source 5, close
Used only for colour logic and reference (not for signals).
⚠️ Important Caveats
Not a standalone entry signal – it’s a post‑facto swing tracker that shows what would have happened. Use it to evaluate your ATR multiplier, not as a direct buy/sell trigger.
Confirmation price is the close of the bar where the reversal threshold is hit – in real trading, slippage and execution delays may increase the actual lag.
Stats accumulate from the start date; reset by changing the date range or reloading the chart.
✅ Summary
This indicator is an educational and diagnostic tool for traders who:
Want to see how an ATR‑based swing system performs historically.
Need to tune their volatility‑adjusted stop/reversal parameters.
Prefer a visual representation of “what would have been captured” vs. “what was actually captured” with a realistic confirmation delay.
By monitoring the System Health row and comparing theoretical vs. confirmed stats, you can systematically optimise the ATR multiplier for the asset and timeframe you are trading.
FOR EDUCATIONAL PURPOSES ONLY
NOT A FINANCIAL ADVICE
🎯 What It Does
Dynamic ZigZag: Plots swing highs/lows only when price moves by a user‑defined multiple of Average True Range (ATR) – this filters out minor noise and adapts to current volatility.
Real‑Time Confirmation Stats: Tracks every confirmed swing and displays a live table with:
Theoretical vs. actual (confirmed) move percentages.
ATR lag cost (how much of the move was missed due to the confirmation rule).
System health diagnostics to help you tune the ATR multiplier.
Visual Overlays: Optionally shows Bollinger Bands, an EMA, and price/percentage labels on each ZigZag pivot.
⚙️ How It Works (Core Logic)
ATR Threshold
Calculates threshold = ATR(14) × Multiplier (default 2.0).
A new swing is confirmed only when price moves away from the current extreme by at least this amount.
Direction Tracking
Bullish mode (dir = 1): Tracks new highs. If price drops below extreme_high - threshold, the swing ends, and a new bearish swing begins.
Bearish mode (dir = -1): Tracks new lows. If price rises above extreme_low + threshold, the swing ends, and a new bullish swing begins.
Data Capture on Confirmation
When a swing completes, the script records:
Theoretical Move: % change between the two extreme pivot prices.
Confirmed (Real) Move: % change from the confirmation bar’s close to the new pivot (simulating an entry at the moment the reversal is confirmed).
Lag Cost: The difference between the two (i.e., missed profit due to waiting for ATR confirmation).
📊 Dashboard (Table) Interpretation
The table (top‑right) updates on the last bar and shows:
Row Metric What It Tells You
Count Number of completed swings Sample size for the stats.
Average / Max / Min Move Theoretical vs. Confirmed
If confirmed averages are much lower than theoretical, the ATR multiplier may be too large (lag) or too small (whipsaw).
Total Cum. Return Sum of all theoretical & confirmed % moves
A quick view of overall performance.
Positive = net upward swings, negative = net downward swings.
Recent Trades
Last 2 swings with direction (▲ BULL / ▼ BEAR)
Shows the most recent trade performance in detail.
ATR System Health Diagnostic status
Green = healthy edge (confirmed profits > lag).
Orange/Red = weak or unprofitable – adjust the ATR Multiplier.
🧠 How to Use & Optimize
Tuning the ATR Multiplier:
Too low → many small swings (whipsaw) – diagnostic will show “UNPROFITABLE EDGE”.
Too high → late entries (high lag) – diagnostic will show “WEAK EDGE”.
Aim for a value where “HEALTHY EDGE” appears and confirmed profits remain strong.
Visual Confirmation:
ZigZag lines change colour (green/red) based on direction.
Labels show the pivot price, theoretical %, and confirmed %. This helps you see if the system would have captured a move in real time.
Date Range: You can restrict the analysis to a specific period (e.g., only recent data) using the Start/End Date inputs.
🔧 Key Inputs You Can Adjust
Input Default Effect
ATR Length 14 Sensitivity of volatility measurement.
ATR Multiplier 2.0 Most important – controls the minimum swing size.
Show Zig Lines On Toggle the ZigZag drawing.
Show Percentage & Price Labels On Shows labels on each pivot.
EMA Length / Source 5, close
Used only for colour logic and reference (not for signals).
⚠️ Important Caveats
Not a standalone entry signal – it’s a post‑facto swing tracker that shows what would have happened. Use it to evaluate your ATR multiplier, not as a direct buy/sell trigger.
Confirmation price is the close of the bar where the reversal threshold is hit – in real trading, slippage and execution delays may increase the actual lag.
Stats accumulate from the start date; reset by changing the date range or reloading the chart.
✅ Summary
This indicator is an educational and diagnostic tool for traders who:
Want to see how an ATR‑based swing system performs historically.
Need to tune their volatility‑adjusted stop/reversal parameters.
Prefer a visual representation of “what would have been captured” vs. “what was actually captured” with a realistic confirmation delay.
By monitoring the System Health row and comparing theoretical vs. confirmed stats, you can systematically optimise the ATR multiplier for the asset and timeframe you are trading.
FOR EDUCATIONAL PURPOSES ONLY
NOT A FINANCIAL ADVICE
Nota Keluaran
v2.0 — Multi-Table Analytics ExpansionAdded 5 new statistics tables (Swing Geometry, Time Metrics, Momentum & Efficiency, Volatility Regime, Risk & Quality) alongside the original Core Stats table.
Each table has its own Show / Position / Text Size controls.
New metrics: efficiency ratio, directional bias, continuation ratio, time symmetry, height trend slope, expansion & compression streaks, win rate, profit factor, expectancy, max consecutive losses, whipsaw count, bars-to-confirm.
Added Rolling Lookback input for regime-adaptive averages.
Swing labels now show H (height) and D (duration in bars) alongside move percentages.
Compression streak of 3+ flags potential breakout setups; whipsaw count reveals whether atrMult is too tight for the current regime.
Nota Keluaran
Scanner & Alert IntegrationThe key additions here are the scan_* boolean flags and the alertcondition() + plot() declarations at the bottom. They work together to make the script visible to TradingView's screener and alert system.
Scanner state flags (scan_pivot_confirmed, scan_bull_pivot, etc.) are reset to false at the start of each bar and set to true inside the existing pivot, compression, expansion, whipsaw, health, and bias-shift logic blocks.
alertcondition() calls expose nine distinct conditions in the "Create Alert → Condition" dropdown. Each condition uses a static title and message that the screener can recognize.
Boolean plot() outputs (display=display.none) create numeric columns the Stock Screener can filter on. A value of 1 means the event fired on the last bar; 0 means it did not.
Numeric plots (scan_dir_bias, scan_last_swing, scan_atr) provide continuous values for screening and ranking.
The original alert() calls remain unchanged, so your existing webhook and popup alerts continue to work alongside the new scanner conditions.
Nota Keluaran
FIXED SOME BUGSADDED A SIMILARITY TABLE TO THE LAST CONFIRMED SWING

Penafian
Maklumat dan penerbitan adalah tidak bertujuan, dan tidak membentuk, nasihat atau cadangan kewangan, pelaburan, dagangan atau jenis lain yang diberikan atau disahkan oleh TradingView. Baca lebih dalam Terma Penggunaan.
Penafian
Maklumat dan penerbitan adalah tidak bertujuan, dan tidak membentuk, nasihat atau cadangan kewangan, pelaburan, dagangan atau jenis lain yang diberikan atau disahkan oleh TradingView. Baca lebih dalam Terma Penggunaan.