OPEN-SOURCE SCRIPT
Pressure Fatigue Index [PFI] v3
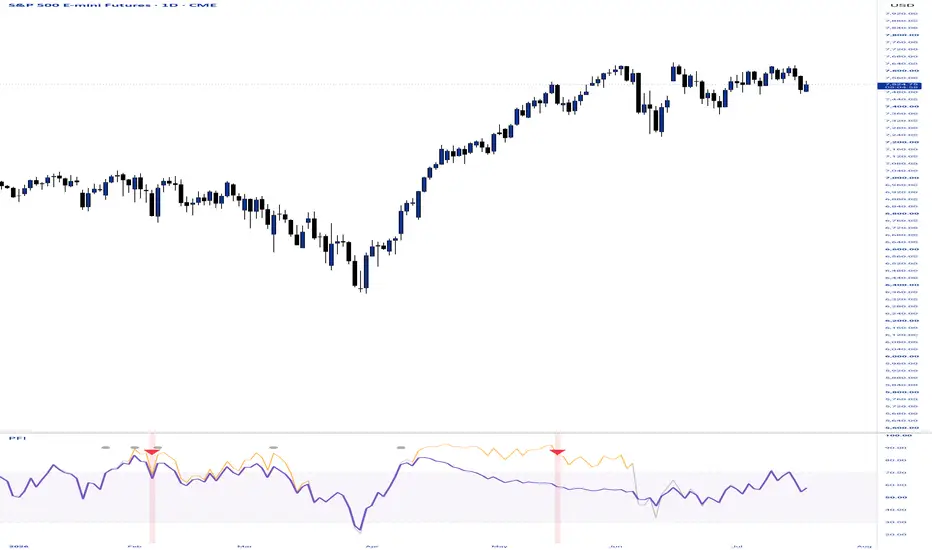
Pressure Fatigue Index (PFI)
OVERVIEW
The Pressure Fatigue Index is a bounded oscillator that reads from 0 to 100. Low readings mean oversold and high readings mean overbought, the same orientation you already know from RSI. That is where the resemblance ends. PFI does not use the average gain versus average loss ratio that RSI is built on. It reads a completely separate stream of information, namely where price settles inside each bar and how forceful that bar was, and it adds a fatigue mechanism that keeps the oscillator from pinning at an extreme for long stretches. That pinning behavior is the single most common frustration with RSI in trending markets, and removing it is the whole point of this tool.
HOW THE READING IS BUILT
For every bar, PFI measures where the close finished inside that bar's own range. A close near the high produces a positive value, a close near the low produces a negative value, and the exact middle of the bar is zero. In plain terms the raw bar value is twice the close, minus the high, minus the low, all divided by the range of the bar.
That location is then weighted by the size of the bar relative to recent volatility, using its true range compared with ATR. A wide conviction bar counts far more than a narrow indecisive one, so a big committed push moves the reading while chop barely registers.
Those weighted values are smoothed with a Wilder average into a running charge, and the charge is passed through a smooth squashing curve, a hyperbolic tangent, that maps it cleanly onto the 0 to 100 scale. The outcome is an oscillator that responds to genuine intrabar buying and selling pressure rather than to close to close drift.
THE FATIGUE MECHANIC
This is what separates PFI from every standard oscillator. While the reading sits beyond your overbought or oversold level, a hidden fatigue term builds up, and it builds faster the deeper the reading has pushed into the extreme. That fatigue then compresses the plotted line back toward the midline. To hold a value pinned at 85 the market would have to supply constantly accelerating fresh pressure, which real markets cannot sustain, so an extended run simply sags the line out of the zone on its own. The moment the reading leaves the extreme, fatigue releases and full sensitivity returns. Fatigue is driven by the underlying raw reading rather than the visible plotted line, so there is no threshold flutter and no repainting.
THE RAW GHOST LINE
PFI plots two lines. The bold purple line is the fatigue compressed reading you trade from. The faint gray ghost line behind it is the raw pressure before fatigue is applied. The distance between the two is itself information. When the ghost is still pinned deep in a zone while the purple line sags away from it, the move is still strong and it is not yet time to fade. When both lines roll out of the zone together, the exhaustion is real. The gap between them also drives the signal engine described below.
THE SIGNAL ENGINE
The buy and sell markers are built to catch turns at the actual low and high, not to fire every time a line touches a level. A signal is the end of a short sequence rather than a single condition, and each side can fire only once per cycle.
A buy requires the following to line up in order. First, a flush bar must occur while the raw reading is oversold, meaning a bar that is unusually wide relative to ATR and that closes down at the bottom of its own range. That is the panic capitulation that tends to mark bottoms, and it is marked on the pane with a small dot. Second, the episode must be mature, meaning the gap between the ghost and the purple line has grown wide enough to prove the move was both deep and sustained. Third, the trigger bar itself must be a conviction reversal, a bar with real size that closes up near the top of its range while the reading turns back up near the zone. In short, sellers pressed hard, exhausted themselves on a flush, and buyers just took the first decisive bar back.
Sells are the exact mirror. A euphoric blowoff bar in the overbought zone, a mature episode, and then a heavy rejection bar near the high.
After a signal fires, that side locks and cannot fire again until the reading passes back through the midline, so a single messy bottoming or topping process produces one marker rather than a cluster. A cooldown allows a second attempt only if a fresh, deeper flush develops.
There is also an optional divergence filter. When enabled, a buy also requires price to print a new low for the episode while the pressure reading makes a higher low, the classic bottoming tell. It is off by default because it screens out clean sharp reversals that have no divergence, but you can enable it when you only want the highest conviction fades.
INPUTS
Core sets the price source, the pressure length, the volatility length, and the sensitivity that controls how easily the reading reaches its extremes.
Zones set your overbought and oversold levels.
Fatigue exposes the build rate, the release rate, and the impact, so you can tune how quickly the oscillator tires and recovers and how hard it is pulled back toward the middle.
Signals expose the arm gap, the flush bar strictness, the trigger bar strictness, the near zone buffer, the optional divergence filter, and the re signal cooldown.
Smoothing gives you a moving average over the oscillator with the same menu as the built in RSI, including SMA, EMA, SMMA, WMA, VWMA, and an SMA option with Bollinger Bands.
HOW TO USE IT
Treat the purple line the way you would treat any oscillator, with low as oversold and high as overbought, but trust it to leave the zone on its own rather than staying stuck. Use the ghost line and its distance from the purple line to judge whether a move is still strong or genuinely tiring. Take the triangle markers as your prepared fade entries, and remember that each side fires once per cycle by design. If you want more markers on a fast timeframe, loosen the flush range first, then the arm gap, then the trigger close location. If you want fewer and stronger markers, do the reverse and consider enabling the divergence filter.
Set your alerts to fire once per bar close, since the live bar can move before it settles.
NOTE
This tool is offered for research and education. It is not financial advice. Test it on your own markets and timeframes and manage your own risk before trading it.
OVERVIEW
The Pressure Fatigue Index is a bounded oscillator that reads from 0 to 100. Low readings mean oversold and high readings mean overbought, the same orientation you already know from RSI. That is where the resemblance ends. PFI does not use the average gain versus average loss ratio that RSI is built on. It reads a completely separate stream of information, namely where price settles inside each bar and how forceful that bar was, and it adds a fatigue mechanism that keeps the oscillator from pinning at an extreme for long stretches. That pinning behavior is the single most common frustration with RSI in trending markets, and removing it is the whole point of this tool.
HOW THE READING IS BUILT
For every bar, PFI measures where the close finished inside that bar's own range. A close near the high produces a positive value, a close near the low produces a negative value, and the exact middle of the bar is zero. In plain terms the raw bar value is twice the close, minus the high, minus the low, all divided by the range of the bar.
That location is then weighted by the size of the bar relative to recent volatility, using its true range compared with ATR. A wide conviction bar counts far more than a narrow indecisive one, so a big committed push moves the reading while chop barely registers.
Those weighted values are smoothed with a Wilder average into a running charge, and the charge is passed through a smooth squashing curve, a hyperbolic tangent, that maps it cleanly onto the 0 to 100 scale. The outcome is an oscillator that responds to genuine intrabar buying and selling pressure rather than to close to close drift.
THE FATIGUE MECHANIC
This is what separates PFI from every standard oscillator. While the reading sits beyond your overbought or oversold level, a hidden fatigue term builds up, and it builds faster the deeper the reading has pushed into the extreme. That fatigue then compresses the plotted line back toward the midline. To hold a value pinned at 85 the market would have to supply constantly accelerating fresh pressure, which real markets cannot sustain, so an extended run simply sags the line out of the zone on its own. The moment the reading leaves the extreme, fatigue releases and full sensitivity returns. Fatigue is driven by the underlying raw reading rather than the visible plotted line, so there is no threshold flutter and no repainting.
THE RAW GHOST LINE
PFI plots two lines. The bold purple line is the fatigue compressed reading you trade from. The faint gray ghost line behind it is the raw pressure before fatigue is applied. The distance between the two is itself information. When the ghost is still pinned deep in a zone while the purple line sags away from it, the move is still strong and it is not yet time to fade. When both lines roll out of the zone together, the exhaustion is real. The gap between them also drives the signal engine described below.
THE SIGNAL ENGINE
The buy and sell markers are built to catch turns at the actual low and high, not to fire every time a line touches a level. A signal is the end of a short sequence rather than a single condition, and each side can fire only once per cycle.
A buy requires the following to line up in order. First, a flush bar must occur while the raw reading is oversold, meaning a bar that is unusually wide relative to ATR and that closes down at the bottom of its own range. That is the panic capitulation that tends to mark bottoms, and it is marked on the pane with a small dot. Second, the episode must be mature, meaning the gap between the ghost and the purple line has grown wide enough to prove the move was both deep and sustained. Third, the trigger bar itself must be a conviction reversal, a bar with real size that closes up near the top of its range while the reading turns back up near the zone. In short, sellers pressed hard, exhausted themselves on a flush, and buyers just took the first decisive bar back.
Sells are the exact mirror. A euphoric blowoff bar in the overbought zone, a mature episode, and then a heavy rejection bar near the high.
After a signal fires, that side locks and cannot fire again until the reading passes back through the midline, so a single messy bottoming or topping process produces one marker rather than a cluster. A cooldown allows a second attempt only if a fresh, deeper flush develops.
There is also an optional divergence filter. When enabled, a buy also requires price to print a new low for the episode while the pressure reading makes a higher low, the classic bottoming tell. It is off by default because it screens out clean sharp reversals that have no divergence, but you can enable it when you only want the highest conviction fades.
INPUTS
Core sets the price source, the pressure length, the volatility length, and the sensitivity that controls how easily the reading reaches its extremes.
Zones set your overbought and oversold levels.
Fatigue exposes the build rate, the release rate, and the impact, so you can tune how quickly the oscillator tires and recovers and how hard it is pulled back toward the middle.
Signals expose the arm gap, the flush bar strictness, the trigger bar strictness, the near zone buffer, the optional divergence filter, and the re signal cooldown.
Smoothing gives you a moving average over the oscillator with the same menu as the built in RSI, including SMA, EMA, SMMA, WMA, VWMA, and an SMA option with Bollinger Bands.
HOW TO USE IT
Treat the purple line the way you would treat any oscillator, with low as oversold and high as overbought, but trust it to leave the zone on its own rather than staying stuck. Use the ghost line and its distance from the purple line to judge whether a move is still strong or genuinely tiring. Take the triangle markers as your prepared fade entries, and remember that each side fires once per cycle by design. If you want more markers on a fast timeframe, loosen the flush range first, then the arm gap, then the trigger close location. If you want fewer and stronger markers, do the reverse and consider enabling the divergence filter.
Set your alerts to fire once per bar close, since the live bar can move before it settles.
NOTE
This tool is offered for research and education. It is not financial advice. Test it on your own markets and timeframes and manage your own risk before trading it.
Skrip sumber terbuka
Dalam semangat TradingView sebenar, pencipta skrip ini telah menjadikannya sumber terbuka, jadi pedagang boleh menilai dan mengesahkan kefungsiannya. Terima kasih kepada penulis! Walaupuan anda boleh menggunakan secara percuma, ingat bahawa penerbitan semula kod ini tertakluk kepada Peraturan Dalaman.

Don't force a trade. Wait for your setup, be patient. Trade ideas are my own and not financial advice, I'm a monkey with a phone for crying out loud.
Penafian
Maklumat dan penerbitan adalah tidak bertujuan, dan tidak membentuk, nasihat atau cadangan kewangan, pelaburan, dagangan atau jenis lain yang diberikan atau disahkan oleh TradingView. Baca lebih dalam Terma Penggunaan.
Skrip sumber terbuka
Dalam semangat TradingView sebenar, pencipta skrip ini telah menjadikannya sumber terbuka, jadi pedagang boleh menilai dan mengesahkan kefungsiannya. Terima kasih kepada penulis! Walaupuan anda boleh menggunakan secara percuma, ingat bahawa penerbitan semula kod ini tertakluk kepada Peraturan Dalaman.
Don't force a trade. Wait for your setup, be patient. Trade ideas are my own and not financial advice, I'm a monkey with a phone for crying out loud.
Penafian
Maklumat dan penerbitan adalah tidak bertujuan, dan tidak membentuk, nasihat atau cadangan kewangan, pelaburan, dagangan atau jenis lain yang diberikan atau disahkan oleh TradingView. Baca lebih dalam Terma Penggunaan.