OPEN-SOURCE SCRIPT
Telah dikemas kini RSI Divergence Detector
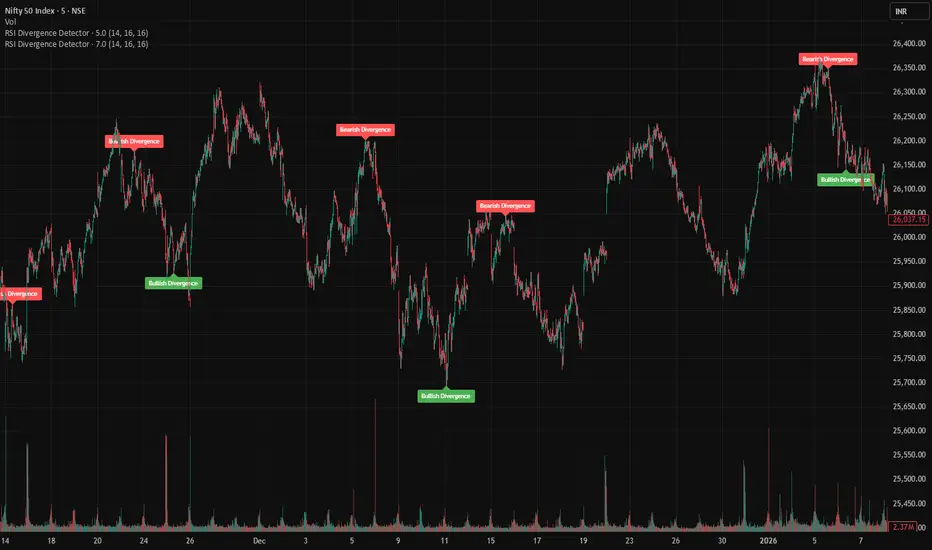
This indicator automatically detects bullish and bearish RSI divergences and displays them directly on the price chart.
A bullish divergence occurs when price forms a lower low while RSI forms a higher low, which may indicate weakening bearish momentum and a potential upward reversal.
A bearish divergence occurs when price forms a higher high while RSI forms a lower high, which may signal weakening bullish momentum and a possible downward reversal.
The script uses pivot highs and lows on both price and RSI to identify confirmed divergences and plots labels on the chart when they occur.
Inputs
RSI Length – period used to calculate RSI
Pivot Left Bars – bars required on the left to confirm a pivot
Pivot Right Bars – bars required on the right to confirm a pivot
Because pivots require confirmation, signals appear after several bars.
A bullish divergence occurs when price forms a lower low while RSI forms a higher low, which may indicate weakening bearish momentum and a potential upward reversal.
A bearish divergence occurs when price forms a higher high while RSI forms a lower high, which may signal weakening bullish momentum and a possible downward reversal.
The script uses pivot highs and lows on both price and RSI to identify confirmed divergences and plots labels on the chart when they occur.
Inputs
RSI Length – period used to calculate RSI
Pivot Left Bars – bars required on the left to confirm a pivot
Pivot Right Bars – bars required on the right to confirm a pivot
Because pivots require confirmation, signals appear after several bars.
Nota Keluaran
UpdateNota Keluaran
updatesNota Keluaran
updateNota Keluaran
updatesNota Keluaran
update: added alertSkrip sumber terbuka
Dalam semangat TradingView sebenar, pencipta skrip ini telah menjadikannya sumber terbuka, jadi pedagang boleh menilai dan mengesahkan kefungsiannya. Terima kasih kepada penulis! Walaupuan anda boleh menggunakan secara percuma, ingat bahawa penerbitan semula kod ini tertakluk kepada Peraturan Dalaman.

Penafian
Maklumat dan penerbitan adalah tidak bertujuan, dan tidak membentuk, nasihat atau cadangan kewangan, pelaburan, dagangan atau jenis lain yang diberikan atau disahkan oleh TradingView. Baca lebih dalam Terma Penggunaan.
Skrip sumber terbuka
Dalam semangat TradingView sebenar, pencipta skrip ini telah menjadikannya sumber terbuka, jadi pedagang boleh menilai dan mengesahkan kefungsiannya. Terima kasih kepada penulis! Walaupuan anda boleh menggunakan secara percuma, ingat bahawa penerbitan semula kod ini tertakluk kepada Peraturan Dalaman.
Penafian
Maklumat dan penerbitan adalah tidak bertujuan, dan tidak membentuk, nasihat atau cadangan kewangan, pelaburan, dagangan atau jenis lain yang diberikan atau disahkan oleh TradingView. Baca lebih dalam Terma Penggunaan.