OPEN-SOURCE SCRIPT
Bitcoin 2Y-SMA Bands| Astral Vision
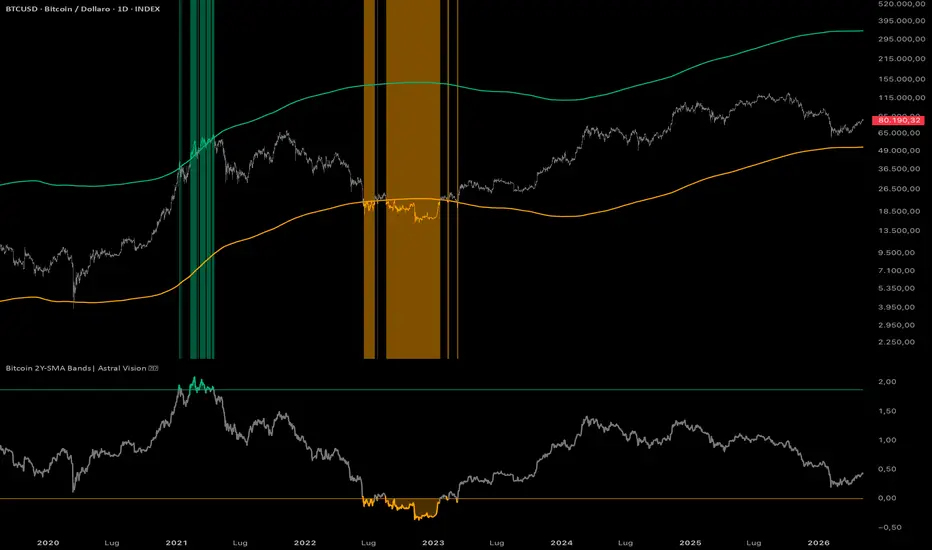
Bitcoin 2Y-SMA Bands | Astral Vision 🌠💠
The 2-year simple moving average spans a full halving epoch, filtering short and medium-term noise to expose Bitcoin's underlying long-term trend. This indicator builds a two-band valuation framework anchored to this baseline.
The bottom band scales the 2Y-SMA by a configurable multiplier (default 0.6), the level at which every major bear market has historically found its floor.
The top band scales from the bottom by a second multiplier (default 6.5), marking the ceiling of speculative excess beyond which price has rarely sustained.
The oscillator panel plots the log ratio of price to the bottom band, keeping both reference levels flat and proportionally scaled across all cycles regardless of Bitcoin's absolute price.
Calculation ⚙️
`Investor Bottom = SMA(close, 730) × bottom_multiplier`
`Investor Top = Investor Bottom × top_multiplier`
`Ratio = close / Investor Bottom`
`Oscillator = log(Ratio)` plotted against `log(1.0)` and `log(top_multiplier)`
Purpose 🎯
This indicator is a personal research tool designed to contextualize Bitcoin's price within a long-term valuation framework based on the 2-year simple moving average.
Disclaimer ⭕️
It is not financial advice, not an investment recommendation, and not affiliated with any financial institution, research firm, or organization of any kind. All content is provided for educational and informational purposes only. Always conduct your own research before making any financial decision.
Inputs 🎛️
- `Bottom Multiplier` scales the 2Y-SMA to define the accumulation floor (default 0.6)
- `Top Multiplier` scales the bottom band to define the distribution ceiling (default 6.5)
- `Plot Candle` toggles candle coloring on the price chart
- `Use Gradient Color` colors candles continuously by position within the valuation range rather than by binary threshold crossing
Colors 🎨
5 Astral Vision presets + custom override. Default: Hermes.
Plots 📊
- Investor bottom and top bands projected directly on the price chart
- Log ratio oscillator in the lower panel with fills at both extremes
- Background highlight when price breaches either band
- Candle coloring by active regime or continuous gradient
The 2-year simple moving average spans a full halving epoch, filtering short and medium-term noise to expose Bitcoin's underlying long-term trend. This indicator builds a two-band valuation framework anchored to this baseline.
The bottom band scales the 2Y-SMA by a configurable multiplier (default 0.6), the level at which every major bear market has historically found its floor.
The top band scales from the bottom by a second multiplier (default 6.5), marking the ceiling of speculative excess beyond which price has rarely sustained.
The oscillator panel plots the log ratio of price to the bottom band, keeping both reference levels flat and proportionally scaled across all cycles regardless of Bitcoin's absolute price.
Calculation ⚙️
`Investor Bottom = SMA(close, 730) × bottom_multiplier`
`Investor Top = Investor Bottom × top_multiplier`
`Ratio = close / Investor Bottom`
`Oscillator = log(Ratio)` plotted against `log(1.0)` and `log(top_multiplier)`
Purpose 🎯
This indicator is a personal research tool designed to contextualize Bitcoin's price within a long-term valuation framework based on the 2-year simple moving average.
Disclaimer ⭕️
It is not financial advice, not an investment recommendation, and not affiliated with any financial institution, research firm, or organization of any kind. All content is provided for educational and informational purposes only. Always conduct your own research before making any financial decision.
Inputs 🎛️
- `Bottom Multiplier` scales the 2Y-SMA to define the accumulation floor (default 0.6)
- `Top Multiplier` scales the bottom band to define the distribution ceiling (default 6.5)
- `Plot Candle` toggles candle coloring on the price chart
- `Use Gradient Color` colors candles continuously by position within the valuation range rather than by binary threshold crossing
Colors 🎨
5 Astral Vision presets + custom override. Default: Hermes.
Plots 📊
- Investor bottom and top bands projected directly on the price chart
- Log ratio oscillator in the lower panel with fills at both extremes
- Background highlight when price breaches either band
- Candle coloring by active regime or continuous gradient
Skrip sumber terbuka
Dalam semangat TradingView sebenar, pencipta skrip ini telah menjadikannya sumber terbuka, jadi pedagang boleh menilai dan mengesahkan kefungsiannya. Terima kasih kepada penulis! Walaupuan anda boleh menggunakan secara percuma, ingat bahawa penerbitan semula kod ini tertakluk kepada Peraturan Dalaman.

My premium indicators are available on Whop:
whop.com/astralvision
Astral Vision 🌠💠
whop.com/astralvision
Astral Vision 🌠💠
Penafian
Maklumat dan penerbitan adalah tidak bertujuan, dan tidak membentuk, nasihat atau cadangan kewangan, pelaburan, dagangan atau jenis lain yang diberikan atau disahkan oleh TradingView. Baca lebih dalam Terma Penggunaan.
Skrip sumber terbuka
Dalam semangat TradingView sebenar, pencipta skrip ini telah menjadikannya sumber terbuka, jadi pedagang boleh menilai dan mengesahkan kefungsiannya. Terima kasih kepada penulis! Walaupuan anda boleh menggunakan secara percuma, ingat bahawa penerbitan semula kod ini tertakluk kepada Peraturan Dalaman.
My premium indicators are available on Whop:
whop.com/astralvision
Astral Vision 🌠💠
whop.com/astralvision
Astral Vision 🌠💠
Penafian
Maklumat dan penerbitan adalah tidak bertujuan, dan tidak membentuk, nasihat atau cadangan kewangan, pelaburan, dagangan atau jenis lain yang diberikan atau disahkan oleh TradingView. Baca lebih dalam Terma Penggunaan.