OPEN-SOURCE SCRIPT
MAHQuant_IND_WeeklyDailyHL_v1.0
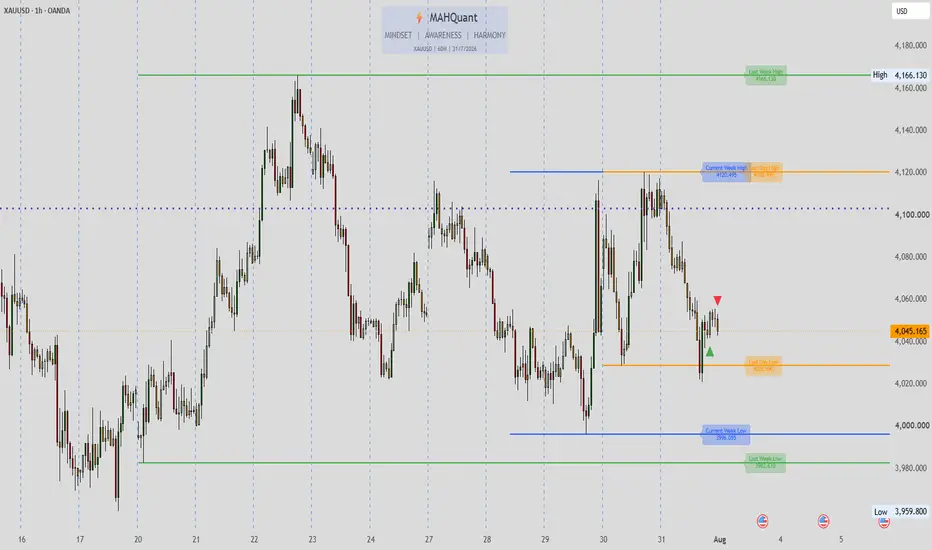
MAHQuant Weekly & Daily High-Low Levels
A professional price action indicator that automatically draws the previous week's and day's High/Low levels, as well as the current week's (Monday-Wednesday) range. It also includes a candle comparison feature to detect potential reversal signals.
🧠 HOW IT WORKS:
Weekly Levels (Previous Week):
• Retrieves the highest and lowest prices from the previous full trading week using request.security("W", ...)
• Draws horizontal lines at those levels
• Includes adjustable percentage offsets to create buffer zones
• Labels display the exact price value
Daily Levels (Previous Day):
• Retrieves the highest and lowest prices from the previous trading day using request.security("D", ...)
• Draws horizontal lines at those levels
• Includes adjustable percentage offsets
• Labels display the exact price value
Current Week Levels (Monday - Wednesday):
• Tracks the high and low from Monday, Tuesday, and Wednesday separately
• After Wednesday close, calculates the highest high and lowest low among these 3 days
• Draws a single range line for the entire current week
• Extends to the right for forward-looking reference
Candle Comparison Logic:
• Compares the current candle's wick size to the previous candle's wick size
• Identifies when the current candle is opposite in direction (e.g., red after green)
• Highlights when the current candle's wick is larger than the previous candle's wick
• This helps spot potential rejection or reversal patterns
Bar Coloring Logic:
• Green: Bullish candle with large body and high volume
• Light Green: Bullish candle with small body or low volume
• Red: Bearish candle with large body and high volume
• Orange: Bearish candle with small body or low volume
⚙️ HOW TO USE:
1. Set your broker's timezone in the "Timezone" input
2. Toggle Weekly/Daily/Current Week levels on/off
3. Adjust the offset percentages to create buffer zones
4. Enable "Candle Comparison" to spot rejection signals
⚠️ DISCLAIMER:
This script is for educational purposes only. Not financial advice. Past performance does not guarantee future results.
📌 VERSION: 1.0 | DEVELOPER: MAHQuant | UPDATED: August 2026
🙏 Special thanks to Mr. Amirreza Arya for his valuable educational insights that inspired this tool.
Skrip sumber terbuka
Dalam semangat TradingView sebenar, pencipta skrip ini telah menjadikannya sumber terbuka, jadi pedagang boleh menilai dan mengesahkan kefungsiannya. Terima kasih kepada penulis! Walaupuan anda boleh menggunakan secara percuma, ingat bahawa penerbitan semula kod ini tertakluk kepada Peraturan Dalaman.

Telegram: t.me/MAHQuantTradingSystem
TikTok: tiktok.com/@mahquant?_r=1&_t=ZS-99XOUB9EXLw
TikTok: tiktok.com/@mahquant?_r=1&_t=ZS-99XOUB9EXLw
Penafian
Maklumat dan penerbitan adalah tidak bertujuan, dan tidak membentuk, nasihat atau cadangan kewangan, pelaburan, dagangan atau jenis lain yang diberikan atau disahkan oleh TradingView. Baca lebih dalam Terma Penggunaan.
Skrip sumber terbuka
Dalam semangat TradingView sebenar, pencipta skrip ini telah menjadikannya sumber terbuka, jadi pedagang boleh menilai dan mengesahkan kefungsiannya. Terima kasih kepada penulis! Walaupuan anda boleh menggunakan secara percuma, ingat bahawa penerbitan semula kod ini tertakluk kepada Peraturan Dalaman.
Penafian
Maklumat dan penerbitan adalah tidak bertujuan, dan tidak membentuk, nasihat atau cadangan kewangan, pelaburan, dagangan atau jenis lain yang diberikan atau disahkan oleh TradingView. Baca lebih dalam Terma Penggunaan.