Penunjuk

Penunjuk
Penunjuk

Strategi

Penunjuk

Penunjuk

Multi-indicator Signal Builder [Skyrexio]Overview
Multi-Indicator Signal Builder is a versatile, all-in-one script designed to streamline your trading workflow by combining multiple popular technical indicators under a single roof.
It features a single-entry, single-exit logic, intrabar stop-loss/take-profit handling, an optional time filter, a visually accessible condition table, and a built-in statistics label.
Traders can choose any combination of 12+ indicators (RSI, Ultimate Oscillator, Bollinger %B, Moving Averages, ADX, Stochastic, MACD, PSAR, MFI, CCI, Heikin Ashi, and a “TV Screener” placeholder) to form entry or exit conditions.
This script aims to simplify strategy creation and analysis , making it a powerful toolkit for technical traders.
Indicators Overview
RSI (Relative Strength Index)
Measures recent price changes to evaluate overbought or oversold conditions on a 0–100 scale.
Ultimate Oscillator (UO)
Uses weighted averages of three different timeframes, aiming to confirm price momentum while avoiding false divergences.
Bollinger %B
Expresses price relative to Bollinger Bands, indicating whether price is near the upper band (overbought) or lower band (oversold).
Moving Average (MA)
Smooths price data over a specified period. The script supports both SMA and EMA to help identify trend direction and potential crossovers.
ADX (Average Directional Index)
Gauges the strength of a trend (0–100). Higher ADX signals stronger momentum, while lower ADX indicates a weaker trend.
Stochastic
Compares a closing price to a price range over a given period to identify momentum shifts and potential reversals.
MACD (Moving Average Convergence/Divergence)
Tracks the difference between two EMAs plus a signal line, commonly used to spot momentum flips through crossovers.
PSAR (Parabolic SAR)
Plots a trailing stop-and-reverse dot that moves with the trend. Often used to signal potential reversals when price crosses PSAR.
MFI (Money Flow Index)
Similar to RSI but incorporates volume data. A reading above 80 can suggest overbought conditions, while below 20 may indicate oversold.
CCI (Commodity Channel Index)
Identifies cyclical trends or overbought/oversold levels by comparing current price to an average price over a set timeframe.
Heikin Ashi
A type of candlestick charting that filters out market noise. The script uses a streak-based approach (multiple consecutive bullish or bearish bars) to gauge mini-trends.
TV Screener
A placeholder condition designed to integrate external buy/sell logic (like a TradingView “Buy” or “Sell” rating). Users can override or reference external signals if desired.
Unique Features
Multi-Indicator Entry and Exit
You can selectively enable any subset of 12+ classic indicators, each with customizable parameters and conditions. A position opens only if all enabled entry conditions are met, and it closes only when all enabled exit conditions are satisfied, helping reduce false triggers.
Single-Entry / Single-Exit with Intrabar SL/TP
The script supports a single position at a time. Once a position is open, it monitors intrabar to see if the price hits your stop-loss or take-profit levels before the bar closes, making results more realistic for fast-moving markets.
Time Window Filter
Users may specify a start/end date range during which trades are allowed, making it convenient to focus on specific market cycles for backtesting or live trading.
Condition Table and Statistics
A table at the bottom of the chart lists all active entry/exit indicators. Upon each closed trade, an integrated statistics label displays net profit, total trades, win/loss count, average and median PnL, etc.
Seamless Alerts and Automation
• Configure alerts in TradingView using “Any alert() function call.”
• The script sends JSON alert messages you can route to your own webhook.
• The indicator can be integrated with Skyrexio alert bots to automate execution on major cryptocurrency exchanges.
Optional MA/PSAR Plots
For added visual clarity, optionally plot the chosen moving averages or PSAR on the chart to confirm signals without stacking multiple indicators.
Methodology
Multi-Indicator Entry Logic
When multiple entry indicators are enabled (e.g., RSI + Stochastic + MACD), the script requires all signals to align before generating an entry. Each indicator can be set for crossovers, crossunders, thresholds (above/below), etc. This “AND” logic aims to filter out low-confidence triggers.
Single-Entry Intrabar SL/TP
• One Position At a Time: Once an entry signal triggers, a trade opens at the bar’s close.
• Intrabar Checks: Stop-loss and take-profit levels (if enabled) are monitored on every tick. If either is reached, the position closes immediately, without waiting for the bar to end.
Exit Logic
All Conditions Must Agree: If the trade is still open (SL/TP not triggered), then all enabled exit indicators must confirm a closure before the script exits on the bar’s close.
Time Filter
Optional Trading Window: You can activate a date/time range to constrain entries and exits strictly to that interval.
Justification of Methodology
Indicator Confluence: Combining multiple tools (RSI, MACD, etc.) can reduce noise and false signals.
Intrabar SL/TP: Capturing real-time spikes or dips provides a more precise reflection of typical live trading scenarios.
Single-Entry Model: Straightforward for both manual and automated tracking (especially important in bridging to bots).
Custom Date Range: Helps refine backtesting for specific market conditions or to avoid known irregular data periods.
How to Use
Add the Script to Your Chart
• In TradingView, open Indicators , search for “Multi-indicator Signal Builder” .
• Click to add it to your chart.
Configure Inputs
• Time Filter: Set a start and end date for trades.
• Alerts Messages: Input any JSON or text payload needed by your external service or bot.
• Entry Conditions: Enable and configure any indicators (e.g., RSI, MACD) for a confluence-based entry.
• Close Conditions: Enable exit indicators, along with optional SL (negative %) and TP (positive %) levels.
Set Up Alerts
• In TradingView, select “Create Alert” → Condition = “Any alert() function call” → choose this script.
• Entry Alert: Triggers on the script’s entry signal.
• Close Alert: Triggers on the script’s close signal (or if SL/TP is hit).
• Skyrexio Alert Bots: You can route these alerts via webhook to Skyrexio alert bots to automate order execution on major crypto exchanges (or any other supported broker).
Visual Reference
• A condition table at the bottom summarizes active signals.
• Statistics Label updates automatically as trades are closed, showing PnL stats and distribution metrics.
Backtesting Guidelines
Symbol/Timeframe: Works on multiple assets and timeframes; always do thorough testing.
Realistic Costs: Adjust commissions and potential slippage to match typical exchange conditions.
Risk Management: If using the built-in stop-loss/take-profit, set percentages that reflect your personal risk tolerance.
Longer Test Horizons: Verify performance across diverse market cycles to gauge reliability.
Example of statistic calculation
Test Period: 2023-01-01 to 2025-12-31
Initial Capital: $1,000
Commission: 0.1%, Slippage ~5 ticks
Trade Count: 680 (varies by strategy conditions)
Win rate: 75.44% (varies by strategy conditions)
Net Profit: +90.14% (varies by strategy conditions)
Disclaimer
This indicator is provided strictly for informational and educational purposes.
It does not constitute financial or trading advice.
Past performance never guarantees future results.
Always test thoroughly in demo environments before using real capital.
Enjoy exploring the Multi-Indicator Signal Builder! Experiment with different indicator combinations and adjust parameters to align with your trading preferences, whether you trade manually or link your alerts to external automation services. Happy trading and stay safe! Penunjuk

AMT VWAP [hardi]█ OVERVIEW
AMT VWAP is a clean, minimalist VWAP indicator with Standard Deviation bands, designed to complement the Auction Market Theory (AMT) trading methodology by Fabio Valentino.
This indicator focuses on one thing and does it well: displaying VWAP and its deviation bands clearly on your chart.
█ FEATURES
- Daily VWAP with automatic reset
- ±1 Standard Deviation bands (cyan)
- ±2 Standard Deviation bands (orange) - extreme zones
- Clean labels that don't clutter your chart
- Info table showing current bias and zone
- Compact Mode for mobile/smartphone users
- Fully customizable colors and settings
- Built-in alerts for all levels
█ HOW TO USE
VWAP (Volume Weighted Average Price) represents the "fair value" where most volume has transacted. In AMT methodology:
BIAS DETERMINATION:
- Price ABOVE VWAP = Bullish bias (buyers in control)
- Price BELOW VWAP = Bearish bias (sellers in control)
TRADING ZONES:
- ±1 SD: Normal deviation zone - potential mean reversion area
- ±2 SD: Extreme zone - high probability reversal area (95%+ reversion rate)
ENTRY STRATEGIES:
1. Trend Following: Buy pullbacks to VWAP in uptrend, sell rallies to VWAP in downtrend
2. Mean Reversion: Fade moves at ±2 SD bands with confirmation
█ RECOMMENDED SETUP
Use this indicator together with:
- TradingView's built-in "SVP HD" (Session Volume Profile) for POC/VAH/VAL levels
- AMT CVD indicator (companion indicator) for order flow analysis
This combination gives you the complete AMT toolkit:
- SVP HD → Key levels (POC, VAH, VAL)
- AMT VWAP → Dynamic support/resistance & bias
- AMT CVD → Aggression, Absorption, Exhaustion signals
█ SETTINGS
Display Settings:
- Compact Mode - Enable for cleaner mobile view
- Show Labels - Toggle level labels
- Label Size - Adjust for your screen
VWAP Settings:
- Band Multipliers - Adjust SD band distance (default: 1.0 and 2.0)
- Colors - Fully customizable
- Line widths - Adjust visibility
Alerts:
- Near VWAP
- Near ±1 SD
- Near ±2 SD (extreme zones)
█ METHODOLOGY
This indicator is based on Auction Market Theory as taught by Fabio Valentino:
"The market is a continuous auction seeking fair value. VWAP represents this fair value dynamically throughout the session. Deviations from VWAP create trading opportunities as price tends to revert to the mean."
Key principles:
- Read, don't predict
- Location over technique
- Evidence-based entries
█ ALERTS
Set alerts for:
- Price approaching VWAP (potential support/resistance)
- Price at ±1 SD (first deviation - watch for reaction)
- Price at ±2 SD (extreme - high probability reversal zone)
█ NOTES
- Works on all timeframes
- Best used on 15m for intraday entries
- VWAP resets daily at market open
- Combine with volume profile for best results
█ CREDITS
Based on Auction Market Theory methodology by Fabio Valentino.
Indicator developed for the trading community.
If you find this useful, please leave a like! 👍
vwap, volume-weighted-average-price, standard-deviation, bands, auction-market-theory, amt, fabio-valentino, mean-reversion, trend-following, intraday, day-trading, support-resistance, fair-value Penunjuk

Penunjuk

Penunjuk

Penunjuk

Penunjuk

Penunjuk
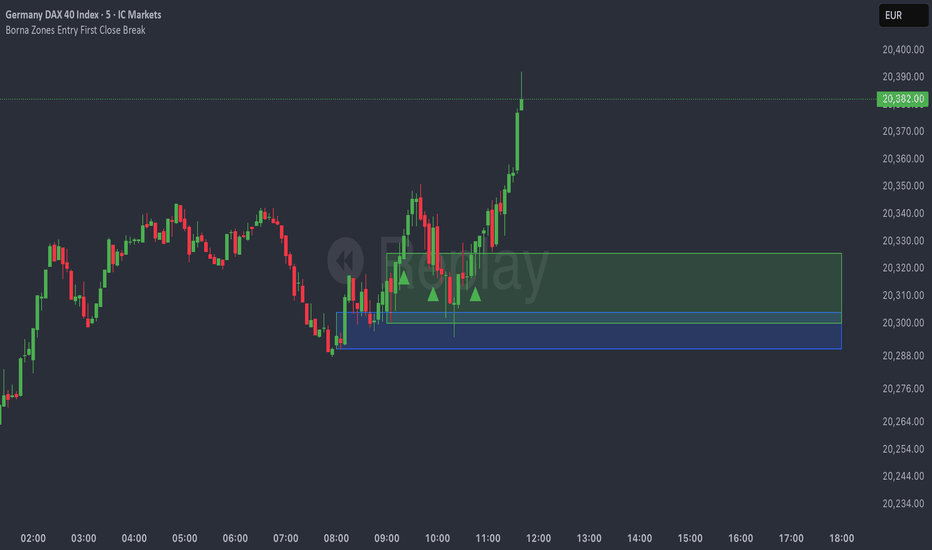
As Good As It Gets Pivot ArrowsAs Good As It Gets Pivot Arrows
Description
- As Good As It Gets Pivot Arrows is a clean, high-precision pivot detection indicator that plots bright green upward triangles for confirmed pivot lows (buy signals) and red downward triangles for confirmed pivot highs (sell signals), and comes with customizable pivot length. Additionally, it optionally displays white dots for double-top/double-bottom pivots within a user-defined percentage tolerance.
Key Features
- Exact replication of TOS pivot high/low triangles (12-arrow style)
- Customizable pivot length (default 7)
- Option to ignore the last unconfirmed bar
- Toggle triangles and/or pivot dots independently
- Double-top/bottom detection with adjustable % tolerance (0.1% default)
- Clean visual signals with no repainting on confirmed pivots
What Makes It Unique
- This script delivers the pivot arrow behavior (including brighter lime-green buy triangles) that many traders love, with added flexibility: individual toggles for triangles/dots, double-top/bottom detection, and full customization. Unlike generic pivot indicators, it has precise confirmation logic while remaining fast and non-repainting on closed bars.
How to Use and Trade With It
- Adjust "Pivot Length" to suit your timeframe (7–14 common)
- Enable/disable triangles or dots as preferred
- Fine-tune "% Tolerance" for double-top/bottom sensitivity
Trading Signals
- Green upward triangle below bar: Confirmed pivot low → potential LONG entry or support
- Red downward triangle above bar: Confirmed pivot high → potential SHORT entry or - resistance
- White dots: Double-top (above) or double-bottom (below) within tolerance → higher-probability reversal zones
Best Practice
- Use triangles for primary swing entries/exits
- Combine with volume, trend filters, or support/resistance for confirmation
- Works on any timeframe; shorter lengths for intraday scalping, longer for positional trading Penunjuk

Penunjuk

Penunjuk

Reverse RSI//@version=6
indicator("Reverse RSI", overlay=false)
rsi_length = input.int(14, title="RSI Length", minval=1)
ob_level = input.int(75, title="Overbought Level")
os_level = input.int(25, title="Oversold Level")
invRSI(target, length) =>
target_rs = target / (100 - target)
up = math.max(close-close , 0)
down = math.max(close -close, 0)
prev_avg_up = ta.rma(up, length)
prev_avg_down = ta.rma(down, length)
price_up = target_rs * (prev_avg_down * (length - 1)) - (prev_avg_up * (length - 1)) + close
price_down = (prev_avg_down * (length - 1) - (prev_avg_up * (length - 1)) / target_rs) + close
current_rsi = ta.rsi(close, length)
price = target > current_rsi ? price_up : price_down
price
price_ob = invRSI(ob_level, rsi_length)
price_mid = invRSI(50, rsi_length)
price_os = invRSI(os_level, rsi_length)
upside = (price_ob-close)/close*100
downside = (close-price_os)/close*100
net = upside-downside
plot(upside, title="Upside Line", color=color.green)
plot(downside, title="Downside Line", color=color.red)
plot(net, title="Net Line", color=net>0?color.new(color.green, 30):color.new(color.red, 30), style=plot.style_columns)
hline(0, "Zero Line")
Penunjuk

Dynamic Support Resistance Zones======================================================================
TRADINGVIEW PUBLICATION - DYNAMIC SUPPORT RESISTANCE ZONES
======================================================================
TITLE: Dynamic Support Resistance Zones
SHORT TITLE: SR Zones
--------------------------------------------------------------------------------
DESCRIPTION (Copy below for TradingView publication)
--------------------------------------------------------------------------------
The Dynamic Support Resistance Zones indicator identifies key price levels where potential reversals may occur by analyzing candlestick behavior and volume dynamics together.
▶ CONCEPT AND METHODOLOGY
This indicator detects support and resistance levels through a specific combination of three market conditions occurring simultaneously:
1. Candlestick Body Expansion: The current candle's body (distance between open and close) must be larger than the previous candle's body. This signals increased price commitment from market participants.
2. Direction Reversal: The current candle must close in the opposite direction of the previous candle. A bullish candle following a bearish candle suggests potential support formation, while a bearish candle following a bullish candle suggests potential resistance formation.
3. Volume Contraction: The current candle must have lower volume than the previous candle. This condition filters out high-volume breakout moves and focuses on exhaustion patterns where price reverses on decreasing participation.
When all three conditions align, the indicator marks the opening price of the previous candle as a significant level.
▶ HOW LEVELS ARE CLASSIFIED
Support Zones (Green Lines): Form when a bullish reversal candle appears with an expanded body on declining volume. These represent areas where buying pressure overcame selling pressure.
Resistance Zones (Red Lines): Form when a bearish reversal candle appears with an expanded body on declining volume. These represent areas where selling pressure overcame buying pressure.
▶ DYNAMIC LEVEL MANAGEMENT
The indicator continuously monitors each level and updates its status:
- Active Levels (Solid Lines): Levels that have not been broken by a closing price. These extend forward automatically as new bars form.
- Broken Levels (Dashed Lines): When price closes beyond a level, it converts to a dashed line. These broken levels remain visible for potential retest scenarios.
- Level Removal: Broken support levels are removed if price closes back above them. Broken resistance levels are removed if price closes back below them. This keeps the chart clean and focused on relevant levels.
▶ TRADING APPLICATIONS
Reversal Trading: Look for price approaching active support or resistance levels for potential bounce trades.
Breakout Confirmation: When a solid level converts to dashed, it confirms a breakout. The dashed level then becomes a potential retest zone.
Trend Analysis: Multiple support levels stacking below price suggests bullish structure. Multiple resistance levels above price suggests bearish structure.
Risk Management: Active levels provide logical areas for stop-loss placement just beyond the identified zones.
▶ WHY THIS COMBINATION WORKS
The three-filter approach (body expansion + direction change + volume decline) identifies exhaustion reversals rather than continuation patterns. Large body candles show conviction, direction change shows momentum shift, and lower volume suggests the prior move is losing steam rather than breaking out with strength.
▶ SETTINGS
This indicator uses fixed detection logic with no adjustable parameters to maintain consistency. The colors are preset: green for support zones and red for resistance zones.
▶ BEST PRACTICES
- Works on all timeframes but higher timeframes typically produce more reliable levels
- Combine with trend analysis for directional bias
- Not all levels will hold; use proper risk management
- More effective in ranging or mean-reverting conditions than strong trending markets
--------------------------------------------------------------------------------
TAGS (for TradingView)
--------------------------------------------------------------------------------
support, resistance, reversal, volume, candlestick, levels, zones, price-action
--------------------------------------------------------------------------------
CATEGORY
--------------------------------------------------------------------------------
Support and Resistance
====================================================================== Penunjuk

NQ Command Center [EOD Predictor]This is a sophisticated Macro-correlated Dashboard designed specifically for trading NQ (Nasdaq 100). It attempts to predict how the daily candle will close (Green or Red) by combining Price Action (Market Structure) with External Market Drivers (Yields, Volatility, Dollar, and Breadth).
How This Script Works
The script assigns a "Score" to current market conditions. The higher the score, the more bullish the prediction. The lower the score, the more bearish.
1. The "Structure" Score (Price Action) It looks at the Daily High/Low (PDH/PDL) and recent daily trend:
Bullish (+1): We are making Higher Highs/Higher Lows, or price is holding in the top 33% of yesterday's range.
Breakout (+2): Price has broken above the Previous Daily High (PDH).
Bearish (-1/-2): We are making Lower Highs, or price has broken below the Previous Daily Low (PDL).
2. The "Macro" Score (External Data) It pulls data from 5 external tickers to see if the environment supports a move:
ADDQ (Breadth): If > 0, more stocks are advancing than declining (Bullish).
VXN (Volatility): If falling, fear is decreasing (Bullish).
DXY (Dollar) & US10Y (Yields): If these are dropping, it is usually good for Tech/Nasdaq (Bullish).
CVD (Volume): Estimates if volume is dominated by buyers or sellers.
3. The Prediction (The Output) It sums these scores.
Total Score ≥ 4: "STRONG GREEN CLOSE 🚀" (High confidence Longs)
Total Score ≤ -4: "STRONG RED CLOSE 🩸" (High confidence Shorts)
Near 0: "CHOP / NEUTRAL" (Avoid trading or take quick scalps).
How to Use It Effectively
Symbol: Open a chart for NQ1! (Nasdaq Futures) or NDX.
Timeframe: This is designed for Intraday trading. Use 5m, 15m, or 1h charts. (Do not use on Daily chart, as the table lines up intraday data against daily history).
The Dashboard: Look at the table in the top right.
Focus on "AI Forecast": If it says STRONG GREEN, look for Long setups (pullbacks to support).
Check Confidence: If Confidence is "LOW", the macro data might be conflicting with price action (e.g., Price is going up, but Volume is selling). Be careful.
The Lines: The script plots Green (PDH) and Red (PDL) lines on your chart.
These are key reaction points. If price breaks the Green line, the "Live Status" on the dashboard will switch to BREAKOUT. Penunjuk

Penunjuk

Penunjuk

Penunjuk

Strategi