Engulfing Overlap Zone [8 Types]Engulfing Overlap Zone
This script looks for the moment control changes hands.
An engulfing pattern forms and commits one side of the market. Later that pattern breaks. On or
around the same candle, an engulfing pattern in the OPPOSITE direction confirms. When the two
structures occupy the same price area, that shared area is where one side was trapped and the
other took over. This script finds those moments and draws only that area.
Nothing else is plotted. Ordinary engulfing patterns, and engulfing patterns that simply failed,
are used internally but never drawn, because on their own they are not what this tool is about.
WHAT MAKES THIS DIFFERENT
1. It reports a transfer of control, not a pattern.
Most pattern tools mark every occurrence they find. This one requires a three step sequence to
complete before anything appears: a pattern forms, that pattern breaks, and an opposing pattern
confirms in the same price area. Any of the three missing means nothing is drawn.
2. The zone is measured, not just marked.
Two zones can touch by a hair or sit almost perfectly on top of each other. Those are very
different situations, so the script measures how much of the zone is actually shared and states
it as a percentage. You can then hide everything below a threshold you choose.
3. Everything is sorted into eight types.
The zone carries the identity of the engulfing pattern that took over, including whether that
pattern grabbed liquidity before it confirmed. Each of the eight can be shown or hidden
independently and has its own alert.
4. The hard part is the pairing.
When a pattern breaks there is often more than one opposing pattern nearby that could be its
counterpart. Picking the right one, and rejecting the ones that only look related, is what this
script is really about. The rule used is simple to state and is described below, but it is the
piece that decides whether the output is meaningful or noise.
THE PATTERNS INVOLVED
A candle is Green when close is greater than open, Red when close is less than open, and a Doji
when close equals open. A Doji is neither. Only fully closed candles are read, and the running
candle is never used.
Regular engulfing, two candles
R Buy EG: Red Base candle, and the very next candle is Green and closes above the Base High.
R Sell EG: Green Base candle, and the very next candle is Red and closes below the Base Low.
E-Regular engulfing, three or more candles
ER Buy EG: Red Base candle followed by a run of consecutive Green candles. The run must contain
at least 2 Green candles, and confirmation happens when one of them closes above the Base High.
A single Red candle before confirmation cancels the run. Doji candles are skipped: they neither
count toward the run nor break it.
ER Sell EG: the mirror image, with a Green Base and a run of at least 2 Red candles, one of
which closes below the Base Low.
If the very first candle after the Base already closes through it, that is by definition a
Regular pattern, so E-Regular requires the second candle or later to break the level. One Base
candle can never produce both.
Type 1, the same four patterns plus a liquidity sweep
Type 1 adds one requirement: before the close breaks through one side of the Base candle, price
must have traded through the opposite side.
T1 R Buy EG: the Confirm candle's Low reaches at or below the Base Low.
T1 R Sell EG: the Confirm candle's High reaches at or above the Base High.
T1 ER Buy EG: at least one Green candle of the run reaches at or below the Base Low.
T1 ER Sell EG: at least one Red candle of the run reaches at or above the Base High.
Any candle of the run can satisfy the sweep, including the Confirm candle itself. The sweep is
always measured against the Base candle, never against another candle in the run.
HOW AN OVERLAP ZONE IS BUILT
Step 1. A pattern confirms and is tracked from then on.
Step 2. The pattern breaks. A Buy Engulfing breaks when a Red candle CLOSES below its Base Low.
A Sell Engulfing breaks when a Green candle CLOSES above its Base High. A wick through the level
is not enough; the close has to settle beyond it.
Step 3. The script looks for an engulfing pattern in the opposite direction whose confirmation
lands on the breaking candle, or as close before it as possible, and whose zone shares both time
and price with the broken one. Where several candidates exist, the one closest to the break is
taken, because that is the one that actually represents the handover.
When all three steps line up, one zone is drawn: the price range of the Base candle of the
pattern that took over, running from that Base candle to its Confirm candle.
The eight resulting types are R Buy EG Overlap, R Sell EG Overlap, ER Buy EG Overlap, ER Sell EG
Overlap and the four Type 1 versions of the same. The type always describes the pattern that
took over, because that is the zone on your chart.
OVERLAP STRENGTH
Strength is the share of the drawn zone that sits inside the price range of the broken zone.
100 percent means the whole zone is shared, which is the tightest possible confluence. A small
number means the two structures barely reach each other. The figure is appended to each label,
and Minimum Overlap Strength lets you discard anything below a level you set. That threshold
applies to the chart, the summary table and the alerts together, so what you see and what you
are notified about never disagree.
READING THE CHART
Each zone is filled in two tones, and the split is the whole point:
- The part that shares price with the broken zone is drawn in the direction colour, green for a
Buy Overlap and red for a Sell Overlap, with a solid border. This is the confluence.
- Whatever is left over is drawn in neutral yellow with no border.
So the colour split you see is the strength figure, shown rather than stated. A zone that is
almost entirely green is strong. A zone with a thin green sliver and a large yellow body is
weak, and the percentage will say so.
Each zone carries a label with its type and strength, placed below a Buy Overlap and above a
Sell Overlap so it points at its own zone.
A summary table in the corner counts what was found in the current scan window, split by Buy and
Sell. Types you have switched off are still counted, so the table always reflects what the market
printed rather than what is currently on screen. Zones rejected by the strength threshold are not
counted, because that threshold decides what qualifies as a zone at all.
SETTINGS
Scan
- Scan Length: how many closed candles are scanned backwards. The running candle is always
excluded.
- Minimum Overlap Strength: the percentage a zone must reach to qualify.
Pattern Types
- An individual switch for each of the eight types.
Zone Style
- Separate colours for the shared area and the remaining area, on both the Buy and Sell side.
Labels
- Show Labels, Show Strength in Label, Label Size, and Label Distance from Zone as a percentage
of the zone height. Increase the distance on noisy charts so labels clear the candles.
Summary Table
- Show, position and size of the corner table.
ALERTS
Eight alert conditions are available, one per type:
R Buy EG Overlap, R Sell EG Overlap, T1 R Buy EG Overlap, T1 R Sell EG Overlap, ER Buy EG
Overlap, ER Sell EG Overlap, T1 ER Buy EG Overlap, T1 ER Sell EG Overlap.
An alert fires on the candle that completes the handover. Each message carries the type, the
symbol, the timeframe and the closing price. The same messages are also sent through the alert
function, so the "Any alert() function call" alert type can deliver every zone through a single
alert.
All alerts are evaluated only after a candle has fully closed.
If you read the source, note that the chart and the alerts are two separate paths. The chart is
rebuilt by scanning history backwards on the last bar, while the alerts keep a running list of
confirmed patterns and test each closed candle against it. Two paths are used because rescanning
the whole history on every bar would be far too slow, and a running list cannot redraw the past.
Both apply exactly the same rules and the same strength threshold, so they always agree.
REPAINTING
This script does not repaint.
- Detection reads confirmed candles only. The scan starts one bar behind the latest bar, so the
candle that is still forming is never part of any calculation.
- Every alert signal is written so that it can only become true once a candle has finished. Price
moving inside an open candle cannot make a signal appear and then disappear.
- Zones are rebuilt on the last bar from confirmed history. A drawn zone does not move, change
colour, change type or change its strength figure afterwards. It only leaves the chart when it
falls outside the Scan Length window.
When you create an alert, TradingView may show a caution banner saying the indicator can repaint.
That banner appears automatically for any script that uses the built in bar state variables, no
matter how they are used, because the platform cannot check the intent behind them. This script
uses them for the opposite purpose: one of them is what restricts every signal to bar close, and
the other is what redraws the zones efficiently on the final bar. Choosing "Once Per Bar Close"
when creating the alert is still recommended.
NOTES AND LIMITATIONS
- These zones are rare by design. Three separate conditions have to line up, so long stretches
with nothing on the chart are normal and expected. If you want to see more, lower the strength
threshold before raising the scan length.
- Scan Length is capped lower than in a plain pattern scanner. Every candidate pattern has to be
followed forward for a break and then matched against opposing patterns, which is far heavier
than simply detecting a pattern. The cap keeps the script responsive on slower machines.
- A zone whose Base candle falls outside the scan window will not appear even if the handover
itself was recent. If zones seem to be missing, raise the Scan Length before changing anything
else.
- For alerts the number of patterns tracked at once is capped and the oldest are released first.
In practice patterns break or age out long before this matters.
- Detection is purely structural. It reports where control changed hands and how much the two
structures shared. It does not rank zones beyond that, measure what happened afterwards, or
produce entries, targets or stops.
- Doji candles are treated as neutral by design. They never act as a Base candle and never break
an E-Regular run. On symbols and timeframes that print many Doji candles this makes runs
slightly more tolerant than a strict same colour rule would be.
HOW TO USE IT
A zone marks an area where one side committed, was proven wrong, and was immediately replaced by
the other side. Traders commonly watch these areas for reactions when price returns to them,
particularly the shared portion, since that is the part both structures agreed on.
The strength figure is there to let you be selective. Starting at zero shows everything so you
can see how the tool behaves on your symbol and timeframe, and raising it narrows the output to
the tighter confluences.
Type 1 zones are worth separating out. There the pattern that took over first grabbed liquidity
and only then confirmed, which is a different sequence from a clean takeover.
These are reference areas, not entry signals. Use them alongside higher timeframe structure, your
own support and resistance mapping, and proper risk management.
DISCLAIMER
This indicator is a pattern detection tool. It is not financial advice and it makes no claim
about profitability. Trading involves risk. Always apply your own analysis and risk management. Penunjuk

Engulfing Failed Zone [8 Types]Engulfing Failed Zone
Most engulfing tools show you where a pattern formed. This one shows you where it broke.
The script finds confirmed engulfing patterns and then keeps watching them. When price later
closes back through the far side of the pattern's Base candle, the pattern is invalidated and
the area it occupied is drawn as a failed zone, from the Base candle to the exact candle that
broke it.
A failed pattern is not noise. It marks a level where one side committed, was proven wrong,
and left an area behind that price often reacts to again.
WHAT MAKES THIS DIFFERENT
1. It tracks invalidation, not formation.
A normal engulfing indicator stops working the moment the pattern prints. This script treats
the pattern as an open structure and follows it forward until something breaks it. Only the
broken ones are drawn, so the chart shows failures rather than signals.
2. Failure is defined by the close, not by a wick.
A candle may spike through the Base candle and recover. That is not a failure here. The
breaking candle has to CLOSE beyond the level, and it has to be the correct color: a Red
candle closing below the Base Low breaks a Buy Engulfing, a Green candle closing above the
Base High breaks a Sell Engulfing.
3. Failed zones are sorted into eight types, not two.
The failure inherits the identity of the pattern that failed. A liquidity sweep engulfing that
fails is a different event from a plain two candle engulfing that fails, and the script keeps
them separate so you can study or filter them independently.
4. Only the first failure is drawn.
Once a pattern breaks, it is done. Later candles closing through the same level are not drawn
again, which keeps the chart readable instead of stacking boxes on one level.
THE PATTERNS BEING TRACKED
A candle is Green when close is greater than open, Red when close is less than open, and a
Doji when close equals open. A Doji is neither. Only fully closed candles are read, and the
running candle is never used.
Regular engulfing (2 candles)
R Buy EG
Red Base candle, and the very next candle is Green and closes above the Base candle's High.
R Sell EG
Green Base candle, and the very next candle is Red and closes below the Base candle's Low.
E-Regular engulfing (3 or more candles)
ER Buy EG
Red Base candle followed by a run of consecutive Green candles. The run must contain at least
2 Green candles, and confirmation happens when one of them closes above the Base candle's
High. A single Red candle appearing before confirmation cancels the run. Doji candles are
skipped: they neither count toward the run nor break it.
ER Sell EG
Green Base candle followed by a run of at least 2 consecutive Red candles, one of which closes
below the Base candle's Low. A single Green candle cancels the run. Doji candles are skipped.
If the very first candle after the Base already closes through it, that is by definition a
Regular pattern, so E-Regular requires the second candle or later to break the level. One Base
candle can therefore never produce both a Regular and an E-Regular pattern.
Type 1: the same four patterns plus a liquidity sweep
Type 1 adds one requirement. Before the close breaks through one side of the Base candle,
price must have traded through the opposite side.
T1 R Buy EG
An R Buy EG where the Confirm candle's Low is at or below the Base candle's Low.
T1 R Sell EG
An R Sell EG where the Confirm candle's High is at or above the Base candle's High.
T1 ER Buy EG
An ER Buy EG where at least one Green candle in the run has a Low at or below the Base
candle's Low. Any candle of the run qualifies, including the Confirm candle itself.
T1 ER Sell EG
An ER Sell EG where at least one Red candle in the run has a High at or above the Base
candle's High. Any candle of the run qualifies, including the Confirm candle itself.
The sweep is always measured against the Base candle, never against another candle in the run.
WHAT COUNTS AS A FAILURE
After a pattern confirms, the script scans forward one candle at a time.
A Buy Engulfing fails when a Red candle closes strictly below the Base candle's Low.
A Sell Engulfing fails when a Green candle closes strictly above the Base candle's High.
The scan begins on the candle after the Confirm candle, so a pattern is never judged by its
own confirmation. The first candle that meets the condition becomes the Failure candle, and
the zone is drawn from the Base candle across to it. Nothing is drawn for patterns that are
still intact.
That gives eight failed zone types in total: R Buy EG Failed, R Sell EG Failed, ER Buy EG
Failed, ER Sell EG Failed, and the four Type 1 versions of the same.
READING THE CHART
Each failed pattern draws a rectangle covering the Base candle's full High to Low range,
stretched horizontally from the Base candle to the candle that broke it.
Colors follow the OUTCOME, not the original direction. This is worth reading twice:
- A Buy Engulfing that failed is drawn in the bearish color. The buyers committed and lost, so
the area above is now resistance, and its label sits above the zone.
- A Sell Engulfing that failed is drawn in the bullish color. The sellers committed and lost,
so the area is now support, and its label sits below the zone.
In other words the zone is colored by who is in control after the failure, which is the
information you actually trade from.
The border tells you which pattern failed:
Solid border: a Regular pattern, confirmed by the very next candle
Dashed border: an E-Regular pattern, confirmation was delayed over several candles
Thin, softened border: a plain pattern, no sweep
Thick, crisp border: Type 1, a liquidity sweep occurred before confirmation
Type 1 zones are also filled more solidly, so the stronger patterns stand out when several
zones sit close together.
A separate line marks the broken edge of the Base candle: the Low for a failed Buy Engulfing,
the High for a failed Sell Engulfing. This shows at a glance which side of the pattern gave
way, and it is the level price most often returns to.
Each zone carries a label with its pattern tag, pointing at its own zone, so it is always
clear which label belongs to which rectangle.
A summary table in the corner counts how many of each type were found in the current scan
window, split into Buy EG and Sell EG columns. The counts include types that are currently
hidden, so the table always reflects what the market actually printed rather than what is
switched on.
SETTINGS
Scan
- Scan Length: how many closed candles are scanned backwards from the latest bar. The running
candle is always excluded.
Pattern Types
- An individual on and off switch for each of the eight failed zone types.
Zone Style
- Buy EG Failed Zone and Sell EG Failed Zone: the two zone colors. Defaults follow the outcome
logic described above.
- Zone Transparency: fill transparency of a plain Regular or E-Regular failed zone.
- Type 1 Extra Opacity: how much more solid Type 1 zones are filled compared to the value
above.
- Highlight Broken Edge, and its color: marks the side of the Base candle price closed
through.
Labels
- Show Labels, Label Size, and Label Distance from Zone as a percentage of the Base candle
height. Increase the distance on noisy charts so labels clear the candles.
Summary Table
- Show, position, and size of the corner table.
ALERTS
Eight alert conditions are available, one per failed zone type:
R Buy EG Failed, R Sell EG Failed, T1 R Buy EG Failed, T1 R Sell EG Failed, ER Buy EG Failed,
ER Sell EG Failed, T1 ER Buy EG Failed, T1 ER Sell EG Failed.
An alert fires on the candle that completes the failure. Each message carries the pattern tag,
the symbol, the timeframe and the closing price. The script also sends the same messages
through the alert function, so the "Any alert() function call" alert type can deliver every
failure through a single alert.
All alerts are evaluated only after a candle has fully closed.
Internally, every confirmed engulfing is held in a list and each closed candle is checked
against that list. This is what allows a failure to be reported the moment it happens, without
rescanning the whole history on every bar.
REPAINTING
This script does not repaint.
- Detection reads confirmed candles only. The scan starts one bar behind the latest bar, so
the candle that is still forming is never part of any calculation.
- Every alert signal is written so that it can only become true once a candle has finished.
Price moving inside an open candle cannot make a signal appear and then disappear.
- Zones are rebuilt on the last bar using confirmed history. A drawn zone does not move,
change color or change type afterwards. It only leaves the chart when it falls outside the
Scan Length window.
When you create an alert, TradingView may show a caution banner saying the indicator can
repaint. That banner appears automatically for any script that uses the built in bar state
variables, no matter how they are used, because the platform cannot check the intent behind
them. This script uses them for the opposite purpose: one of them is what restricts every
signal to bar close, and the other is what redraws the zones efficiently on the final bar.
Choosing "Once Per Bar Close" when creating the alert is still recommended.
NOTES AND LIMITATIONS
- Nothing is drawn for a pattern that has not failed. An empty chart means the engulfing
patterns in that window are all still intact, which is information in itself.
- Increasing Scan Length raises the number of drawing objects. TradingView caps these at 500
boxes, 500 labels and 500 lines, and the oldest objects are dropped once a cap is reached.
The default value is chosen to stay well inside those limits on normal charts.
- A very short Scan Length can hide zones whose Base candle sits outside the window even
though the failure is recent. If failures seem to be missing, raise the Scan Length.
- For alerts, the number of patterns tracked at once is capped, and the oldest are released
first. In practice patterns fail or age out long before this matters.
- Detection is purely structural. It reports where a pattern broke and nothing more. It does
not rank failures by quality, measure what happened afterwards, or produce entries, targets
or stops.
- Doji candles are treated as neutral by design. They never act as a Base candle and never
break an E-Regular run. On symbols and timeframes that print many Doji candles this makes
runs slightly more tolerant than a strict same color rule would be.
HOW TO USE IT
A failed engulfing zone marks a level where one side of the market committed and was proven
wrong. Traders commonly watch these areas for:
- Broken supply and demand zones that price returns to and respects from the other side
- Areas where a reversal attempt was flushed out before the move continued
- Momentum shifts, since a failed reversal often precedes a strong continuation
Type 1 failed zones are worth separating out. There the pattern first grabbed liquidity, then
confirmed, and then still failed, which is a different story from a clean pattern simply being
overrun.
These zones are reference areas, not entry signals on their own. Use them alongside higher
timeframe structure, your own support and resistance mapping, and proper risk management.
DISCLAIMER
This indicator is a pattern detection tool. It is not financial advice and it makes no claim
about profitability. Trading involves risk. Always apply your own analysis and risk management. Penunjuk

Engulfing Zone [8 Types]Engulfing Zone
A price action tool that scans closed candles for engulfing behavior and draws the exact zone
each pattern creates, from the candle that sets the level to the candle that breaks it.
Instead of treating "engulfing" as one generic signal, this script separates it into eight
distinct types and reports every pattern under exactly one of them, so what you see on the
chart is never double counted.
WHAT MAKES THIS DIFFERENT FROM A STANDARD ENGULFING INDICATOR
1. Engulfing is measured by the CLOSE, not by body overlap.
Most engulfing scripts check whether one candle's body covers the previous candle's body.
This script requires the Confirm candle to CLOSE beyond the Base candle's High or Low, wick
included. A candle that merely covers the body but closes back inside the Base range is not
accepted. This is a stricter definition and it filters out a large number of weak signals that
body based detection would report.
2. Confirmation is allowed to be delayed.
A classic engulfing pattern is strictly two candles. In real markets the reaction is often
spread over several candles: a base forms, price pushes in the opposite direction for a few
bars, and only then does a close break the base level. This script detects those extended
setups as their own category rather than ignoring them.
3. Liquidity sweeps are identified as a separate class.
Sometimes the candles that produce the engulf first trade through the far side of the Base
candle, taking out the stop orders resting there, and only then close through the opposite
side. That behavior is meaningfully different from a clean engulf, so it is detected and
labelled separately as Type 1.
THE EIGHT PATTERNS
Throughout, a candle is Green when close is greater than open, Red when close is less than
open, and a Doji when close equals open. A Doji is neither Green nor Red, and is handled
explicitly. Only fully closed candles are read. The running candle is never used.
Regular (2 candles)
R Buy EG
Base candle is Red
The very next candle is Green
That Green candle closes above the Base candle's High
R Sell EG
Base candle is Green
The very next candle is Red
That Red candle closes below the Base candle's Low
E-Regular (3 or more candles)
ER Buy EG
Base candle is Red
It is followed by a run of consecutive Green candles
The run must contain at least 2 Green candles
Confirmation happens when one of those Green candles closes above the Base candle's High
A single Red candle appearing before confirmation cancels the run entirely
Doji candles are skipped: they neither count toward the run nor break it
ER Sell EG
Base candle is Green
It is followed by a run of consecutive Red candles
The run must contain at least 2 Red candles
Confirmation happens when one of those Red candles closes below the Base candle's Low
A single Green candle appearing before confirmation cancels the run entirely
Doji candles are skipped
If the very first candle after the Base already closes through it, that is by definition a
Regular pattern, so E-Regular requires the second candle or later to be the one that breaks
the level. Regular and E-Regular can therefore never both fire from the same Base candle.
Type 1: the same four patterns plus a liquidity sweep
Type 1 adds one requirement on top of the rules above. Before the close breaks through one
side of the Base candle, price must have traded through the opposite side.
T1 R Buy EG
An R Buy EG where the Confirm candle's Low is at or below the Base candle's Low.
T1 R Sell EG
An R Sell EG where the Confirm candle's High is at or above the Base candle's High.
T1 ER Buy EG
An ER Buy EG where at least one Green candle in the run has a Low at or below the Base
candle's Low. Any candle of the run qualifies, including the Confirm candle itself.
T1 ER Sell EG
An ER Sell EG where at least one Red candle in the run has a High at or above the Base
candle's High. Any candle of the run qualifies, including the Confirm candle itself.
The sweep is always measured against the Base candle, never against another candle in the run.
HOW A PATTERN IS CLASSIFIED
Every detected pattern is reported once, under its strongest matching type.
A Regular pattern that also swept is reported as T1 R and is not additionally reported as R.
An E-Regular pattern that also swept is reported as T1 ER and is not additionally reported as
ER. This means:
One pattern produces exactly one zone on the chart, never two stacked on top of each other
The summary table counts each pattern once
Turning off a type hides only that type and never silently hides another
Because Type 1 is a stricter version of its plain counterpart, hiding the plain types and
keeping the Type 1 types visible is a straightforward way to see only the sweep driven setups.
READING THE CHART
Each detected pattern draws a rectangle covering the Base candle's full High to Low range,
stretched horizontally from the Base candle to the Confirm candle. The rectangle is styled so
that its type can be read without looking at the label:
Solid border: Regular, confirmed by the very next candle
Dashed border: E-Regular, confirmation was delayed over several candles
Thin, softened border: a plain pattern, no sweep
Thick, crisp border: Type 1, a liquidity sweep occurred
Type 1 zones are also filled more solidly than plain zones, so stronger patterns stand out
when several zones sit close together.
On a Type 1 zone, a dotted line marks the exact Base level that was raided before the break:
the Base Low on the Buy side, the Base High on the Sell side. This makes the liquidity grab
visible instead of leaving it implied.
Each zone carries a label showing its pattern tag. Labels point at their own zone, below and
pointing up for Buy patterns, above and pointing down for Sell patterns, so it is always clear
which label belongs to which rectangle.
A summary table in the corner shows how many of each type were found inside the current scan
window, split into Buy and Sell columns. The table counts every detected pattern, including
types that are currently hidden, so it always reflects what the market actually printed rather
than what is currently switched on.
SETTINGS
Scan
Scan Length: how many closed candles are scanned backwards from the latest bar.
The running candle is always excluded.
Pattern Types
An individual on and off switch for each of the eight types.
Zone Style
- Bullish Zone and Bearish Zone: the two base colors used for all Buy and all Sell zones.
- Zone Transparency: fill transparency of a plain Regular or E-Regular zone.
- Type 1 Extra Opacity: how much more solid Type 1 zones are filled compared to the value
above.
- Mark Swept Level: draw the dotted line on the raided Base level of Type 1 zones.
- Swept Level Color: color of that line.
Labels
- Show Labels, Label Size, and Label Distance from Zone as a percentage of the Base candle
height. Increase the distance on noisy charts so labels clear the candles.
Summary Table
- Show, position, and size of the corner table.
ALERTS
Eight alert conditions are available, one per pattern type:
R Buy EG, R Sell EG, T1 R Buy EG, T1 R Sell EG, ER Buy EG, ER Sell EG, T1 ER Buy EG,
T1 ER Sell EG.
Each message carries the pattern tag, the symbol, the timeframe and the closing price. The
script also sends the same messages through the alert function, so the "Any alert() function
call" alert type can be used to receive every pattern through a single alert.
All alerts are evaluated only after a candle has fully closed.
REPAINTING
This script does not repaint.
- Detection reads confirmed candles only. The zone scan starts one bar behind the latest bar,
so the candle that is still forming is never part of any calculation.
- Every alert signal is written so that it can only become true once a candle has finished.
Price moving inside an open candle cannot make a signal appear and then disappear.
- Zones are rebuilt on the last bar using confirmed history. A zone that has been drawn does
not move or change type afterwards. It only leaves the chart when it falls outside the Scan
Length window.
When you create an alert, TradingView may show a caution banner saying the indicator can
repaint. That banner appears automatically for any script that uses the built in bar state
variables, no matter how they are used, because the platform cannot check the intent behind
them. This script uses them for the opposite purpose: one of them is what restricts every
signal to bar close, and the other is what redraws the zones efficiently on the final bar.
Choosing "Once Per Bar Close" when creating the alert is still recommended.
NOTES AND LIMITATIONS
- The script draws on the last bar only. Increasing Scan Length raises the number of drawing
objects. TradingView caps these at 500 boxes, 500 labels and 500 lines, and the oldest
objects are dropped once a cap is reached. The default value is chosen to stay well inside
those limits on normal charts.
- Detection is purely structural. It reports where a pattern occurred and nothing more. It
does not rank patterns by quality, measure follow through, or produce entries, targets or
stops.
- Doji candles are treated as neutral by design. They never act as a Base candle and never
break an E-Regular run. On symbols and timeframes that print many Doji candles this makes
runs slightly more tolerant than a strict same color rule would be.
HOW TO USE IT
The zones mark where one side of the market decisively lost control of a level. They are
reference areas, not entry signals on their own. Common approaches are to watch how price
behaves when it returns to a zone, or to use zone direction as context alongside higher
timeframe structure, support and resistance levels, or trend direction.
Type 1 zones deserve particular attention, because the sweep tells you the move happened after
liquidity was taken rather than before.
DISCLAIMER
This indicator is a pattern detection tool. It is not financial advice and it makes no claim
about profitability. Trading involves risk. Always apply your own analysis and risk management. Penunjuk

Penunjuk

Price Action StrategyThe **Price Action Strategy** is a tool designed to capture potential market reversals by utilizing classic reversal candlestick patterns such as Hammer, Shooting Star, Doji, and Pin Bar near dinamic support and resistance levels.
***Note to moderators
- The moving average was removed from the strategy because it was not suitable for the strategy and not participating in the entry or exit criteria.
- The moving average length has been replaced/renamed by the support/resistance lenght.
- The bullish engulfing and bearish engulfing patterns were also removed because in practice they were not working as entry criteria, since the candle price invariably closes far from the support/resistance level even considering the sensitivity range. There was no change in the backtest results after removing these patterns.
### Key Elements of the Strategy
1. Support and Resistance Levels
- Support and resistance are pivotal price levels where the asset has previously struggled to move lower (support) or higher (resistance). These levels act as psychological barriers where buying interest (at support) or selling interest (at resistance) often increases, potentially causing price reversals.
- In this strategy, support is calculated as the lowest low and resistance as the highest high over a 16-period length. When the price nears these levels, it indicates possible zones for a reversal, and the strategy looks for specific candlestick patterns to confirm an entry.
2. Candlestick Patterns
- This strategy uses classic reversal patterns, including:
- **Hammer**: Indicates a buy signal, suggesting rejection of lower prices.
- **Shooting Star**: Suggests a sell signal, showing rejection of higher prices.
- **Doji**: Reflects indecision and potential reversal.
- **Pin Bar**: Represents price rejection with a long shadow, often signaling a reversal.
By combining these reversal patterns with the proximity to dinamic support or resistance levels, the strategy aims to capture potential reversal movements.
3. Sensitivity Level
- The sensitivity parameter adjusts the acceptable range (Default 0.018 = 1.8%) around support and resistance levels within which reversal patterns can trigger trades (i.e. the closing price of the candle must occur within the specified range defined by the sensitivity parameter). A higher sensitivity value expands this range, potentially leading to less accurate signals, as it may allow for more false positives.
4. Entry Criteria
- **Buy (Long)**: A Hammer, Doji, or Pin Bar pattern near support.
- **Sell (Short)**: A Shooting Star, Doji, or Pin Bar near resistance.
5. Exit criteria
- Take profit = 9.5%
- Stop loss = 16%
6. No Repainting
- The Price Action Strategy is not subject to repainting.
7. Position Sizing by Equity and risk management
- This strategy has a default configuration to operate with 35% of the equity. The stop loss is set to 16% from the entry price. This way, the strategy is putting at risk about 16% of 35% of equity, that is, around 5.6% of equity for each trade. The percentage of equity and stop loss can be adjusted by the user according to their risk management.
8. Backtest results
- This strategy was subjected to deep backtest and operations in replay mode on **1000000MOGUSDT.P**, with the inclusion of transaction fees at 0.12% and slipagge of 5 ticks, and the past results have shown consistent profitability. Past results are no guarantee of future results. The strategy's backtest results may even be due to overfitting with past data.
9. Chart Visualization
- Support and resistance levels are displayed as green (support) and red (resistance) lines.
- Only the candlestick pattern that generated the entry signal to triger the trade is identified and labeled on the chart. During the operation, the occurrence of new Doji, Pin Bar, Hammer and Shooting Star patterns will not be demonstrated on the chart, since the exit criteria are based on percentage take profit and stop loss.
Doji:
Pin Bar and Doji
Shooting Star and Doji
Hammer
10. Default settings
Chart timeframe: 20 min
Moving average lenght: 16
Sensitivity: 0.018
Stop loss (%): 16
Take Profit (%): 9.5
BYBIT:1000000MOGUSDT.P Strategi

Penunjuk

Penunjuk
Strategi

FOREX MASTER PATTERN Companion ToolWhat This Indicator Does
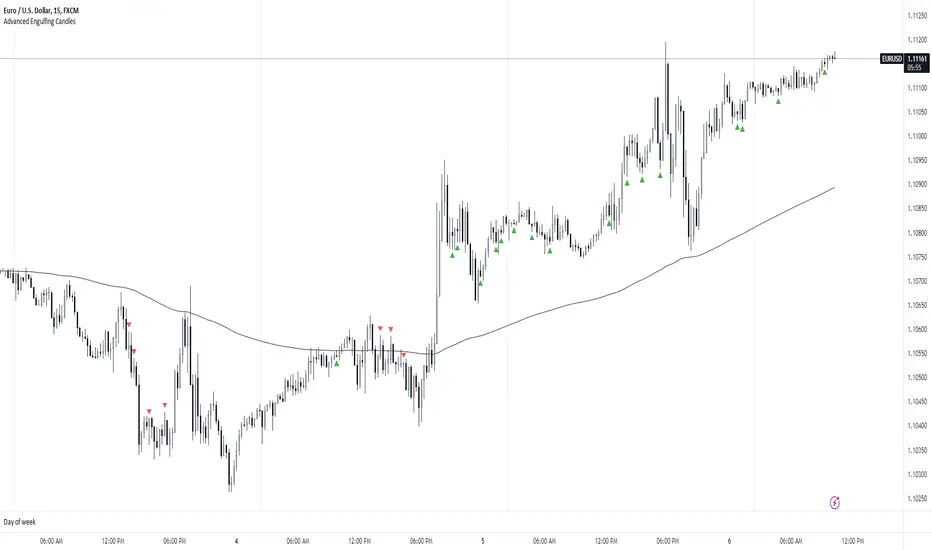
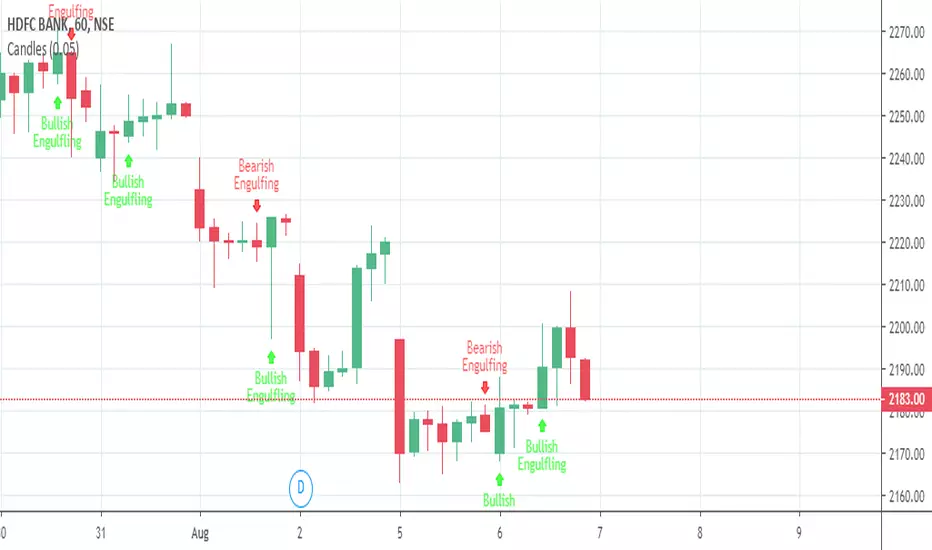
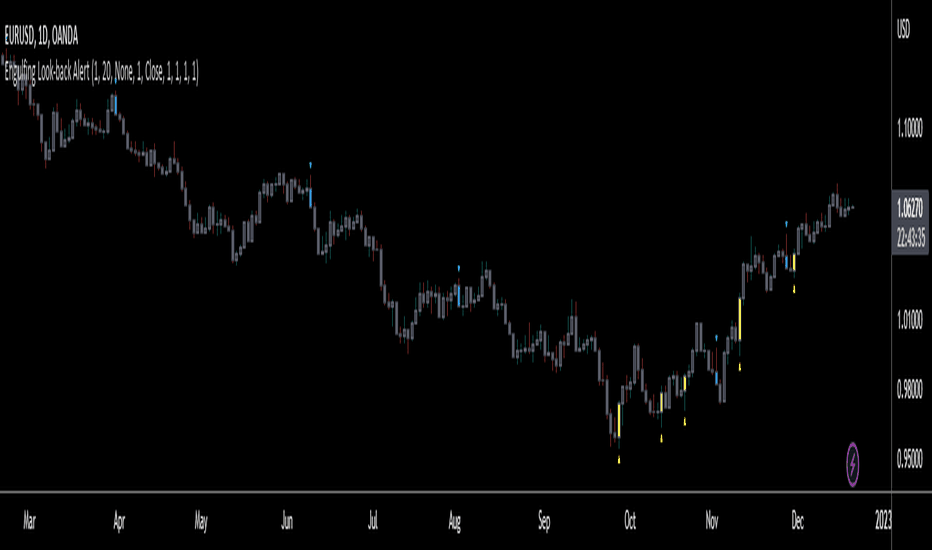
The Forex Master Pattern uses candlesticks, which provide more information than line, OHLC or area charts. For this reason, candlestick patterns are a useful tool for gauging price movements on all time frames. While there are many candlestick patterns, there is one which is particularly useful...
The Engulfing Pattern
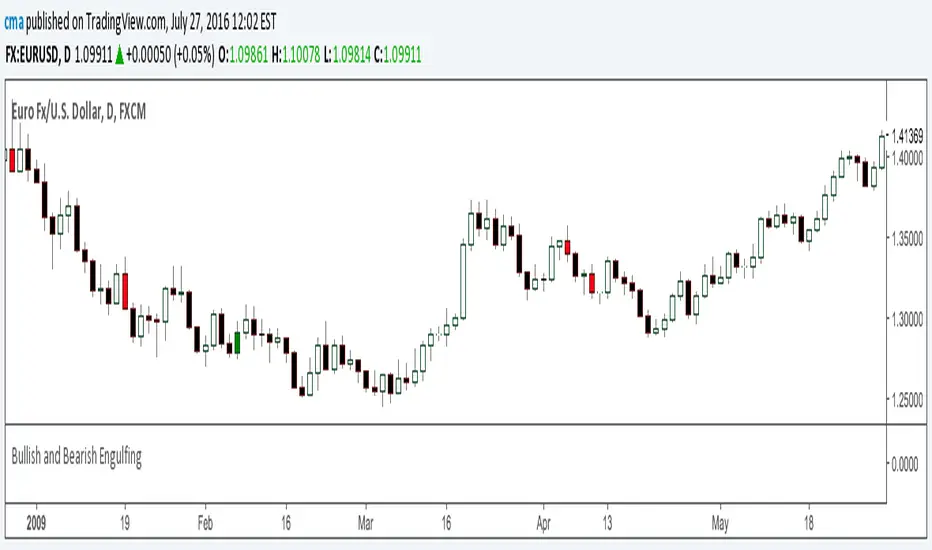
An engulfing pattern provides an excellent trading opportunity because it can be easily spotted and the price action indicates a strong and immediate change in direction. In a downtrend, an up candle real body will completely engulf the prior down candle real body (bullish engulfing). In an uptrend a down candle real body will completely engulf the prior up candle real body (bearish engulfing).
Used in conjunction with the FOREX Master Pattern value line, the Engulfing Pattern can assist the trader with reversal timing or trend confirmation during the expansion and trend phases.
As shown in the screenshot below. Engulfing Candles usually precede a sharp move in price in the direction of the engulfing candle.
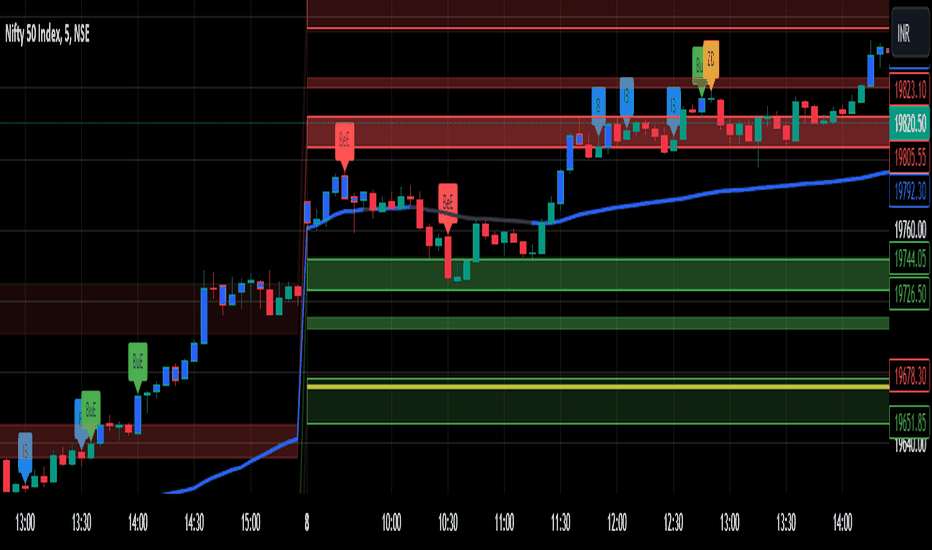
As shown in the screenshot below, when the Show Lines option is ON while using the indicator, both red and green lines are drawn on the chart automatically when engulfing candles form. These lines are projected forward 100 bars and tend to be reliable support and resistance areas. These areas are typically hidden from view.
In addition to the Show Lines option, the indicator (by default) creates boxes around trading zones that are created when an engulfing candle is formed. (There is an option to hide these from view if desired).
As seen in the screenshot below, these areas / zones are wider than a line and encompass a resistance / support zone rather than a specific price. Liquidity is usually high in these areas and a lot of selling / buying occurs here. These zones are drawn in advance out into the future giving the trader an idea of where price will revert to eventually.
A combination of LINES and AREAS can be used giving the user a better idea of where within the zone price will go.
As seen on the screenshot below, this combination provides a pretty accurate indication of the reversal point well in advance.
As seen in the screenshot below, when a ZONE / AREA has been fully breached (crossed) by price, the area is deactivated an no longer continues forward on the chart. Until price breaches an area, it remains valid and continues on the chart until and only if it is breached by price.
The Indicator is fully customizable.
The use can change the color of the engulfing candles, the color of the zones, transparency etc. You can turn OFF or ON any of the features such as lines, zones, bar coloring, and plotted arrows.
I really hope you get value from this indicator and... HAPPY TRADING!!
Penunjuk

Penunjuk
Penunjuk

Penunjuk

Penunjuk

Penunjuk
Penunjuk

Strategi

Strategi

Penunjuk

Penunjuk

Penunjuk