Fancy Triple Moving Averages [BigBitsIO]This script is for three moving averages with as many features as I can possibly fit into a single moving average.
Features:
- Three moving averages (MA1, MA2, MA3).
- Standard MA inputs.
- MA type.
- MA period.
- MA price.
- MA resolution (time frame).
- Visibility toggle.
- MA Candle Type
- Fancy MA inputs.
- Toggle to show only candles included in the MA calculation ("Highlight inclusion") or display entire MA history.
- Toggle to show a ghost trail when Highlight inclusion is toggled on.
Penunjuk dan strategi
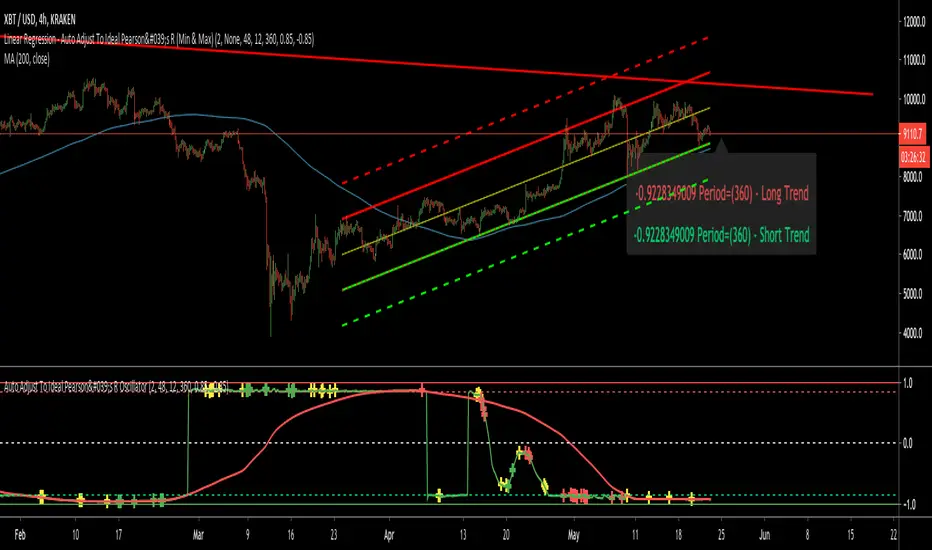
Auto Adjust To Ideal Pearson's R OscillatorThis is meant to be a partner indicator to "Linear Regression - Auto Adjust To Ideal Pearson's R (Min & Max)" which can be found under my profile on the scripts I have made.
It's important the the ideal Pearsons R + and - ideal ranges are the same as the other script so you can visualize the results better and what is going on. I set them to default to 0.85 for strong confidence levels.
This simply graphs what the Pearsons's R Long Term Trend (Red) and Short Term Trend (Green) are doing. I
Trend Following MAs 3DHello All,
This is Moving Averages Trend Following 3D indicator. The idea is based on direction of MAs and relation between 20 moving averages (5 to 100 period).
Option to show different type of MAs: EMA, SMA, RMA, WMA, VWMA.
As I haved tested it looks succesful at calculating trend direction and trend strength.
For a better look I tried to make it 3D, it looks good I think, waiting comments ;)
Some screenshots:
By using RMA type:
When it gets tiny it means there is no trend:
A
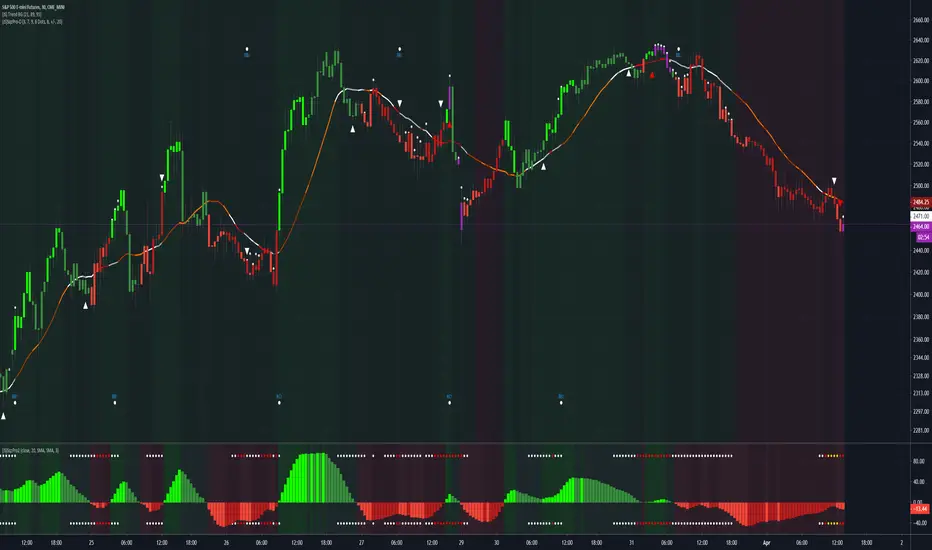
(JS) Squeeze Pro OverlaysSo this was something I planned on doing in the future, I knew it would take some time to put together but here it is, the Squeeze Pro 2 Overlays.
On my original Squeeze Pro, I had made several overlay indicators to go along with it, this time my goal was to combine all that stuff into a single indicator and allow the user to turn on and off the specific features they'd prefer to use. The version illustrated in the preview has everything turned on. What is "everything"? Here's the breakdown...
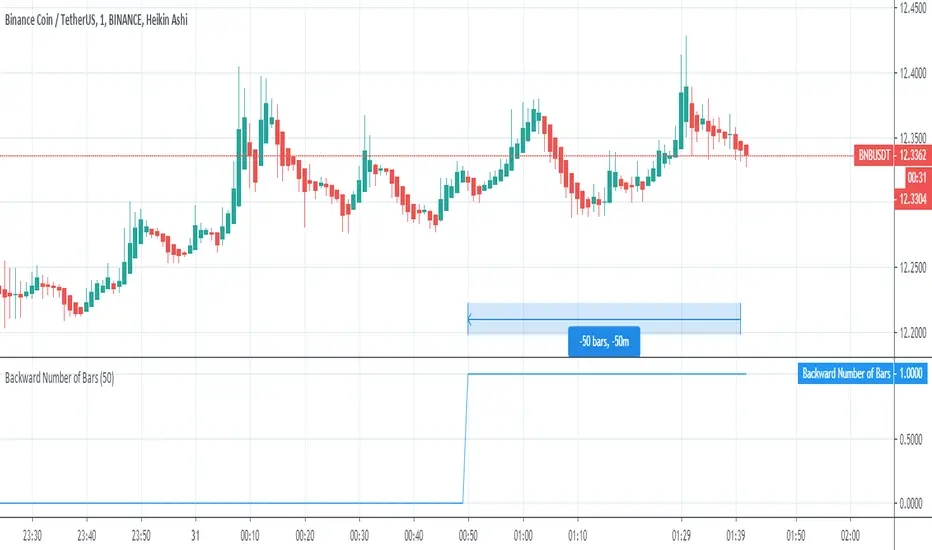
Backward Number of BarsThis indicator was written in order to apply bar limit in strategies and it was published as open code so that everyone can use it. When backtesting with stock market api data, we determine how many bars should be, not from which date the data will be drawn. For example, we can draw 1000 bar data from stock exchange and perform the backtest on this data. You can plan your strategy by checking the number of bars you test with the window () == 1 parameter here while checking through Tradingview to
Automatic TrendlinesIntroduction
For a full free tutorial explaining this code in more detail, visit the backtest-rookies (.com) website.
This indicator will plot two trend lines at any given time. A resistance trend line and a support trend line. The resistance trend is shown with red circles and is created by joining swing highs together. The second is a support trend which is created by joining swing lows.
Since we need swings to make the trend, the trend line code contains code for the swing detection. You
Trend Following Moving AveragesWhile analysing a chart, one of the biggest problem is to see if there is trend or not. While thinking about it, I found the idea to analyse moving averages in channel and their momentum according to channel width. I already published it as Trend Following Bar as you see at bottom of the chart.
How it Works?
On each bar it creates a channel by highest/lowest point of a MA. highest point is upper line and lowest point is lower line of the MA channel,
It gets highest and lowest point of last 30
Modified OBV w/ Divergence Detection by CryptorhythmsApirine OBV-M Modified OBV w/ MA Selection by Cryptorhythms
Intro
Released in the April 2020 issue of TASC, and created by Vitali Apirine.
Description
OBV-M is of course based on the classic indicator on balance volume originally developed by Joe Granville. Apirine then smooths the calculation and adds a signal line to help denote entry and exit points.
As the author points out uts also great at showing divergences!
Extras
As usual when porting indicators to the library here on tr
CME Equity Futures Price Limits
Breakers for CME's futures contracts. Should work on CST/EST/UTC charts.
CME says it uses the last 30 seconds of the session to grab a reference price, so I took the open of the last session's candle because it's easier.
Out of session breakers: +/-5%
Limit downs: -7%/-13%/-20%
There are some minor nuances for the later part of the NY session but I don't really care to add that in right now.
Options:
- Input a manual reference price to override the selected price for accuracy.
- Show only
Delta Volume Candles [LucF]█ OVERVIEW
This indicator plots on-chart volume delta information using candles that can replace your normal candles, tops and bottoms appended to normal candles, optional MAs of those tops and bottoms levels, a divergence channel and a chart background. The indicator calculates volume delta using intrabar analysis, meaning that it uses the lower timeframe bars constituting each chart bar.
█ CONCEPTS
Volume Delta
The volume delta concept divides a bar's volume in "up" and "down"
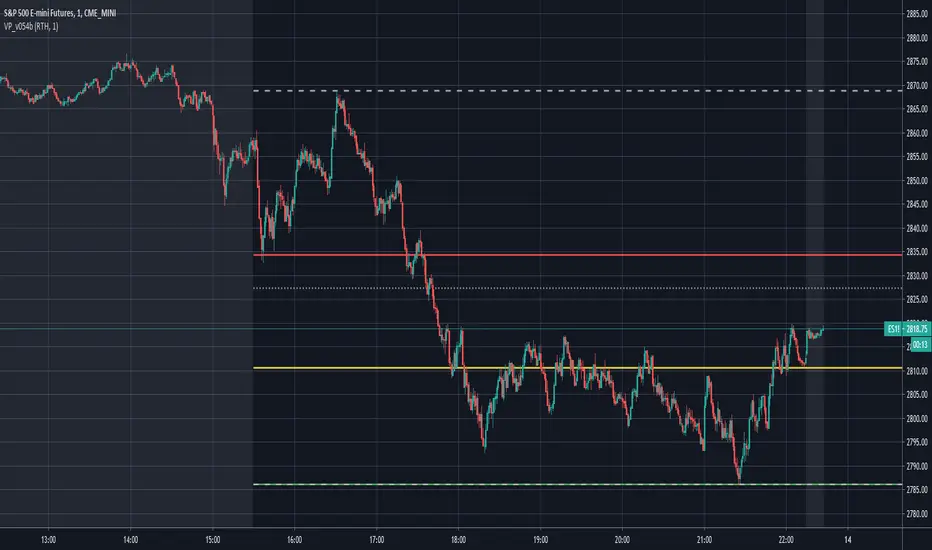
Volume Profile [Makit0]VOLUME PROFILE INDICATOR v0.5 beta
Volume Profile is suitable for day and swing trading on stock and futures markets, is a volume based indicator that gives you 6 key values for each session: POC, VAH, VAL, profile HIGH, LOW and MID levels. This project was born on the idea of plotting the RTH sessions Value Areas for /ES in an automated way, but you can select between 3 different sessions: RTH, GLOBEX and FULL sessions.
Some basic concepts:
- Volume Profile calculates the total volume for the
Vicious Mortgage Rates V1.0A script that contains real time mortgage rates from Wells Fargo using the QUANDL data link.
Use this lower indicator with US10Y or others on the top.
VIX will be added as well to help inform and predict.
List of Available Mortgage Interest Rates including APR or IR (Interest Rate)
*NOTE* : Not all indicators are up and running yet but will be very soon.
INDICATOR|CODE
Purchase Rate Conforming Loan 30-Year Fixed Rate Interest Rate|PR_CON_30YFIXED_IR
Purchase Rate Conforming L
Uhl MA Crossover SystemToday proposed indicator is based on the corrected moving average, an indicator originally proposed by Andreas Uhl professor at Salzburg University. This moving average is not the most well known, which is a pity since its design is extremely elegant.
The corrected moving average (CMA) is an adaptive moving average based on exponential averaging and aim to correct common problems of classical moving averages such as crosses occurring during sideway markets, more details will be introduced in th
VQZL Z-ScoreVolatility Qaulity Zero Line attempts to keep a trader out of ranging markets, but the original calculation on TradingView had to be adjusted for each instrument. To avoid this issue, I have applied a z-score calculation to the VQZL so the result is standardized for all instruments. A Z-Score is simply a value's relationship to the mean (average) of a group of values, measured in terms of standard deviations from the mean.
This calculation allows us to compare current volatility to the mean (m
RedK_Directional Index / K xDMIHere's a modern take on the famous DMI/ADX. i first wrote this on another platform few years ago, so i'm happy to be able to share it on TradingView
quick refresher: what does DMI/ADX tell us:
------------------------------------------------------
in simple terms, at the core of this indicator, there are 3 main calculations / lines: the Plus Directional Index ( +DI ) which represents how much the bulls are able to push the high of a bar compared to previous one, the Minus Directional Index ( -
Dekidaka-Ashi - Candles And Volume Teaming Up (Again)The introduction of candlestick methods for market price data visualization might be one of the most important events in the history of technical analysis, as it totally changed the way to see a trading chart. Candlestick charts are extremely efficient, as they allow the trader to visualize the opening, high, low and closing price (OHLC) each at the same time, something impossible with a traditional line chart. Candlesticks are also cleaner than bars charts and make a more efficient use of space
Reversal finderThis script is used to visually highlight candles which may signal a reversal following a false break of a support or resistance level.
Inputs are:
Lookback period: look for the highest high and the lowest low of the prior x bars.
SMA length: used for a simple moving average of the range (high minus low) of the prior x bars.
Range multiple: used to filter out signals for any bars with a range smaller than the average range of the preceding bars (determined by SMA length above) e.g. a rang
OBV Traffic LightsThe idea with On-balance volume (OBV) is to see price movement based on volume instead of the distance between the open and close of a candle. This can be used to find the relationship between volume and price action much easier than normal volume bars.
This version spices the OBV up a bit by basing it off of the current and previous close of the Heikin Ashi of the current bar, as well as adding "traffic light"
moving averages to the mix to get a better grasp of trends and when volume has shift
Earnings, Splits, DividendsExample of requesting Earnings, Splits, Dividends using pine-script.
That way is inner representation of data in TradingView, so it can be changed any time. It's just an example of requesting of the data.
Description of the series.
Earnings:
time: report date (unix time stamp)
open: estimate value
low: reported value
close: actual value
high: fiscal period (unix time stamp)
Splits:
time: split date (unix time stamp)
close: split denominator
open: split numerator
Dividends:
ti
SMU STDEV Candles This script creates a STDEV in a candle format so you can see the Change in a candle format and compare it with the actual price candle.
Is very similar to SMU RSI and SMU ROC. The interesting part is to see the full effect of traditional indicators in a candle format rather than a simple plot format. Very interesting view in SPX. There is a very big clue in the chart as STDEV changed since 2008. Can you figure it out?
Also, try this in lower time frame and you will be amazed how Algo kills