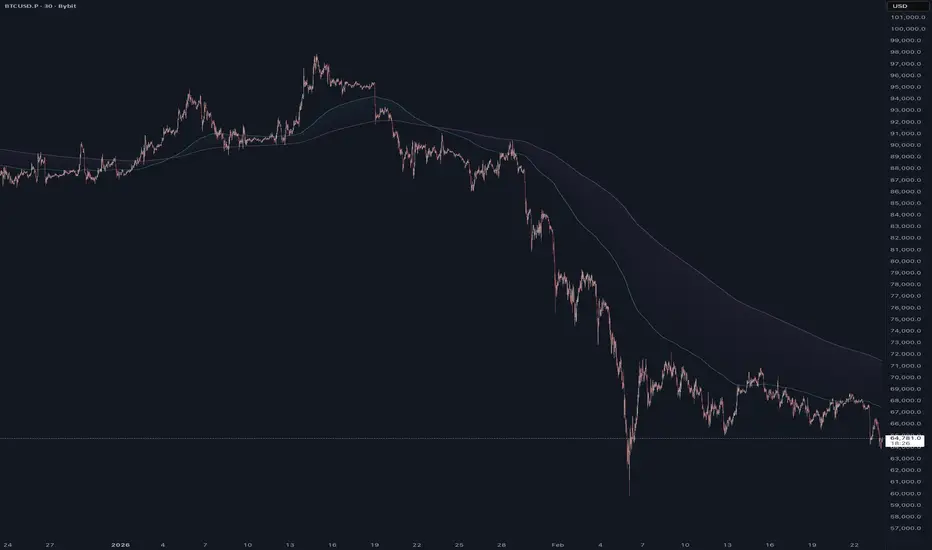
BoaBias: Multi-Timeframe EMA AnalysisWhat it does
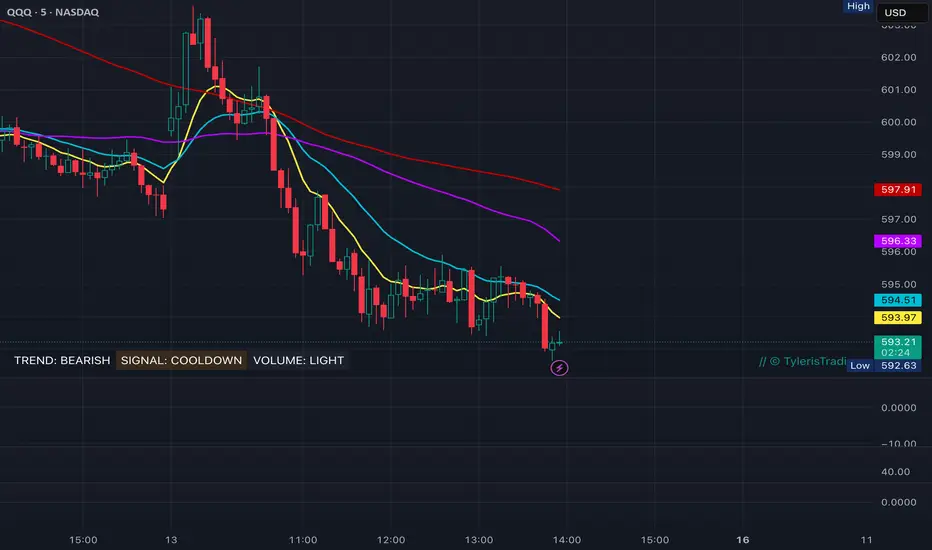
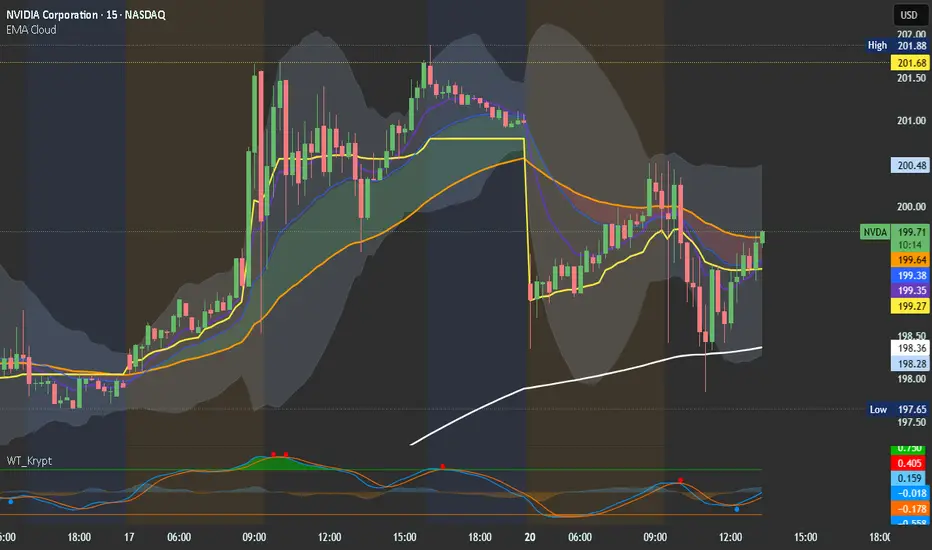
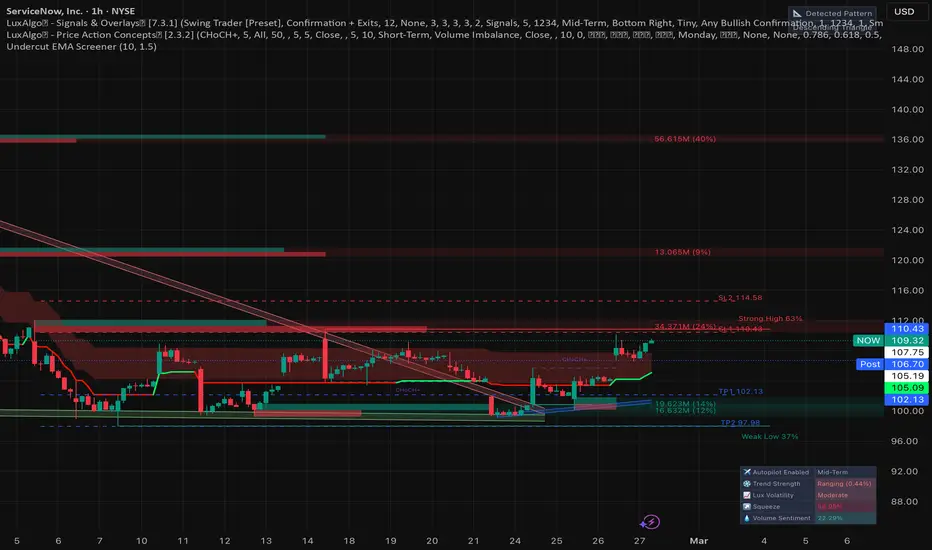
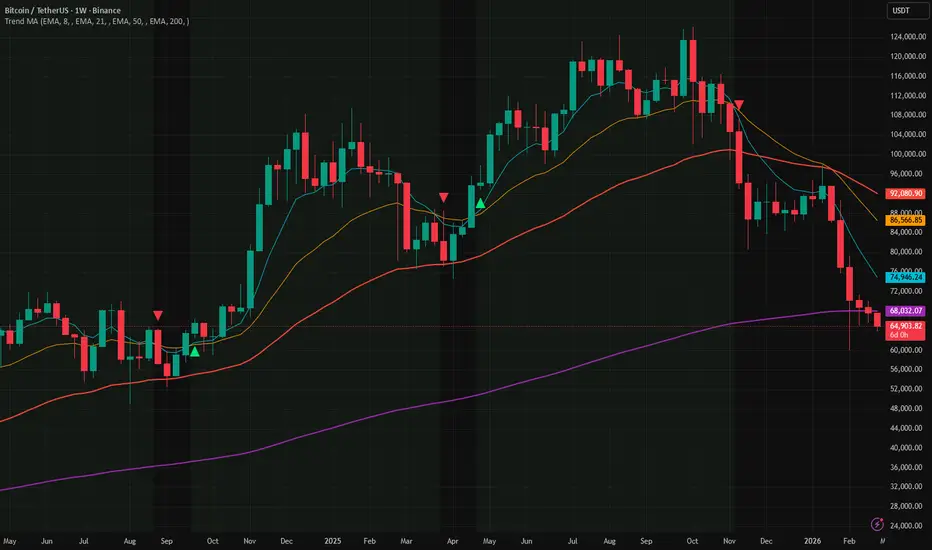
BoaBias: Multi-Timeframe EMA Analysis displays Exponential Moving Averages (EMAs) across six timeframes (15m, 1H, 4H, 1D, 3D, 1W) on a single chart and tracks session statistics: how long price stays above or below each EMA, average session lengths, and deviation from the EMA. It marks crossover and crossunder events with labels and projects estimated time to the next cross based on historical averages. Candles are colored by position relative to configurable slow and fast EMAs.
H
Penunjuk