Penunjuk

eXeTRADE Main Dual Score Signal Indicator# eXeTRADE-Main — Dual-Score Signal Indicator
**Trend • Support/Resistance • Higher-Timeframe • Backtest — all in one score**
---
## What it does
eXeTRADE-Main is a multi-factor signal indicator built for medium-to-experienced traders on **1H, 4H, and Daily** timeframes. It calculates **Long and Short scores independently** from five weighted layers — Trend, Support/Resistance, Momentum, Higher Timeframe, and Risk/Reward — and produces three signal grades:
- **Strong Buy / Sell** — score ≥ 90
- **Normal Buy / Sell** — score ≥ 75
- **Range Buy / Sell** — when R:R ≥ 3.0
The indicator is designed for **plan-driven, low-risk trading**. It auto-detects trend lines and parallel channels, ranks the top three S/R levels by strength, runs a weekly Best-MA backtest, and applies a **Proximity Gate** that penalises signals fired too close to a strong opposing level — the most common cause of immediate reversals.
## Key features
- Dual scoring — Long and Short calculated independently (0–100 scale)
- 14-MA + Best-MA weekly backtest (Trade / Long / Short / S/R averages auto-tuned)
- 3-layer trend line + parallel channel auto-detection with break tracking
- Pivot-based S/R with touch counting and violation tracking; top 3 selected by strength
- HTF context — EMA50/200, RSI, pivot, Ichimoku cloud, and volume folded into the score
- **Proximity Gate** — soft-block or hard-block when entry sits within 0.5×ATR of opposing S/R
- Built-in backtest engine with S/R trailing stop
- Position-management panel for manual entry / TP / SL tracking
- Single consolidated master alert (one alert covers every signal and trail event)
## How to read the chart
Numbered markers on the cover image:
1. **Score Panel** — current Long/Short scores with delta arrows, ATR, and trail status
2. **Top S/R Levels** — three strongest levels, ranked by point score
3. **Backtest Results** — trade count, win/loss, win rate, total P/L, max drawdown
4. **Buy Signal** — green triangle marks Strong / Normal / Range Buy entries
5. **Trail Exit** — yellow × marks where the trailing stop was hit
6. **Auto Trend Lines** — multi-layer trend with parallel channels
## Important settings
- **Backtest Period** — 1 Mo / 3 Mo / 6 Mo / 1 Yr / All
- **Entry Mode** — Single (one position) or Multi (pyramiding)
- **Signal Levels** — Strong (default 90) and Buy/Sell (default 75) thresholds
- **Proximity Gate Mode** — Off / Warning / Soft Block / Hard Block
- **HTF Auto-Bump** — automatically lifts the HTF reference one level if the chart TF matches HTF
## Alerts
A single **master alert** is recommended — it fires for every signal and trail event in one channel. Individual alerts (Strong Buy, Strong Sell, Trail Hit, Channel Break, etc.) are also available if granular control is preferred.
## Best on
4H and Daily timeframes for **Forex pairs, XAUUSD, XAGUSD, and major equities**. Not recommended below 1H — short-timeframe noise reduces score reliability.
## Disclaimer
This indicator is a decision-support tool, not financial advice. **Always define stop-loss and exit plan before entry.** Past performance does not guarantee future results. Trade at your own risk.
---
*Comments and feedback are welcome.*
Penunjuk

Penunjuk
Adaptive Fibonacci Trailing System [WillyAlgoTrader]🚀 Adaptive Fibonacci Trailing System (AFT) is a premium overlay toolkit that combines a regime-aware adaptive trailing stop, a dynamic Fibonacci premium/discount cloud, a 6-factor confidence grading engine, full SL/TP risk management with break-even logic, and a built-in backtest tracker — all in one indicator. Every signal arrives with a clear direction, a confidence grade (A+ / A / B / C), a recommended position size, and pre-placed stop-loss and three take-profit levels.
This is not a static trailing stop. This is not another Fibonacci retracement tool you have to draw by hand. This is a complete trade-management system that automatically detects market structure, classifies the current regime (Trending / Ranging / Volatile), adapts its stop placement to the conditions, scores every setup from 0 to 100%, and tracks every closed trade so you can see whether your settings actually work on your market.
🎯 WHO THIS IS FOR
— Trend traders who want a structural trailing stop that adapts to volatility instead of trailing a fixed percentage
— Swing traders who need clean Buy/Sell signals with pre-calculated SL, TP1, TP2, TP3
— Day traders and scalpers who need fast regime detection so they don't trade trend signals in a ranging market
— Discretionary traders who want a confidence score to filter low-quality setups
— Systematic traders who want JSON webhook alerts for automation
— Anyone tired of generic Fibonacci tools that ignore market context
— Traders who want a built-in backtest tracker to validate the system on their own market and timeframe
💎 WHY TRADERS CHOOSE THIS INDICATOR
✅ Adaptive trailing stop — not a fixed ATR multiple.
The trailing stop is anchored to Fibonacci levels of the most recent swing range and adjusts itself based on the detected regime. In trending markets it widens to let winners run. In ranging markets it tightens to exit fast. In volatile markets it sits at the midpoint. You don't choose a static distance — the indicator chooses the right distance for current conditions.
✅ Built-in market regime detection.
Every bar is classified as Trending , Ranging , or Volatile using ADX and a volatility ratio (current ATR vs. 50-bar average). Hysteresis is applied so the regime doesn't flicker on borderline values. You always know what kind of market you're in before you take the trade.
✅ Dynamic Fibonacci cloud.
A premium/discount zone is drawn live between the 0.382 and 0.618 levels of the current swing structure. The cloud re-anchors automatically every time the structure changes — no manual drawing, no stale levels from last week. Three visual styles available: Gradient, Solid, or Pulsing (brightens when price approaches the 0.5 inflection point).
✅ Two signal modes for two trader styles.
Trail Flip mode fires signals only when the adaptive trail flips direction — fewer signals, strong trend conviction. 0.5 Cross mode fires when price crosses the Fibonacci 0.5 (premium/discount inflection) with full triple-confirmation — earlier entries, more signals. The 0.5 Cross mode also has three strictness levels (Strict / Relaxed / None) so you can dial signal frequency to match your style.
✅ 6-factor confidence score on every signal.
Every Buy/Sell signal comes with a percentage score and a letter grade. Grades range from D (poor) to A+ (premium setup). The score combines structure strength, regime alignment, ADX strength, volume, volatility favorability, and Fibonacci/SMA50 confluence — weighted into a single number you can filter on. Set a minimum confidence threshold and weak signals are blocked automatically.
✅ Adaptive position sizing.
Set your base risk per trade once. The indicator scales it by signal grade: C grade gets 0.5× base, B grade 0.75×, A grade 1.0×, A+ grade 1.5×. You take small positions on average setups and larger positions on premium setups — automatically. Recommended risk % is shown live in the dashboard.
✅ Full risk management with one-click presets.
Choose Conservative, Balanced, Aggressive, Scalping, or Custom. Every Buy/Sell signal automatically draws Entry, SL, TP1, TP2, TP3 lines on the chart with price and percent-from-entry labels. Lines extend forward and update live until the trade closes.
✅ Break-even trail after TP1.
When TP1 is hit, the stop-loss automatically moves to entry. Your remaining position becomes risk-free. The original SL line dims to show it's no longer active, and the entry label updates to "→ SL (BE)" so you always know where the real stop is.
✅ Built-in backtest tracker — per-grade.
Every closed trade is tracked: total trades, wins, losses, win rate, average R, profit factor, total R. Then it's broken down by confidence grade so you can see whether A+ signals actually outperform B signals on your market. If they don't, you know to retune. The tracker auto-resets when you change critical inputs so old stats never pollute new tests.
✅ Triple-confirmation breakout filter.
Direction changes require body ratio + ATR-based penetration + regime gate. No more wick-based fakeouts triggering position flips. You can dial the strictness for both modes independently.
✅ Universal — works on every market and timeframe.
Forex, crypto, stocks, futures, indices. Scalping (1m, 5m), intraday (15m, 1h), swing (4h, 1D), position (1W). The structure engine adapts to whatever pivot length you set. Volume is auto-detected and gracefully ignored on FX where it's unreliable.
✅ Professional dashboard with full live state.
At a glance: Regime, ADX, Volatility ratio, Signal mode, Confidence + grade, Suggested risk %, Direction, Trail Stop price, Timeframe, full SL/TP/RR/Risk block, and a complete Backtest section with per-grade breakdown.
✅ Alerts in plain text or JSON for webhooks.
Buy / Sell / SL hit / TP1, TP2, TP3 hit / Break-even activated. JSON payload includes ticker, timeframe, price, SL, all three TPs, R:R, regime, mode, confidence, grade, and recommended risk % — ready to feed any automation pipeline.
🚀 HOW IT CHANGES YOUR WORKFLOW
Before: You draw Fibonacci retracements by hand on every swing. You guess where to place the stop — fixed ATR multiple, recent low, gut feel. You take signals in any market without checking if it's trending or ranging. You have no idea whether your "best" setups actually win more often. You miss break-even opportunities and watch winners turn into losers. You manage three TPs in your head and forget which one was already hit.
After: You add the indicator. The Fibonacci cloud is already drawn — re-anchored to the current swing automatically. The dashboard tells you the regime, the signal grade, and the recommended risk % before you click Buy. SL, TP1, TP2, TP3 are pre-placed and labeled with prices and percentages. When TP1 hits, your stop is moved to entry without you touching anything. Every closed trade is logged and broken down by grade. After 50 trades, you know exactly which signal mode and confidence threshold work on your market.
What used to take 5 minutes of manual setup per trade now takes 5 seconds — read the dashboard, decide.
📖 HOW TO USE
🎯 Quick start (for beginners):
1. Add the indicator to your chart (any market, any timeframe).
2. Look at the dashboard in the top-right corner. It tells you the regime (Trending / Ranging / Volatile), the current confidence score, and the suggested risk %.
3. Wait for a "▲ Long " or "▼ Short " label to appear under or above a candle. The grade letter (C, B, A, A+) tells you the quality of the signal.
4. The indicator automatically draws Entry, SL, TP1, TP2, TP3 lines on the right side of the chart with prices and percentages.
5. Place your trade with the suggested risk % from the dashboard. Use the SL and TP levels exactly as drawn.
6. When TP1 hits (line turns cyan with a ✓), your SL automatically moves to entry — your trade is now risk-free. Let it run to TP2 and TP3.
7. The Backtest panel at the bottom of the dashboard tracks every closed trade. Watch your stats grow.
👁️ Reading the chart:
— 🟢 Green "▲ Long " label = Buy signal with grade letter
— 🔴 Red "▼ Short " label = Sell signal with grade letter
— 🟡 The colored cloud between two Fib lines = the current premium/discount zone
— The middle dotted line (Fib 0.5) = the inflection between premium and discount
— Solid colored line that follows price = the adaptive trailing stop (green when long, red when short)
— Blue dotted line = your entry price
— Red solid line = your stop-loss
— Green dashed lines (3 of them) = TP1, TP2, TP3
— When a TP is hit, its line turns cyan and the label gets a ✓ check mark
— When break-even activates, the SL line dims and the entry label becomes amber with "→ SL (BE)"
📊 Dashboard fields:
— Regime : current market state (Trending, Ranging, Volatile)
— ADX : trend strength number
— Vol Ratio : how volatile the market is right now (1.0 = average)
— Signal : which signal mode is active and its strictness
— Confidence : the score and grade of the most recent / pending signal
— Sugg. Risk : the recommended position size as % of account
— Direction : current trail direction (Bullish / Bearish / Flat)
— Trail Stop : the live trailing stop price
— TF : your current timeframe
— SL / TP1 / TP2 / TP3 : active trade levels (BE @ price when break-even is on)
— R:R : risk-to-reward ratio at TP1
— Risk : distance from entry to SL as % of price
— Backtest section : Trades, Win Rate, Avg R, Profit Factor, Total R
— By Grade : same stats broken down by A+ / A / B / C / D
💡 Trading ideas:
— Trend-follower setup : Use Trail Flip mode + Conservative risk preset on 1H or 4H. Take only A and A+ signals. Let trades run to TP3.
— Premium/discount swing setup : Use 0.5 Cross + Strict + Balanced risk on 15m or 1H. The 0.5 cross catches reversals at the Fibonacci inflection point.
— Scalping setup : Use 0.5 Cross + Relaxed + Scalping preset on 1m or 5m. Lower the minimum confidence to 50%. Exit at TP1 or TP2.
— Confirmation overlay : Run AFT alongside your existing system. Only take your trades when AFT confidence shows B or higher in the same direction.
— Beginner-safe mode : Set minimum confidence to 75 (A grade or above). Use Conservative risk preset. Let break-even handle most management.
— Backtest-then-trade workflow : Toggle Reset Backtest, scroll the chart back, let the indicator collect 30+ trades, check the per-grade stats, then start trading the grades that perform best.
🔧 Tuning guide:
— Too many signals? Increase Min Confidence (try 60 or 75), or switch from "None" to "Strict" cross strictness, or use Trail Flip mode.
— Too few signals? Lower Min Confidence (try 40 or 50), or set strictness to "Relaxed" or "None".
— Stop too tight? Switch trailing mode from Aggressive to Balanced or Conservative, or pick the Conservative risk preset.
— Stop too wide? Switch to Aggressive trailing mode or Aggressive / Scalping risk preset.
— Whipsaw on ranging markets? Increase Breakout Confirmation to 0.3 or 0.5, raise Min Body Ratio to 0.6.
— Want only premium setups? Set Min Confidence to 90 (A+ only). Expect 1-3 signals per week on most markets.
⚙️ KEY FEATURES
🏛️ Structure Engine:
— Score-filtered swing detection (every swing is rated by ATR-normalized impulse and volume)
— Adjustable pivot length (3 to 50 bars)
— Memory of the last 5 swings for stable Fibonacci anchoring
— Optional swing labels showing the score number
📡 Market Regime Engine:
— ADX-based trend detection with adjustable threshold
— Volatility ratio (current ATR vs. 50-bar average) for volatile-state detection
— Hysteresis on both thresholds — no regime flicker
— Optional background highlight for 10 bars after each regime change
🎯 Trailing Stop Engine:
— 4 modes: Aggressive (tight), Balanced, Conservative (wide), Adaptive (auto-adjusts to regime)
— Volatility-inverse adjustment: tighter in low vol, wider in high vol
— Direction-locked update: longs only lift the stop, shorts only lower it
— Triple-confirmation breakout filter (body ratio + ATR penetration + regime gate)
🌀 Fibonacci Cloud:
— Auto-anchored to the latest valid swing high/low
— 3 visual styles: Gradient, Solid, Pulsing
— Optional confluence markers when a Fib level aligns with SMA50
— Toggleable Fib level lines (0.382 / 0.5 / 0.618)
🛡️ Risk Management:
— 5 presets: Conservative, Balanced, Aggressive, Scalping, Custom
— ATR-based stop sizing with adjustable multiplier
— Three take-profit levels with adjustable risk-multiples
— Break-even trail toggle (moves SL to entry on TP1 hit)
— Live SL/TP lines with price + percent-from-entry labels
— Position lock: new signals are blocked while a trade is active
🎓 Confidence & Sizing Engine:
— 6-factor scoring (structure / regime / ADX / volume / volatility / confluence)
— 5 grades: D / C / B / A / A+
— Minimum confidence filter (0–100%) blocks weak signals
— Adaptive position sizing toggle scales risk by grade
— Adjustable base risk % per trade
📈 Backtest Tracker:
— Tracks every closed trade (closed by SL or TP3)
— Win/loss outcome model with TP1/TP2/TP3 partial-success recognition
— Win rate, average R, profit factor, total R
— Per-grade breakdown (validate the confidence engine on your market)
— Auto-reset on critical input changes
🎨 Visual System:
— Auto / Dark / Light theme detection
— Configurable label and dashboard font sizes
— Compact Pro-style design — no chart clutter
— Optional WillyAlgoTrader watermark
🔔 Alert System:
— Buy / Sell signals with full payload
— SL Hit, TP1/TP2/TP3 Hit, Break-even Activated
— Plain text or JSON webhook format
— Bar-close confirmed (no repainting)
📊 Dashboard:
— 5 position options (corners + middle right)
— 3 font sizes
— Adapts to your visible feature set (collapses sections that aren't enabled)
⚠️ IMPORTANT NOTES
— 🚫 No repainting. All signals fire only on confirmed bar close. Pivots use equal left/right lookback (the swing point is in the past by N bars — this is delayed confirmation, not repainting). Alerts use alert.freq_once_per_bar_close.
— 📐 The trailing stop and Fibonacci anchors require at least two opposing swings in memory. Fresh charts and new symbols need a brief warm-up period (typically 50 bars).
— 📐 On markets with no reliable volume data (most FX pairs), the volume-confirmation factor is replaced by a neutral default. The indicator works fully on FX.
— ⚖️ The backtest tracker counts only confirmed closures (SL hit or TP3 hit). Partial profits at TP1/TP2 are recognized in the win/loss outcome but realize at the level reached when the trade ultimately closes. Real-trading slippage, spread, and fees are not modeled.
— ⚖️ The confidence score is a quantitative filter, not a prediction of profit. It reflects setup quality based on the inputs available — not future performance.
— 🛠️ This is an analysis and trade-management tool, not an automated trading bot. It detects structure, classifies regime, scores setups, places SL/TP levels, and tracks outcomes — trade decisions remain yours .
— 🌐 Universal compatibility — works on all markets (Forex, crypto, stocks, futures, indices) and all timeframes from 1m to 1M. Penunjuk

Adaptive Fibonacci Compass [JOAT]Adaptive Fibonacci Compass
Overview
Adaptive Fibonacci Compass is a dynamic, pivot-anchored Fibonacci retracement and extension system built in Pine Script v6. It continuously detects the most recent confirmed swing pivot pair, grades the pivot's ATR-normalised strength, checks for Break of Structure or Change of Character on the swing axis, then draws a live Fibonacci grid of seven standard levels (0, 0.236, 0.382, 0.5, 0.618, 0.786, 1.0) with fill-highlighted Optimal Trade Entry zones (OTE: 0.382–0.618 and 0.618–0.786) — all rendered at barstate.islast using the delete-before-create pattern for zero ghost-drawing artifacts.
Why Adaptive Fibonacci?
Static Fibonacci tools require manual anchor selection, which introduces subjectivity and results in different traders drawing the same move differently. Adaptive Fibonacci Compass removes this ambiguity by algorithmically detecting the pivot pair that defines the most recent significant swing and anchoring the grid there automatically. The grid updates whenever a new, stronger pivot forms — keeping the Fibonacci reference aligned with the current market structure without any manual intervention.
Pivot Detection and ATR Strength Grading
Swing pivots are detected using ta.pivothigh() and ta.pivotlow() with configurable left and right bar confirmation windows (default 10/10). When a new pivot forms, its ATR-normalised strength is computed:
Strength = (pivotHigh - pivotLow) / ATR(14)
This ratio grades the swing on a universal scale independent of price level or instrument. Pivots grading above a configurable minimum strength (default 1.5 ATR) are accepted as valid Fibonacci anchors. Smaller price structures that do not meet the threshold are ignored, preventing the grid from anchoring to noise.
BOS / CHoCH Detection on Pivot Axis
Each time a new pivot pair is accepted, the engine checks whether the new swing extreme exceeds the prior swing extreme of the same type:
- BOS Up: New swing high exceeds the previous swing high — structural expansion to the upside
- BOS Down: New swing low is below the previous swing low — structural expansion to the downside
- CHoCH: A swing extreme that forms against the prevailing structure — e.g., a new swing high forming when prior context was bearish
BOS and CHoCH labels are stamped at the pivot level to provide structural context for interpreting the Fibonacci grid.
Dynamic Fibonacci Grid (7 Levels)
The grid spans from the last confirmed swing low to the last confirmed swing high (for bullish pivots) or the reverse (for bearish pivots). Seven retracement levels are drawn as horizontal lines:
- 0.0 (swing origin) — white/neutral
- 0.236 — subtle grey
- 0.382 — teal (start of OTE zone)
- 0.5 — gold (midpoint)
- 0.618 — teal (end of deep OTE zone)
- 0.786 — purple
- 1.0 (swing extreme) — white/neutral
Each level label shows both the ratio and the exact price value.
Optimal Trade Entry (OTE) Fill Zones
Two fill zones are highlighted as semi-transparent boxes between specific Fibonacci levels, representing the confluence areas where institutional entries are statistically most concentrated:
- OTE 0.382–0.618: The standard OTE zone — the area of highest probability for pullback continuation trades
- OTE 0.618–0.786: The deep OTE zone — commonly used for higher-conviction reversal entries where the move has retraced deeply into the prior swing
Both zones are rendered with directional colour (teal for bullish swings, red for bearish swings) at 80–85% transparency.
Live Pivot Tracking and Grid Refresh
On every bar, the indicator tracks whether price is forming a new potential extreme beyond the current grid's anchor. When a new confirmed pivot qualifies (passes the ATR strength threshold), the previous grid is fully deleted (all lines, labels, and boxes) and rebuilt from the new anchor points. The delete-before-create pattern at barstate.islast ensures no duplicate or orphaned drawing objects accumulate over the session.
Inputs Reference
- Pivot Left Bars (10) — left confirmation bars for swing detection
- Pivot Right Bars (10) — right confirmation bars for swing detection
- Min ATR Strength (1.5) — minimum swing size in ATR units to accept as a valid anchor
- Show Fib Grid — toggles the full Fibonacci grid
- Show OTE Zones — toggles the 0.382–0.618 and 0.618–0.786 fill zones
- Show BOS / CHoCH Labels — toggles structural labels on pivot extremes
- Show Level Labels — toggles price and ratio annotations on each Fibonacci line
- Extend Lines (bars, default 30) — how far right the grid lines extend from the current bar
- Theme: Dark, Light, Auto
How to Use
1. Apply to any liquid market on any timeframe. The indicator needs at least (PivotLeft + PivotRight) * 3 bars to warm up.
2. The gold 0.5 level and teal 0.382/0.618 lines define the primary trade management area. In a confirmed uptrend, look for price to pull back into the OTE 0.382–0.618 zone with a bullish reaction for long entries.
3. The deep OTE 0.618–0.786 zone is valid for entries only in strong, high-momentum swings where the pullback is orderly and accompanied by decreasing volume.
4. Treat the 0.0 and 1.0 levels as structural extremes. A confirmed close beyond the 1.0 level triggers a new BOS and should cause the grid to reload on the next qualifying pivot.
5. Use BOS labels to confirm that the current Fibonacci swing direction aligns with the broader structural bias from a higher timeframe.
Non-Repainting Design
Pivots are only detected once the full right-bar confirmation period has elapsed. The grid is always anchored to confirmed historical pivots. No drawing is created based on the current in-progress bar. All grid refreshes occur at barstate.islast using confirmed pivot data.
Limitations
- The indicator anchors to the most recent qualifying pivot pair. In multi-week trends with no significant retracement, the grid may anchor to a very old pivot that is no longer contextually relevant.
- The minimum ATR strength filter helps but does not eliminate all noise pivots on highly volatile instruments. Increasing the threshold on crypto assets is recommended.
- Fibonacci levels are probabilistic reference zones, not guaranteed reversal or support/resistance levels. Confluence with other structure (OBs, PDH/PDL, volume profile POC) significantly increases their reliability.
- The grid does not account for higher-timeframe Fibonacci structures. Always check alignment with HTF pivots manually.
Disclaimer
This indicator is for educational and informational purposes only. Fibonacci retracements are historical price relationships and do not predict future market behaviour with certainty. Always use proper risk management and conduct your own analysis.
Made with passion by officialjackofalltrades
Penunjuk

Solstice Fibonacci Engine [JOAT]Solstice Fibonacci Engine
Introduction
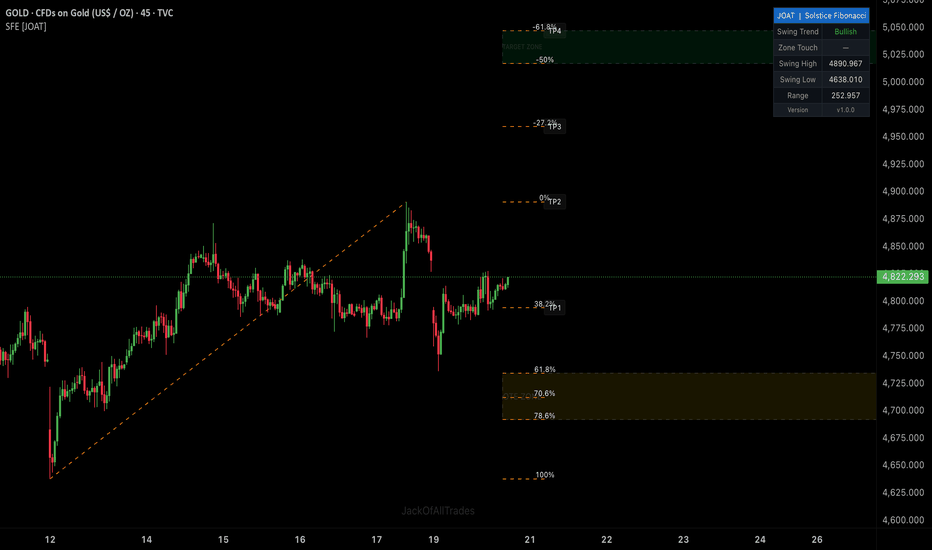
The Solstice Fibonacci Engine is a fully automatic Fibonacci retracement and extension tool built for traders who want institutional-grade price levels drawn on their chart without the tedium of manually dragging anchor points. It detects the dominant swing high and swing low within your currently visible chart range, recalculates every time you scroll or zoom, and renders the complete Fibonacci suite — retracements from 0% to 100% and extensions to -100% — in a single, clean overlay.
The engine is purpose-built around two price zones that institutional order flow traders treat as highest-probability areas: the OTE (Optimal Trade Entry) zone from 61.8% to 78.6% retracement, and the Target Zone from -50% to -61.8% extension. These zones are shaded and labeled automatically, with TP1 through TP4 labels placed at the key confluence levels that align with those areas, giving you a ready-made trade management framework the moment any new swing is established.
Core Concepts
Visible Range Swing Detection
Unlike most Fibonacci tools that require manual anchoring or use fixed lookback lengths, Solstice tracks the swing high and swing low within the portion of the chart you are actually looking at:
int visLeft = int(chart.left_visible_bar_time)
int visRight = int(chart.right_visible_bar_time)
bool isVis = time >= visLeft and time <= visRight
if isVis
if na(swHi) or high > swHi
swHi := high
swHiBar := bar_index
if na(swLo) or low < swLo
swLo := low
swLoBar := bar_index
When you scroll left or right the swing resets instantly to reflect your new visible window. This makes the tool behave like a dynamic Fibonacci that always measures the most contextually relevant move — the one you are actually analyzing.
Trend Direction from Swing Sequence
The engine determines whether price is in an uptrend or downtrend by comparing the bar index of the swing high against the bar index of the swing low:
bool trendUp = nz(swLoBar, 0) < nz(swHiBar, 0)
If the swing low came first (left) and the swing high came after (right), price moved up — so retracement levels are drawn from the top down. If the swing high came first, price moved down and levels are drawn from the bottom up. This single boolean drives whether TP1–TP4 labels are placed above or below current price.
OTE Zone — 61.8% to 78.6%
The Optimal Trade Entry zone marks the golden pocket of Fibonacci retracement theory. Price returning into this band after a clean impulsive move often finds the institutional order flow that originally created the swing:
if showOTE
fibZone(color.new(oteClr, 90), 61.8, 78.6, trendUp,
bar_index - 2, lx, swHi, swLo, "OTE ZONE")
The zone is rendered as a shaded box extending to the right of the last visible bar, keeping it visible as new bars form. An alert fires on bar close the first time price enters this zone after it was outside it.
Target Zone — -50% to -61.8% Extension
The Target Zone marks the take-profit extension area beyond the 0% level:
if showTgt
fibZone(color.new(tgtClr, 90), -50.0, -61.8, trendUp,
bar_index - 2, lx, swHi, swLo, "TARGET ZONE")
When price has retraced into the OTE and reversed, the -50% to -61.8% extension zone becomes the natural profit target objective — where the move typically exhausts before the next consolidation.
TP1–TP4 Trade Management Labels
Four take-profit labels are placed at the levels that define a complete trade management plan from entry to full profit-taking:
| Label | Level | Meaning |
|-------|-------|---------|
| TP1 | 38.2% | First objective — scalp or partial close |
| TP2 | 0% | Full return to the original swing point |
| TP3 | -27.2% | First extension beyond the swing |
| TP4 | -61.8% | Deep extension — full target zone |
Features
Auto swing detection from visible chart range — no manual anchoring required
Dynamic recalculation on every chart scroll or zoom
Full Fibonacci suite: 0%, 23.6%, 38.2%, 50%, 61.8%, 70.6%, 78.6%, 100%, -27.2%, -50%, -61.8%, -100%, 150%, 200%
Per-level toggle switches — show only the levels you want
OTE Zone (61.8%–78.6%) shaded box with right-extension
Target Zone (-50% to -61.8%) shaded box with right-extension
TP1–TP4 labels with optional percentage labels on every level
Optional swing diagonal line from anchor to anchor
Dashboard showing swing trend, zone touch status, swing high/low, and range
Auto dark/light theme detection
Alerts fire on confirmed bar close when price enters OTE or Target Zone
Webhook JSON alert format for automation
Watermark
Input Parameters
Main Settings
Show All Elements — master toggle for all drawing objects
Show Swing Diagonal Line — draws a line connecting the two swing anchor points
Line Width — 1 to 5 pixels
Line Style — Solid, Dashed, or Dotted
Label Offset (bars) — how far to the right labels are placed beyond the last bar
Fibonacci Levels
Individual toggles for each level: 0%, 23.6%, 38.2%, 50%, 61.8%, 70.6%, 78.6%, 100%, -27.2%, -50%, -61.8%, -100%, 150%, 200%
Zones and Targets
Show OTE Zone — toggles the 61.8%–78.6% shaded box
Show Target Zone — toggles the -50% to -61.8% shaded box
Show Zone Labels — text inside zone boxes
Show TP1–TP4 Labels — take-profit label markers
Show Level % Labels — percentage text on every drawn level line
Visual Settings
Theme — Auto (reads chart background), Dark, or Light
Show Dashboard — compact panel showing current swing readings
Dashboard Position — Top Left, Top Right, Bottom Left, Bottom Right
Show Watermark
Webhook JSON — switches alerts to machine-readable JSON format
Colors
Fib Lines — color for all retracement/extension level lines
OTE Zone — fill color for the OTE box
Target Zone — fill color for the Target Zone box
How to Use
Add the indicator to any chart on any timeframe — it automatically maps to your current visible range.
Zoom or scroll your chart to frame the impulsive swing you want to analyze. The Fibonacci grid recalculates to match.
Look for price to retrace into the OTE Zone (gold band between 61.8% and 78.6%). This is the institutional entry area.
When price reverses out of the OTE zone, monitor the TP1 label at 38.2% for partial profits, TP2 at 0% for full return to the swing origin, and TP3/TP4 in the Target Zone for extended runners.
Set the OTE Zone and Target Zone alerts to receive notifications when price enters either area on bar close.
Enable percentage labels if you need to confirm exact level values for manual entries.
Indicator Limitations
The swing is determined by the highest high and lowest low within the visible range only — it does not use a structural pivot detection algorithm. On heavily zoomed-out charts, the swing might span an unusually long period.
Fibonacci levels are mathematical retracements of the detected swing range. They are areas of interest, not guaranteed reversal zones. Always combine with your own confluence analysis.
The OTE and Target Zone alerts trigger only on the first bar close when price enters the zone from outside. If price exits and re-enters, a new alert fires.
Retracement drawing regenerates on every bar close at the last bar. On very high-resolution timeframes with large numbers of active objects, this can approach TradingView drawing limits.
Originality Statement
The Solstice Fibonacci Engine is an original Pine Script v6 implementation. Its use of chart.left_visible_bar_time and chart.right_visible_bar_time for dynamic visible-range swing detection is a novel approach that produces a self-adjusting Fibonacci tool with no manual intervention. The OTE and Target Zone framework, TP1–TP4 label system, and scroll-responsive recalculation are original design decisions made specifically for this publication.
Disclaimer
This indicator is for educational and informational purposes only. It does not constitute financial advice. Fibonacci levels are areas of potential price reaction, not certainties. Past Fibonacci confluence does not guarantee future performance. Always use proper risk management and consult a licensed financial professional before trading.
-Made with passion by jackofalltrades
Penunjuk
Take Profit Planner [AGPro Series]Take Profit Planner
🎯 **Overview**
**Take Profit Planner ** is a precision exit-planning tool that transforms trade management from guesswork into a structured process. It builds a disciplined profit ladder around any trade idea — whether you are a scalper managing rapid exits or a swing trader stepping out of positions over days — and keeps the entire plan on one chart with live progress tracking.
Most traders agonize over entries and leave exits to improvisation. This tool flips that habit: define your anchor, choose your calculation style, and the script projects a complete multi-tier exit map with stop loss, position-sizing allocation, confluence scoring, and real-time hit tracking.
🪜 **What Makes It Different**
Unlike conventional take-profit indicators that plot a single ATR-based target or fixed R:R pair, this tool offers a **multi-layer exit architecture**:
▫️ **Three Calculation Modes** — Fibonacci Extensions, R-Multiples, or Hybrid Confluence in a single tool
▫️ **Three Anchor Sources** — Manual price inputs, auto pivot detection, or recent S/R zone anchoring
▫️ **Confluence Scoring** — In Hybrid mode, every target receives a ★ / ★★ / ★★★ rating based on how many independent level types (Fib, round number, pivot S/R) cluster at that price
▫️ **Position-Sizing Layer** — Allocate a custom percentage of your position to close at each tier, with automatic weighted P&L calculation
▫️ **Live Progress Tracking** — Visual hit confirmation (✓), realized vs expected profit, and a six-state status ladder: ACTIVE → PROGRESSING → IN PROFIT → NEAR COMPLETE → ALL TPs HIT → STOPPED OUT
🧠 **Methodology**
▫️ **Anchor Detection** — The script identifies a trade's origin (Swing) and entry point using one of three methods. Auto Pivot uses a confirmable `pivothigh`/`pivotlow` with configurable length. Auto S/R uses the most recent swing extremes as structural anchor points. Manual lets you input exact prices.
▫️ **Direction Inference** — LONG or SHORT is determined automatically from the geometry: Entry above Swing → LONG, Entry below Swing → SHORT. No manual flag needed.
▫️ **Stop-Loss Logic** — Three modes: ATR Multiple (volatility-adaptive), Swing Point (structural), or Fixed Percent (disciplined). In Manual anchor mode, you set the stop directly.
▫️ **Target Projection** — Fibonacci mode projects targets from the Anchor→Swing leg using standard extensions (1.272, 1.414, 1.618, 2.000, 2.618). R-Multiple mode multiplies the stop distance by risk factors (1R, 2R, 3R, 5R, 8R). Hybrid uses Fibonacci as base and scores confluence.
▫️ **Confluence Algorithm** — For each Fibonacci target, the script checks proximity to: (1) the nearest psychological round number within 0.15 ATR, (2) the most recent pivot high within 0.2 ATR, (3) the most recent pivot low within 0.2 ATR. Each alignment adds one point to the base Fibonacci score.
▫️ **Hit Detection** — On every confirmed bar, the script checks whether price crossed each un-hit target. Hits are persistent until the anchor changes by more than 1 ATR, at which point the plan resets.
🔔 **Signals & Alerts**
▫️ **TP Hit** — Fires once per bar when price touches a specific target. Alert message includes tier number, price, and direction.
▫️ **SL Hit** — Fires once when stop-loss is breached.
▫️ **All TPs Reached** — Fires once when the full ladder is completed.
All alerts are non-repainting and trigger only on confirmed bars.
🎛️ **Key Inputs**
▫️ **Calculation Mode** — Fibonacci Extensions, R-Multiples, or Hybrid Confluence
▫️ **Anchor Source** — Manual Price, Auto Pivot High/Low, or Auto Recent S/R
▫️ **Pivot Length** — Bars of confirmation for automatic pivot detection (default 10)
▫️ **Stop-Loss Mode** — ATR Multiple, Swing Point, or Fixed Percent
▫️ **Number of TP Tiers** — 2 to 7 (default 5)
▫️ **Fibonacci / R-Multiple Levels** — Fully customizable per tier
▫️ **Allocation %** — Position-sizing percentage per tier
▫️ **Zone Half-Width (ATR)** — Vertical thickness of target zones in ATR units
▫️ **Panel Location & Theme** — Six positions, Dark or Light theme
▫️ **Label & Panel Font Size** — Tiny, Small, Normal, Large
💡 **How to Use**
▫️ **Scalper Workflow (Fast Exits)** — Set Calculation Mode to R-Multiples, tier count to 3, allocations to 50 / 30 / 20. Use Auto Pivot with pivot length 5–8 on lower timeframes. Exit weighted-partials at each R-level.
▫️ **Swing Trader Workflow (Multi-Day Holds)** — Set Calculation Mode to Hybrid Confluence, tier count to 5, allocations to 20 / 20 / 25 / 20 / 15. Use Auto Pivot with length 10–15 on 4H or daily. Prioritize exits at ★★★ confluence targets.
▫️ **Discretionary Trader Workflow** — Set Anchor Source to Manual Price, enter your own Entry, Swing, and SL values. Choose Fibonacci mode for trend-based projections or Hybrid for confluence-weighted decisions.
▫️ **Position Management** — The Expected line in the panel shows total profit % if all active tiers are filled (weighted by allocation). The Realized line tracks booked profit as tiers fill. Use this to compare planned vs actual performance.
⚠️ **Limitations & Transparency**
▫️ This is a **planning and visualization tool**, not an entry signal generator. It assumes you already have a trade bias; it structures the exit.
▫️ **Auto-anchor modes** rely on confirmed pivots, which means the most recent plan updates a few bars after a fresh pivot forms. This is intentional to prevent repainting.
▫️ **Confluence scoring** is based on the current snapshot of pivot highs/lows and round numbers. As price moves and new pivots form, scores may change.
▫️ **Hit detection** uses bar highs/lows on confirmed candles only.
▫️ The tool does not know your actual fill prices, slippage, or spreads — expected and realized percentages assume exact execution at target prices.
🛡️ **Risk Disclosure**
Trading involves substantial risk of loss and is not suitable for every investor. The information provided by this indicator is for educational and informational purposes only and does not constitute financial advice, a trading recommendation, or a solicitation to buy or sell any asset. Past performance does not guarantee future results. Always perform your own analysis, define risk before entering any trade, and use proper position sizing. The author and AGProLabs accept no liability for trading decisions made using this tool.
🔓 **Open Source**
This script is published open-source under the Mozilla Public License 2.0. You are welcome to study the methodology, build on it, and contribute feedback. Penunjuk

Swing Fibonacci [BigBeluga]Swing Fibonacci is a high-precision geometric framework that merges traditional swing structure with parametric spiral projections. Unlike standard Fibonacci retracements that use static horizontal lines, this tool projects expanding harmonic spirals from major structural turning points to map out the "natural geometry" of the market.
By calculating the mathematical relationship between price volatility and time, the indicator identifies expansion shells where price is naturally inclined to react, stall, or reverse.
🔵 CONCEPTS
Macro Swing Detection: The engine utilizes a high-threshold lookback window (50–100 bars) to filter out market noise. It only identifies the most significant structural pivots, ensuring the spirals are anchored to "institutional" levels rather than minor retail fluctuations.
Anchor Points & Structural Mapping: At every confirmed trend reversal, the script anchors a ⦾ symbol. It then draws a solid "Swing Leg" connecting the current anchor to the previous one, providing a clear visual map of the market's structural transitions.
Parametric Fibonacci Spirals: The spirals are generated using a high-resolution 300-step parametric calculation. This ensures the curve remains perfectly smooth and mathematically accurate regardless of how many bars are on the screen.
Adaptive Price Normalization: To prevent the "squashed" look common in geometric tools, the spiral dynamically rescales itself based on the price range of the last 500 bars. This ensures the geometry stays proportional to current market volatility.
🔵 FEATURES
Institutional Data Dashboard: Located in the top-right corner, the dashboard provides real-time stats including the exact Anchor Price , the current Trend Status (BULLISH ▲ or BEARISH ▼), and the Swing % move from the low/high.
Real-Time Swing Tracking: A dynamic dashed line follows the current price, connecting it back to the active anchor point. This allows you to visualize the current "swing in progress" before it is finalized.
Parametric Control Suite:
• Radius: Adjusts the vertical "stretch" and overall size.
• Spiral Qty: Controls the number of rotations (up to 10) to project further into the future.
Color Flow Visualization: The spirals utilize a professional gradient transition from the bearish color (inner) to the bullish color (outer), visually representing the expansion of price energy.
🔵 HOW TO USE
Identify Reaction Zones: Price often treats the edges of the spiral curves as dynamic support and resistance. Look for "confluence" where a spiral curve intersects with a horizontal level or a previous swing point.
Forecasting Expansion:
• Bullish Spiral: Projects outward from a swing low, highlighting potential take-profit zones or areas where the trend might exhaust.
• Bearish Spiral: Projects from a swing high, identifying "expansion floors" for short positions.
Trend Confirmation: Use the Trend Squares at the bottom of the chart for a quick pulse on the current directional bias without cluttering the main price action.
Harmonic Timing: The spiral's horizontal reach provides a "time" component. If price reaches a specific spiral arc at a specific time, it often marks a high-probability turning point in the cycle.
🔵 CONCLUSION
Swing Fibonacci transforms abstract price action into a tangible geometric forecast. By anchoring dynamic, price-normalized spirals to the market’s strongest turning points, it provides a unique lens through which to view volatility, extension, and mean reversion.
Ideal for harmonic traders, swing analysts, and anyone looking for a deeper mathematical edge in their structural analysis. Penunjuk

Dynamic FibTrend Signals [MarkitTick]💡 This indicator represents an advanced multi-layered analytical framework designed to synchronize trend identification with structural market geometry. By integrating adaptive trend-following logic with automated price action mapping, the tool serves as a comprehensive dashboard for traders seeking to identify high-probability entry zones. It solves the common problem of "indicator clutter" by condensing volatility-adjusted trend direction, swing structure recognition, and Fibonacci retracement depth into a single, cohesive visual interface that provides real-time trade execution levels based on current market volatility.
● ✨ Originality and Utility
The primary utility of this script lies in its ability to bridge the gap between momentum-based trend following and static price levels. While many scripts focus on a single aspect of technical analysis, this indicator utilizes a synergistic approach:
It combines the volatility-sensitive nature of SuperTrend with the objective structural points of Pivot Highs and Lows.
It automates the projection of Fibonacci retracement levels based on a dynamic lookback period, ensuring that support and defense zones are always relevant to recent price action.
Unlike standard tools that leave the user to determine their own risk, this system automatically calculates a suggested entry, stop loss, and multiple target levels using Average True Range (ATR) to adjust for current market volatility.
● 🔬 Methodology and Concepts
The core engine operates on a tripartite logic system:
Trend Quantification: The system employs an Average True Range (ATR) calculation multiplied by a specific factor to create a dynamic band around the price. This determines the prevailing bias (Bullish or Bearish) and filters out market noise.
Structural Mapping: Through a pivot-point algorithm, the script identifies "Swing" levels. These are points where the market has shown significant rejection, helping to define the current trading range.
Risk Geometry: Upon a trend shift (signal), the script calculates trade levels. The Entry is based on the previous bar's close, while the Stop Loss and Profit Targets are mathematically derived from the ATR. This ensures that the risk-to-reward ratio remains consistent regardless of whether the market is in a high or low-volatility state.
● 🎨 Visual Guide
The chart interface is designed for high legibility, using distinct color coding and shapes to signify different market states:
SuperTrend Line: A continuous line that turns Green during bullish momentum and Red during bearish momentum. The area between this line and the price is filled with a subtle transparency to highlight the "trend cloud."
Signal Arrows: Bright green "BUY" arrows appear below the bars for bullish transitions, and red "SELL" arrows appear above the bars for bearish transitions.
Swing Markers: Small orange downward triangles mark Swing Highs, while blue upward triangles mark Swing Lows. These are accompanied by dashed horizontal lines projecting the price level forward.
Fibonacci Grid: A series of purple dotted horizontal lines representing key retracement levels (0%, 23.6%, 38.2%, 50%, 61.8%, 78.6%, 100%). These levels provide context for potential pullbacks within the main trend.
Trade Execution Box: When a signal is generated, a yellow entry box appears along with three distinct lines:
Yellow Line: The specific Entry price.
Green Dashed Line: The Target (Take Profit) level.
Red Dashed Line: The Stop Loss level.
Info Table: A professional-grade data table in the top-right corner summarizes the current trend status, the most recent swing levels, and the active trade coordinates for quick reference.
● 📖 How to Use
Trend Identification: Observe the color of the SuperTrend line. If the line is green and the price is above it, focus on long opportunities. If red, focus on shorts.
Confirmation: Look for signals where the SuperTrend flip aligns with a bounce off a Fibonacci level (specifically the 50% or 61.8% "Golden Pocket").
Execution: When a "BUY" or "SELL" arrow appears, refer to the yellow entry zone. The script projects these levels 40 bars into the future to allow for trade planning.
Exit Strategy: Use the target line for profit-taking and the red stop-loss line for capital protection. The 2:1 risk-to-reward ratio is the default, but this can be adjusted in the settings.
● ⚙️ Inputs and Settings
⚡ SuperTrend: Adjust the ATR Length and Factor. A higher factor makes the trend slower and more resilient to whipsaws, while a lower factor makes it more sensitive.
🔄 Swing High / Low: Define the lookback period for pivot detection. Increasing this value will only identify major market turns.
📐 Fibonacci Retracement: Change the lookback bars for the Fibonacci grid. This determines the "height" of the range being measured.
🎯 Trade Levels: Set your desired Risk-to-Reward ratio (default is 2.0). You can also toggle the visibility of the entry, target, and stop lines.
● 🔍 Deconstruction of the Underlying Scientific and Academic Framework
The indicator is built upon the "Volatility Clustering" theory, which suggests that market volatility is not constant but occurs in bursts. By using ATR-based thresholds, the indicator applies a statistical filter that expands and contracts based on realized variance. The swing detection logic utilizes a "Windowed Extrema" approach, which is a fundamental concept in time-series analysis for identifying local maxima and minima within a defined temporal window. Furthermore, the integration of Fibonacci ratios (specifically the 0.618 Golden Mean) incorporates elements of fractal geometry and Elliott Wave theory, positing that market corrections often move in proportions derived from the Fibonacci sequence. The final trade execution component utilizes a fixed-fractional risk management model, ensuring that trade parameters are mathematically optimized for the current market environment rather than being based on arbitrary price distances.
⚠️ Disclaimer
All provided scripts and indicators are strictly for educational exploration and must not be interpreted as financial advice or a recommendation to execute trades. I expressly disclaim all liability for any financial losses or damages that may result, directly or indirectly, from the reliance on or application of these tools. Market participation carries inherent risk where past performance never guarantees future returns, leaving all investment decisions and due diligence solely at your own discretion. Penunjuk

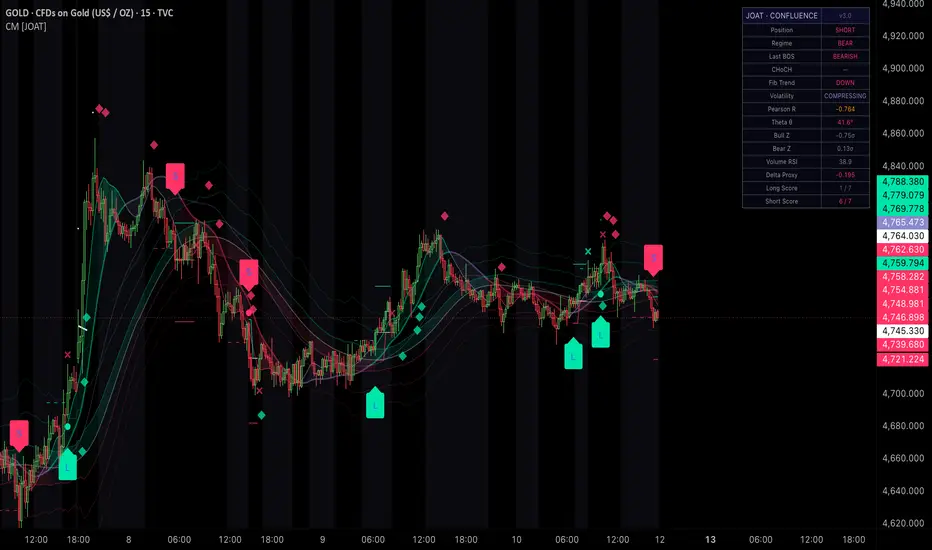
Confluence Matrix [JOAT]Confluence Matrix
Introduction
Every component in a professional trading system should serve a purpose, and ideally, no single component should bear the entire weight of decision-making alone. The best entries occur when multiple independent analytical methods all point in the same direction simultaneously — a confluence event that dramatically raises the probability that the observed setup reflects genuine market structure rather than random noise. The Confluence Matrix is built around this philosophy, integrating six distinct analytical modules into a single, cohesive overlay indicator with a unified seven-point scoring framework that gates every trade entry.
The six integrated modules are: HEMA regime analysis (three-layer Hull-EMA Hybrid with two-bar confirmation), Break of Structure and Change of Character market structure (swing pivot-based BOS and CHoCH detection), a triple-smoothed Fibonacci channel (0.618, 1.618, and 2.618 bands around a triple-EMA basis), an ATR compression detection engine (volatility squeeze state), Z-score cumulative impulse detection (statistically significant momentum streaks), and an OLS linear regression combined with cumulative delta proxy and volume RSI. Each module contributes one integer point to a directional score. Entries require a minimum score threshold — meaning price must be supported by a configurable number of simultaneously aligned modules before a position is opened.
Beyond signal generation, the indicator includes a simulated position tracking system that monitors open virtual positions with defined entry prices, take-profit levels, stop-loss levels, and a trailing stop mechanism. This system does not execute real trades — it visualizes what a rule-based system following the indicator's own signals would have done, providing an educational and contextual layer that helps users understand how the signals sequence in live trading conditions. All trade signals are confirmed-bar only, with no look-ahead repainting. The fifteen-row dashboard, ten alert conditions, and extensive visual customization options make this the most comprehensive single-overlay indicator in the JOAT suite.
Core Concepts
1. HEMA Three-Layer Regime with Two-Bar Confirmation
The HEMA (Hull-EMA Hybrid) forms the structural backbone of the regime assessment. Three independent HEMA instances at periods 20, 50, and 100 represent the fast, mid, and slow trend layers. Full bull regime requires ascending order of all three (fast above mid above slow). Full bear regime requires descending order. The two-bar confirmation state machine requires two consecutive bars of raw alignment before the confirmed regime variable updates — preventing rapid back-and-forth flipping on borderline crossovers.
f_hema(src, len) =>
ta.ema(2 * ta.ema(src, len / 2) - ta.ema(src, len), math.round(math.sqrt(len)))
hema1 = f_hema(close, 20)
hema2 = f_hema(close, 50)
hema3 = f_hema(close, 100)
rawBull = hema1 > hema2 and hema2 > hema3
rawBear = hema1 < hema2 and hema2 < hema3
confBull = rawBull and rawBull
confBear = rawBear and rawBear
The CHoCH (Change of Character) logic builds directly from this: a bullish BOS that occurs while confBear is true represents structural bullish momentum emerging from within a confirmed bear regime — the first evidence of potential regime reversal.
2. BOS and CHoCH with Visual Lines
Break of Structure detection uses ta.pivothigh and ta.pivotlow to track prior swing levels. BOS events draw labeled lines on the chart: teal/red for standard BOS continuation, violet-dashed for CHoCH. All line drawing uses line.new() with fixed coordinates on confirmed bars, and extends the right endpoint to the next BOS event for visual continuity across the chart.
chochUp = bosUp and confBear
chochDn = bosDn and confBull
lineStyle = (chochUp or chochDn) ? line.style_dashed : line.style_solid
lineColor = chochUp ? color.purple : bosUp ? color.teal : chochDn ? color.purple : color.red
3. Triple-Smoothed Fibonacci Channel
The Fibonacci channel applies the same triple-EMA smoothing used in the FVC indicator to produce a noise-resistant basis line, then projects Fibonacci-ratio bands (0.618, 1.618, 2.618) both above and below using ATR or standard deviation as the volatility measure. Within the Confluence Matrix, the channel serves a dual purpose: its own slope defines the "fib trend" score contribution, and its band levels serve as reference zones for proximity analysis.
basis = ta.ema(ta.ema(ta.ema(hlc3, basisLen), basisLen), basisLen)
fibTrend = basis > basis ? 1 : basis < basis ? -1 : 0
The 0.618 and 1.618 inner bands are filled with a gradient between basis and inner band, with the fill opacity tied to the confirmed regime — teal fills in bull regime, red fills in bear regime, gray in neutral.
4. ATR Squeeze Detection
The ATR squeeze module uses the same compression ratio logic as the VSO indicator: comparing a short-term EMA-smoothed ATR against a longer baseline to determine whether volatility is contracting or expanding. When volatility is contracting (squeezing), the squeeze score contribution is zero — the market is not yet expressing directional energy. When volatility is expanding, the module contributes to the appropriate directional score.
atrShort = ta.ema(ta.tr(true), sqzLen)
atrLong = ta.ema(atrShort, sqzLen * 2)
squeezing = atrLong > atrShort
sqzOK = not squeezing
5. Z-Score Cumulative Impulse
The Z-score impulse module tracks separate cumulative bull and bear momentum streaks, normalizes them against rolling sma/stdev, and marks statistically significant events with diamond markers (◆) plotted above and below the price bars. These markers are displayed at confirmed bars only. The Z-score values for both directions are shown in the dashboard and contribute one point each to the long and short scores when their respective thresholds are exceeded.
cumBull := close > close ? nz(cumBull ) + (close - close ) : 0
cumBear := close < close ? nz(cumBear ) + (close - close) : 0
zBull = (cumBull - ta.sma(cumBull, zLen)) / ta.stdev(cumBull, zLen)
zBear = (cumBear - ta.sma(cumBear, zLen)) / ta.stdev(cumBear, zLen)
6. OLS Regression, Delta Proxy, and Volume RSI
The sixth analytical layer combines three sub-components. The OLS linear regression (using the same manual implementation as the ARO indicator) provides the Pearson R correlation quality metric and theta angle, which together determine whether the regression score contributes. The cumulative delta proxy (bar-range-based buying/selling pressure estimate) determines the delta directional score. Volume RSI (RSI applied to volume series) provides the volume quality gate. All three sub-components are evaluated in the context of long or short scoring.
regressionScore = pearsonR > minR and math.abs(theta) > minTheta ? (theta > 0 ? 1 : -1) : 0
deltaScore = deltaPos ? 1 : -1
volumeScore = highVol ? (localBull ? 1 : -1) : 0
7. Seven-Point Confluence Scoring
Each of the six modules contributes one integer point to either the long score or the short score (some modules contribute to both). The seven scoring variables (ls1 through ls7 for long, ss1 through ss7 for short) are summed individually so each module's contribution is transparent and auditable. The minimum score threshold (default: 5 of 7) gates entry conditions.
ls1 = confBull ? 1 : 0 // HEMA regime
ls2 = lastBOSDir == 1 ? 1 : 0 // Last BOS direction
ls3 = fibTrend == 1 ? 1 : 0 // Fibonacci channel trend
ls4 = sqzOK ? 1 : 0 // Squeeze OK (not compressing)
ls5 = regressionScore == 1 ? 1 : 0 // Regression + Pearson
ls6 = deltaPos ? 1 : 0 // Delta proxy bullish
ls7 = highVol and localBull ? 1 : 0 // Volume RSI + local trend
longScore = ls1 + ls2 + ls3 + ls4 + ls5 + ls6 + ls7
8. Simulated Position Tracking with Trailing Stop
The position tracker uses persistent var variables to track open trade state. Entry occurs when a BOS trigger or HEMA crossover fires, the score meets the minimum threshold, the bar is confirmed, and no position is currently open in that direction. Stop-loss is set at ATR below the entry for longs (above for shorts). Take-profit is set at a multiple of ATR from entry. The trailing stop mechanism moves the SL to breakeven once the position has moved one ATR in the favorable direction — locking in capital protection once momentum is confirmed.
var int posDir = 0
var float openTP = na
var float openSL = na
var float entryPx = na
longEntry = (bosUp or hemaXover) and longScore >= minScore and barstate.isconfirmed and posDir <= 0
if longEntry
posDir := 1
entryPx := close
openTP := close + atr14 * tpMult
openSL := close - atr14 * slMult
// Trailing stop to breakeven
if posDir == 1 and high - entryPx > atr14
openSL := math.max(openSL, entryPx)
Exits occur on TP hit, SL hit, or confirmed regime flip opposing the position direction (confBear while long, confBull while short).
9. Proximity-Gradient Bar Coloring
Bar colors are driven by the distance between the current close and the HEMA mid layer (hema2), normalized by the range between the fast and slow HEMA layers. This produces a bar coloring scheme that reflects not just direction but the degree of extension relative to the HEMA structure's own internal spread — a more dynamically calibrated proximity measure than a fixed ATR reference.
hemaRange = math.abs(hema1 - hema3)
hemaDist = hemaRange > 0 ? math.abs(close - hema2) / hemaRange : 0
hemaProxAlpha = math.min(math.round(hemaDist * 60), 75)
Features
Six Integrated Modules: HEMA regime, BOS+CHoCH structure, Fibonacci channel, ATR squeeze, Z-score impulse, and OLS regression+delta+volume all active simultaneously.
Seven-Point Scoring System: Each module contributes one point to a transparent, auditable confluence score with configurable minimum threshold for entry.
Two-Bar HEMA Confirmation: Prevents false regime transitions on single-bar HEMA crossovers.
CHoCH Detection: BOS events opposing the confirmed regime are classified as Change of Character and drawn with violet dashed lines.
Z-Score Diamond Markers: Statistically significant momentum streak markers displayed as ◆ above and below bars on confirmed events.
Triple-Smoothed Fibonacci Channel: 0.618, 1.618, and 2.618 bands with regime-conditional gradient fills.
Simulated Position Tracking: Virtual positions with TP, SL, and trailing stop to breakeven — visualizing the signal system in action.
Proximity-Gradient Bar Coloring: HEMA-internal-range-normalized distance drives bar color alpha for structure-relative visual encoding.
BOS Lines: Teal/red for continuation BOS, violet dashed for CHoCH — drawn at confirmed bars with horizontal extensions.
Fifteen-Row Dashboard: Position direction, regime, last BOS, CHoCH state, fib trend, volatility, Pearson R, theta, bull Z, bear Z, volume RSI, delta proxy, long score, short score, and minimum score threshold.
Ten Alert Conditions: Long entry, short entry, long exit, short exit, CHoCH up, CHoCH down, bull impulse, bear impulse, BOS up, BOS down — all as constant string alerts.
Input Parameters
HEMA Settings:
Fast/Mid/Slow Lengths: HEMA layer periods (defaults: 20, 50, 100)
Structure Settings:
Swing Length: Pivot lookback for BOS/CHoCH detection (default: 10)
Fibonacci Channel Settings:
Basis Length: Triple-EMA period (default: 20)
Volatility Type: ATR or StDev (default: ATR)
Volatility Length: Period for volatility measure (default: 14)
Z-Score Settings:
Z Lookback: Rolling window for normalization (default: 50)
Z Threshold: Sigma level for impulse trigger (default: 2.0)
Regression Settings:
Regression Length: Bar count for OLS calculation (default: 50)
Min Pearson R: Minimum |R| for regression score contribution (default: 0.6)
Min Theta: Minimum angle for regression score contribution (default: 5)
Entry/Exit Settings:
Minimum Score: Points required for entry (default: 5)
TP Multiplier: ATR multiple for take-profit level (default: 2.0)
SL Multiplier: ATR multiple for stop-loss level (default: 1.0)
Display Settings:
Show HEMA Layers: Toggle individual HEMA line visibility (default: true)
Show Trend Cloud: Toggle HEMA gradient fill (default: true)
Show Fibonacci Channel: Toggle Fibonacci band fills (default: true)
Show BOS Lines: Toggle structural break lines (default: true)
Show Z Markers: Toggle diamond impulse markers (default: true)
Show Position Lines: Toggle TP/SL/entry lines (default: true)
Show Bar Colors: Toggle proximity gradient bar coloring (default: true)
Show Dashboard: Toggle the fifteen-row table (default: true)
How to Use This Indicator
Step 1: Read the Score Before Acting on Any Signal
The most important discipline when using the Confluence Matrix is to check the long score or short score before taking any action on a signal. A BOS up event alone carries one point; it does not guarantee a high-probability setup. A BOS up event accompanied by a score of 6 or 7 — meaning five or six other modules are simultaneously aligned — is a materially different situation. Begin each analysis session by reading the dashboard scores and understanding which modules are contributing and which are not.
Step 2: Use the CHoCH for Regime Change Awareness
CHoCH events are the most important structural signals in the indicator. A CHoCH up (bullish BOS during a confirmed bear regime) does not mean immediately go long — it means the structural assumption of the prior bear regime is being challenged. Wait for the regime confirmation to update, watch for the long score to rise as modules align with the new potential bull regime, and then consider entry on the next confirmed BOS in the bull direction backed by a high score. The sequence matters: CHoCH first, then regime confirmation, then high-score entry.
Step 3: Let the Simulated Position Tracker Teach Pattern Recognition
The position tracker lines (entry, TP, SL) on the chart are an educational tool. Over time, reviewing where simulated positions were opened and closed relative to the subsequent price action reveals patterns about which score thresholds, which module combinations, and which entry triggers produce the cleanest outcomes on the specific instrument you are analyzing. Use this visual feedback to calibrate your own minimum score setting and module weighting preferences.
Step 4: Manage Visual Complexity Through Selective Display
Six integrated modules produce a significant amount of simultaneous chart information. New users should start with all display elements enabled to understand the full system, then progressively toggle off elements they are not actively using for a given analysis. The dashboard always reflects the underlying calculations regardless of display settings — so even with Fibonacci fills and BOS lines hidden, the score, regime, and all module states remain visible in the dashboard.
Indicator Limitations
The simulated position tracking system is a visual and educational tool only. It does not place real orders, cannot account for slippage, spread, or commission costs, and its results should never be used as a basis for financial decisions. Simulated performance and real-world trading performance are categorically different.
The seven-module scoring system assigns equal weight to all contributing modules. In practice, some modules (e.g., HEMA regime) may carry more structural significance than others (e.g., volume RSI). The equal-weight assumption is a simplification.
Six integrated modules means six sets of parameters to configure. The default settings are calibrated for daily and 4-hour chart analysis on liquid instruments. Heavy optimization of all parameters to historical data risks overfitting — the resulting configuration may perform well on history but fail on new data.
The OLS regression component requires sufficient bars to produce stable Pearson R and theta values. In the first regression-length bars of any chart session, these values will be based on very short windows and should not be treated as reliable quality filters.
All modules operate on the chart's native timeframe. The indicator does not incorporate multi-timeframe analysis internally — users seeking MTF context should reference the MCG indicator in combination.
Proximity bar coloring uses the HEMA internal range (hema1 minus hema3) as the normalizer. When all three HEMA layers are closely clustered (flat, sideways market), this range approaches zero, which can cause division instability in the proximity calculation. A guard for this case is included but the coloring will be less informative during flat HEMA conditions.
The trailing stop to breakeven mechanism fires when the position has moved one ATR in the favorable direction. In very high-volatility conditions with large ATR values, this may mean the SL does not move to breakeven until the position is significantly extended, reducing capital protection in fast-moving markets.
Originality Statement
The Confluence Matrix is the most comprehensive indicator in the JOAT suite and represents an original architectural achievement in the design of multi-module overlay indicators.
The seven-point confluence scoring system — where six independent analytical modules each contribute a single integer vote, and entry is gated by a minimum aggregate threshold — is an original framework for combining heterogeneous technical signals into a unified, transparent decision criterion.
The combination of HEMA regime, BOS/CHoCH structure, Fibonacci channel, ATR squeeze, Z-score impulse, and OLS regression+delta+volume in a single non-repainting overlay indicator with no external indicator dependencies is an original integration not replicated by any single publicly available TradingView indicator.
The simulated position tracking system with trailing stop to breakeven — driven entirely by the indicator's own scoring and signal conditions, visualized directly on the chart — is an original self-contained feedback mechanism for understanding the system's real-time behavior.
The CHoCH classification (BOS event opposing the confirmed two-bar regime, not merely the raw regime) adds a confirmation layer to the standard CHoCH definition that reduces false change-of-character signals during borderline regime periods.
The proximity bar coloring normalized by the internal HEMA range (hema1 minus hema3) rather than by a fixed ATR reference creates a structure-relative alpha calculation that adapts to the current degree of HEMA layer separation — a more contextually aware coloring approach than fixed-reference alternatives.
The use of ten constant-string alert conditions (not dynamic or computed strings) ensures full compatibility with TradingView's alert system, including webhook delivery and multi-condition alert construction.
Disclaimer
The Confluence Matrix is provided for educational and informational purposes only. It is a technical analysis tool and does not constitute financial advice. The simulated position tracking feature is for educational visualization only and does not represent actual trade results. No scoring system or multi-indicator confluence framework can guarantee profitable trading outcomes. All trading involves risk, including the potential loss of principal. Users are solely responsible for their own trading decisions. Please consider your individual risk tolerance and consult a licensed financial professional before engaging in any trading activity.
-Made with passion by officialjackofalltrades
Penunjuk

Penunjuk

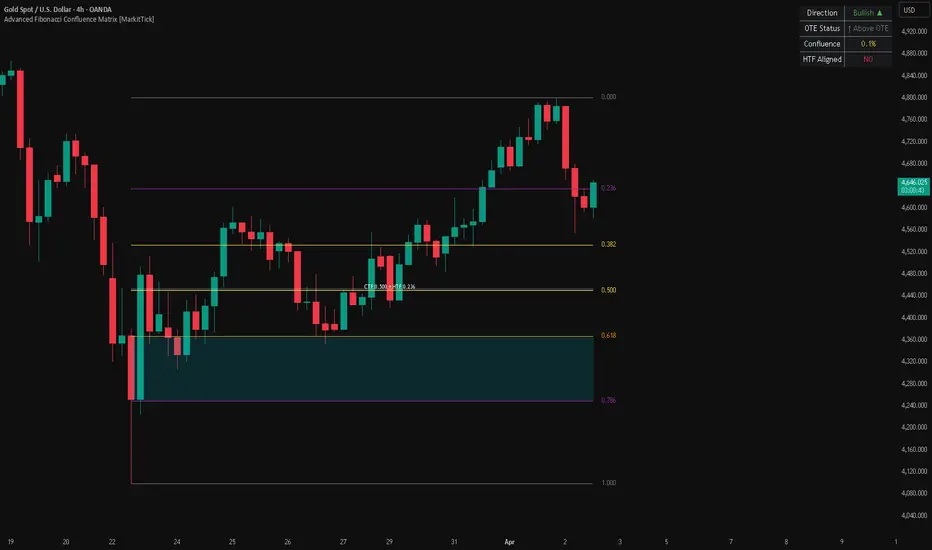
Advanced Fibonacci Confluence Matrix [MarkitTick]💡 The Advanced Fibonacci Confluence Matrix is a sophisticated multi-dimensional analytical tool designed for professional traders who demand precision in identifying high-probability institutional entry zones. By integrating Fibonacci retracement logic with multi-timeframe (MTF) confluence and Fair Value Gap (FVG) detection, this script identifies the "Optimal Trade Entry" (OTE) zones where various technical factors align. It serves as a comprehensive institutional-grade execution engine, providing not just visual zones, but also automated risk calculation and webhook-ready alert payloads for algorithmic execution.
● ✨ Originality and Utility
Traditional Fibonacci tools are often static and require manual adjustment, leading to subjective bias and missed opportunities during rapid price action. This indicator revolutionizes the process by:
• Dynamic Anchor Selection : It automatically identifies significant swing highs and lows to anchor Fibonacci levels, ensuring that the zones remain relevant to current market structure.
• Multi-Timeframe Confluence : It fetches Fibonacci data from higher timeframes (HTF), such as the Daily or 4-hour charts, and overlays them onto the local timeframe. This allows traders to see when a local OTE zone aligns with a major institutional level.
• FVG Integration : The script looks for Fair Value Gaps within the OTE zones. The presence of an FVG serves as a "magnet" or "trigger," increasing the probability that price will react within that specific area.
• Automated Alert Logic : Unlike simple price alerts, this script generates a structured JSON payload including Entry, Stop Loss, Take Profit, and calculated Position Size based on user-defined risk parameters.
● 🔬 Methodology and Concepts
The indicator is built upon the premise of Institutional Order Flow and the "Discount vs. Premium" market theory.
• Fibonacci Retracement Engine : The core logic calculates standard ratios (0.236, 0.382, 0.5, 0.618, 0.786). The "Optimal Trade Entry" is specifically defined as the zone between the 0.618 and 0.786 retracement levels.
• The Confluence Matrix : The script maintains an internal matrix of "hits." When price enters a zone where a local Fibonacci level, an HTF level, and a Prime FVG all overlap, the confluence score increases, and the visual intensity of the zone changes to alert the trader.
• Fair Value Gap (FVG) Logic : The script detects imbalances where the High of Bar N is lower than the Low of Bar N+2 (for bearish) or the Low of Bar N is higher than the High of Bar N+2 (for bullish). It specifically filters for "Prime FVGs" that reside within the OTE retracement area.
• Risk-Adjusted Position Sizing : It uses the distance between the Entry (usually the 0.618 level or FVG edge) and the Stop Loss (usually the swing anchor) to calculate how many units should be traded to risk exactly X% of the account balance.
● 🎨 Visual Guide
• The OTE Zone (The Golden Box) : A shaded rectangle appearing between the 0.618 and 0.786 Fibonacci levels. A Green box signifies a bullish discount zone, while a Red box signifies a bearish premium zone.
• HTF Confluence Lines : Horizontal dashed lines across the chart representing the 0.5 (Equilibrium) and 0.618 levels from a higher timeframe. These are typically colored Orange or Purple to distinguish them from local levels.
• Fair Value Gap (FVG) Rectangles : Small, semi-transparent boxes that mark price imbalances. When these appear inside the OTE Zone, they are highlighted with a thicker border to indicate a "High Probability Trigger."
• Swing Anchor Labels : Small "H" (High) and "L" (Low) labels appear at the points where the Fibonacci tool is anchored. These labels help the trader verify the current market structure context.
• Signal Labels : When a confluence event occurs, a "BUY" or "SELL" label appears above or below the candle. The label includes the calculated "Risk:Reward" ratio for that specific setup.
• Dashboard Table : A small UI element in the corner of the chart displaying the current HTF trend status, the distance to the nearest OTE zone, and the calculated position size for the next trade.
● 📖 How to Use
• Identifying a Setup : Wait for the script to define a new swing move. Once the "OTE Zone" box is drawn, monitor the price as it retraces toward that box.
• Confirming Confluence : The highest quality trades occur when the price enters the OTE zone and simultaneously touches an HTF dashed line or fills a Prime FVG.
• Execution : Look for the "Long Entry" or "Short Entry" signal. The script is optimized for "Bar Close" execution to avoid repainting issues.
• Automation : If using webhooks, ensure your execution platform is set to receive the JSON format. The "Action," "Ticker," and "Qty" fields are automatically populated based on the signal.
• Exit Strategy : The default Take Profit is set to the 0.0 Fibonacci level (the swing high/low), while the Stop Loss is placed just beyond the 1.0 anchor point.
● ⚙️ Inputs and Settings
• Fibonacci Sensitivity : Adjust the "Swing Lookback" to determine how significant a high or low must be to act as an anchor. Higher values result in more "Macro" zones.
• HTF Resolution : A dropdown allowing you to select which timeframe (e.g., 60m, 240m, Daily) the confluence lines should be pulled from.
• Zone Selection : Toggle switches to enable or disable specific levels (e.g., show only the 0.618 and 0.786).
• Risk Management : Input your "Account Size" and "Risk Percentage" (e.g., 1% or 0.5%) to calibrate the automated position sizing alerts.
• Alert Configuration : Options to enable specific JSON payloads for "Long Only," "Short Only," or "Both."
● 🔍 Deconstruction of the Underlying Scientific and Academic Framework
The Advanced Fibonacci Confluence Matrix is grounded in the Golden Ratio Theory and the Efficient Market Hypothesis (EMH), specifically focusing on market inefficiencies.
• Mathematical Proportions : The indicator utilizes the irrational number Phi (approximately 1.618) and its inverse (0.618). These ratios are derived from the Fibonacci sequence, where each number is the sum of the two preceding ones. In financial markets, these ratios describe the recursive nature of price retracements and expansions.
• Statistical Mean Reversion : The use of the 0.5 level (Equilibrium) is based on the statistical principle of mean reversion, suggesting that price has a natural tendency to return to a central point of value before continuing a trend.
• Liquidity & Imbalance Theory : The Fair Value Gap detection is based on the "Information Asymmetry" model in economics. When a large institutional order enters the market, it creates a "gap" or "void" because the liquidity at certain price levels was consumed too quickly. Academically, these gaps represent "Inefficient Pricing" that the market seeks to "fill" to restore equilibrium.
• Confluence Probability : By applying the Law of Large Numbers and Multi-Factor Modeling, the script assumes that the intersection of independent variables (Local Fib + HTF Fib + FVG) reduces the "Noise-to-Signal" ratio, thereby increasing the statistical significance of the resulting trade signal.
⚠️ Disclaimer
All provided scripts and indicators are strictly for educational exploration and must not be interpreted as financial advice or a recommendation to execute trades. I expressly disclaim all liability for any financial losses or damages that may result, directly or indirectly, from the reliance on or application of these tools. Market participation carries inherent risk where past performance never guarantees future returns, leaving all investment decisions and due diligence solely at your own discretion. Penunjuk
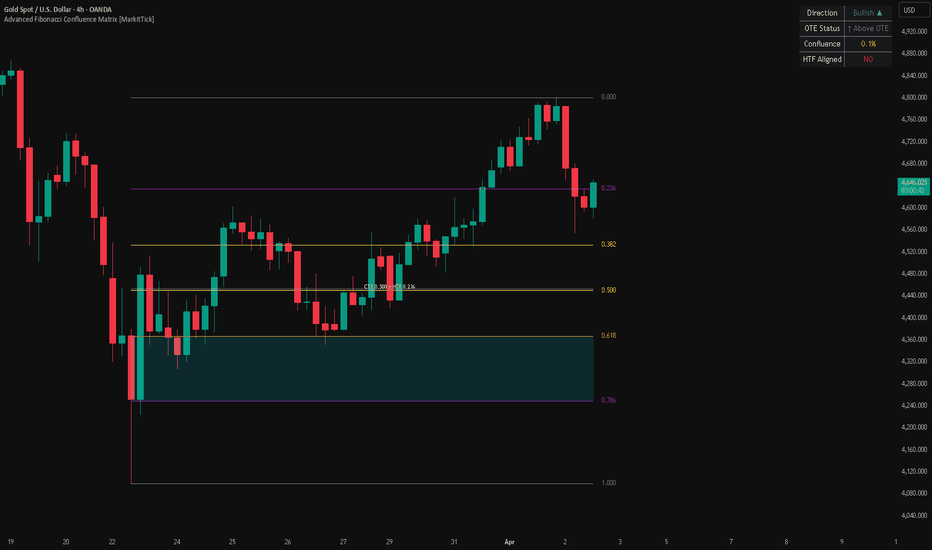
SMC Fibonacci Golden Zone OscillatorThe SMC Fibonacci Golden Zone Oscillator is a technical analysis tool that combines the principles of Smart Money Concepts (SMC) with Fibonacci retracement theory. It operates as an oscillator in a separate pane, normalizing the current price to a 0-100 scale within a dynamically identified range (defined by the most recent swing highs and lows).
The script's primary purpose is to provide traders with a clear, visual representation of price's position relative to key Fibonacci levels, with a special focus on the "Golden Zone" (the area between the 50% and 61.8% retracement). It automates the identification of crucial SMC structures like Breaks of Structure (BOS), Changes of Character (CHoCH), and Equal Highs/Lows (EQH/EQL), plotting them directly on the oscillator for enhanced context.
iBOS (Internal Break of Structure)
An iBOS is a Break of Structure on the smaller, internal scale. It signifies that the short-term momentum is continuing in the same direction as the internal trend.
What it looks like on the oscillator: You will see a label iBOS appear as the oscillator line breaks a recent minor peak or trough.
How to use it:
For Entries: If the main trend is up (confirmed by a CHoCH on the Swing structure), you can use an iBOS on the internal scale as a precise entry signal to go long, as it confirms the short-term momentum is with you.
For Confirmation: A series of iBOSs in the direction of the main trend is a strong sign of a healthy, trending market.
iCHoCH (Internal Change of Character)
An iCHoCH is a Change of Character on the smaller, internal scale. It is the earliest possible warning of a potential reversal in the short-term momentum.
Utility & Core Functionality:
Contextual Price Position: It instantly shows whether the current price is in the "Premium" (high), "Discount" (low), or "Equilibrium" (middle) phase of its recent range.
Dynamic Support & Resistance: The script calculates and plots the exact price levels for the 0.50, 0.618, and 0.786 Fibonacci retracements of the current range. These act as dynamic, real-time support and resistance zones.
Reversal Zone Identification: The "Golden Zone" (highlighted between 61.8% and 50%) is a critical area where price often reverses or consolidates before a significant move. The oscillator clearly marks when price enters and exits this zone.
Automated SMC Analysis: It automatically draws and labels BOS, CHoCH, and Swing Points (HH, HL, LH, LL) on the oscillator, helping traders confirm trend strength and potential shifts without manual drawing.
Momentum and Signal Confirmation: It includes a Signal Line (EMA of the oscillator) and a Momentum Line to help confirm the strength and direction of price movements and to generate crossover trading signals.
What it looks like on the oscillator: You will see a label iCHoCH appear as the oscillator line breaks a recent minor trough or peak, going against the immediate internal trend.
How to use it:
For Exits: If you are in a long trade and see an iCHoCH to the downside, it might be a signal to take profits or tighten your stop-loss. It's the first hint that the short-term bullish momentum is faltering.
For Early Reversal Signals: An iCHoCH can sometimes precede a full-scale CHoCH on the Swing structure. Traders can use it as a very early alert that a larger reversal might be coming.
Recommended Timeframes:
This indicator is versatile and can be applied across various timeframes, but its effectiveness increases with higher timeframes due to more reliable structure.
Swing Trading (Ideal): 4-Hour, Daily, and Weekly charts are perfect. The SMC structures and Fibonacci levels formed on these timeframes are more significant and lead to more substantial price moves.
Day Trading: 15-Minute, 30-Minute, and 1-Hour charts work well. A common strategy is to use a higher timeframe (e.g., 4H) to determine the overall trend and key Golden Zone levels, then use a lower timeframe (e.g., 15M) for precise entry signals using the oscillator's crossovers and CHoCH patterns.
Scalping: 1-Minute and 5-Minute charts can be used, but with caution. Market noise on these low timeframes can generate false signals. It's highly recommended to use a higher timeframe for context when scalping.
How to Trade with the Script:
The core trading strategy revolves around identifying price reacting within the Golden Zone or other key Fibonacci levels.
Bullish (Long) Setup-
Identify the Context: Price is in a downtrend, and the oscillator is falling towards the lower end of the pane (0-50).
Entry Zone: Wait for the oscillator to enter the Golden Zone (61.8-50) or the Discount Zone (below 38.2). This indicates price is at a potential support area.
Confirmation Signal: Look for one or more of the following:
A bullish CHoCH (Change of Character) on the oscillator, where it breaks the most recent lower high.
A crossover of the main oscillator line above its Signal Line (EMA).
A bullish candlestick pattern (e.g., hammer, engulfing) on the main price chart at one of the Fibonacci price levels displayed on the right (e.g., the 0.618 or 0.786 price).
Entry: Enter a long position on the confirmation signal.
Stop-Loss: Place a stop-loss below the low of the range (the 0.786 or 1.0 Fibonacci level of that swing) or below the recent swing low on the price chart.
Take-Profit: Target the 50% equilibrium line (midline of the range), the opposite end of the range (the Premium Zone), or a subsequent lower high identified by the script.
Bearish (Short) Setup-
Identify the Context: Price is in an uptrend, and the oscillator is rising towards the upper end of the pane (50-100).
Entry Zone: Wait for the oscillator to enter the Golden Zone (61.8-50) or the Premium Zone (above 78.6). This indicates price is at a potential resistance area.
Confirmation Signal: Look for one or more of the following:
A bearish CHoCH on the oscillator, where it breaks the most recent higher low.
A crossover of the main oscillator line below its Signal Line (EMA).
A bearish candlestick pattern (e.g., shooting star, bearish engulfing) on the main price chart at one of the Fibonacci price levels (e.g., the 0.50 or 0.618 price).
Entry: Enter a short position on the confirmation signal.
Stop-Loss: Place a stop-loss above the high of the range (the 0.236 or 0.0 Fibonacci level) or above the recent swing high on the price chart.
Take-Profit: Target the 50% equilibrium line, the opposite end of the range (the Discount Zone), or a subsequent higher low.
Disclaimer:
Past performance of any trading system or methodology is not necessarily indicative of future results. This script and the accompanying analysis are provided for educational and informational purposes only. The content represents the personal opinions and strategies of the author and is not intended as, and should not be construed as, financial advice, a recommendation, or an offer to buy or sell any financial instrument. Penunjuk
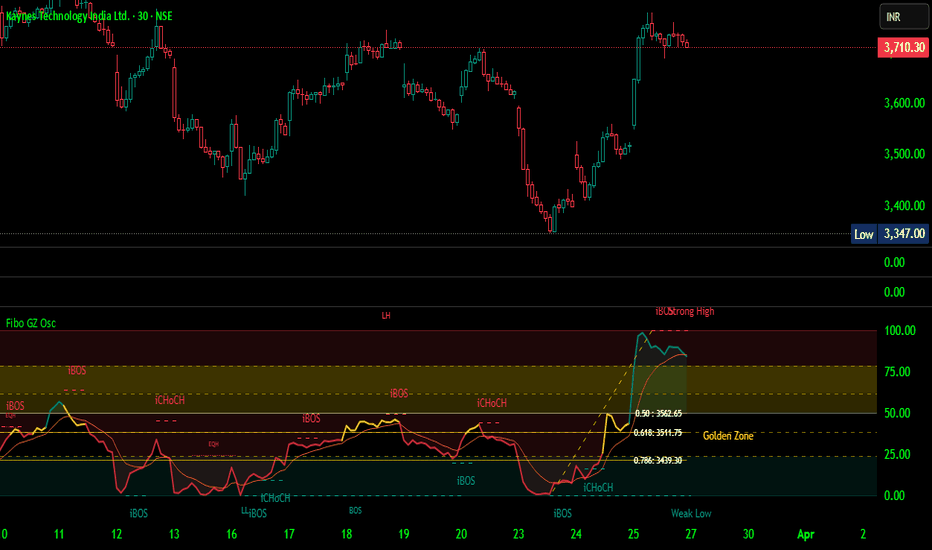
Harmonic Resonance Detector [JOAT]Harmonic Resonance Detector
Introduction
The Harmonic Resonance Detector is an advanced open-source Fibonacci analysis indicator that combines multi-wave Fibonacci retracements, confluence zone detection, golden ratio harmonics, and density heatmapping into a unified harmonic analysis system. This indicator helps traders identify high-probability reversal and continuation zones by analyzing where multiple Fibonacci levels from different swing waves converge, creating magnetic price attraction zones.
Unlike basic Fibonacci tools that draw levels from a single swing, this system analyzes three simultaneous swing waves (primary, secondary, tertiary) and identifies where their Fibonacci levels cluster. These confluence zones represent areas where multiple timeframes and swing structures agree on key levels, significantly increasing the probability of price reaction. The indicator is designed for traders who understand that Fibonacci levels work best when multiple waves confirm the same price zone.
Why This Indicator Exists
This indicator addresses a fundamental limitation of traditional Fibonacci analysis: single-swing Fibonacci levels are subjective and often unreliable. Different traders draw different swings and get different levels. By combining multiple swing analyses and identifying confluence, this indicator reveals:
Triple Swing Analysis: Analyzes three different swing lengths simultaneously (20, 50, 100 periods) to capture short, medium, and long-term structure
Confluence Zone Detection: Identifies where multiple Fibonacci levels cluster within tolerance - these zones act as price magnets
Golden Pocket Highlighting: Marks the 0.618-0.65 retracement zone - the highest probability reversal area based on golden ratio
Fibonacci Extensions: Projects 1.272, 1.414, and 1.618 extension levels for profit targets beyond the swing range
Density Heatmap: Visual representation of Fibonacci level concentration - darker colors = more confluence
Liquidity Sweep Detection: Identifies when price breaks highs/lows but closes back inside - signals institutional traps
Each component provides a different lens on harmonic structure. Triple swing analysis shows multi-timeframe agreement, confluence zones show magnetic levels, golden pocket shows optimal entry, extensions show targets, heatmap shows density, and sweeps show manipulation. Together, they create a comprehensive view of harmonic resonance.
Core Components Explained
1. Triple Swing Fibonacci Analysis
The indicator calculates Fibonacci retracements from three different swing lengths simultaneously:
// Calculate swing high/low for each period
swingHigh1 = ta.highest(high, 20) // Primary wave
swingLow1 = ta.lowest(low, 20)
swingHigh2 = ta.highest(high, 50) // Secondary wave
swingLow2 = ta.lowest(low, 50)
swingHigh3 = ta.highest(high, 100) // Tertiary wave
swingLow3 = ta.lowest(low, 100)
// Calculate Fibonacci levels for each swing
fib1 = calculateFibs(swingHigh1, swingLow1)
fib2 = calculateFibs(swingHigh2, swingLow2)
fib3 = calculateFibs(swingHigh3, swingLow3)
For each swing, the indicator calculates standard Fibonacci retracement levels:
23.6% - Shallow retracement, weak pullback
38.2% - Moderate retracement, common in strong trends
50.0% - Equilibrium level, psychological significance
61.8% - Golden ratio, highest probability reversal zone
78.6% - Deep retracement, last chance before trend failure
By analyzing three different swing lengths, the indicator captures short-term, medium-term, and long-term structure simultaneously. When levels from all three swings align, it creates powerful confluence.
2. Confluence Zone Detection
The indicator identifies zones where multiple Fibonacci levels cluster within a tolerance percentage:
confluenceTolerance = 0.3 // Default 0.3%
// For each Fibonacci level, count how many other levels are nearby
for each level in allFibLevels:
confluenceCount = 0
for each otherLevel in allFibLevels:
if abs(level - otherLevel) / level * 100 <= confluenceTolerance:
confluenceCount += 1
if confluenceCount >= 3: // Minimum 3 levels clustering
createConfluenceZone(level, confluenceCount)
Confluence zones are displayed as:
Horizontal boxes spanning the tolerance range
Color intensity based on confluence count (4+ levels = red, 3 levels = orange, 2 levels = yellow)
Labels showing "3x CONFLUENCE", "4x CONFLUENCE", etc.
Thicker borders for higher confluence zones
The more Fibonacci levels that converge at a price zone, the stronger the magnetic effect. 4x or 5x confluence zones are extremely high-probability reaction areas.
3. Golden Pocket Visualization
The Golden Pocket is the zone between 0.618 and 0.65 Fibonacci retracement - the highest probability reversal area:
fib618 = swingLow + (swingHigh - swingLow) * 0.618
fib650 = swingLow + (swingHigh - swingLow) * 0.650
goldenTop = max(fib618, fib650)
goldenBottom = min(fib618, fib650)
The Golden Pocket is special because:
Based on the golden ratio (phi = 1.618), found throughout nature and markets
Represents optimal balance between retracement depth and trend continuation
Historically shows highest win rate for reversal trades
Often coincides with institutional order placement zones
The indicator highlights the Golden Pocket with:
Multi-layer gradient gold box
"GOLDEN POCKET" label at center
Enhanced candlestick coloring when price is inside (gold for bullish, brown for bearish)
Background gradient when price enters the zone
4. Fibonacci Extensions
Extensions project levels beyond the swing range for profit targets:
// Extension levels
ext1272 = swingLow + (swingHigh - swingLow) * 1.272
ext1414 = swingLow + (swingHigh - swingLow) * 1.414
ext1618 = swingLow + (swingHigh - swingLow) * 1.618
Extension levels represent:
127.2% - First extension target, common profit-taking zone
141.4% - Square root of 2, geometric harmony level
161.8% - Golden ratio extension, major target zone
Extensions are drawn as dashed lines with purple gradient colors. They show where price is likely to find resistance after breaking through the swing high (or support after breaking swing low).
5. Confluence Density Heatmap
The heatmap visualizes Fibonacci level concentration across the price range:
The indicator:
Divides the recent price range into 20 grid cells
Counts how many Fibonacci levels fall into each cell
Colors cells based on density (blue = low, red = high)
Displays as vertical bars on the left side of the chart
The heatmap reveals:
Zones with highest Fibonacci concentration (darkest red)
Gaps where few Fibonacci levels exist (blue or empty)
Vertical distribution of harmonic structure
Quick visual reference for key zones
Traders can quickly identify the most important price levels by looking for the darkest red cells in the heatmap.
6. Liquidity Sweep Detection
Liquidity sweeps occur when price breaks a swing high/low but closes back inside the range - a classic institutional trap:
// Detect sweep: high breaks previous swing high but close is below it
liquiditySweepHigh = high > prevSwingHigh and close < prevSwingHigh
// Detect sweep: low breaks previous swing low but close is above it
liquiditySweepLow = low < prevSwingLow and close > prevSwingLow
When sweeps occur:
Dashed horizontal line marks the swept level
"LIQ SWEEP" label appears
Often precedes reversal as institutions trapped retail traders
Combines with Fibonacci confluence for high-probability setups
Liquidity sweeps at Fibonacci confluence zones are especially powerful - they signal institutional positioning complete and reversal imminent.
7. Equilibrium Boxes (EQH/EQL)
Equilibrium boxes mark 50% retracement zones throughout the chart:
The indicator:
Identifies significant ranges throughout lookback period
Calculates 50% level (equilibrium) for each range
Draws grey boxes around equilibrium with dashed center line
Labels with "EQH" (Equal Highs) marker
Equilibrium zones represent fair value and often act as support/resistance. Price tends to gravitate toward equilibrium before continuing or reversing.
Visual Elements
Fibonacci Lines: Dotted lines at 23.6%, 38.2%, 50%, 61.8%, 78.6% with color coding
Extension Lines: Dashed purple lines at 127.2%, 141.4%, 161.8%
Confluence Zones: Horizontal boxes with intensity-based coloring and count labels
Golden Pocket: Multi-layer gradient gold box with center label
Density Heatmap: Vertical gradient bars showing Fibonacci concentration
Liquidity Sweeps: Dashed lines with "LIQ SWEEP" labels
Equilibrium Boxes: Grey boxes with dashed center lines and "EQH" labels
Enhanced Candles: Gold/orange coloring in Golden Pocket, red/green at confluence zones
Background Gradients: Premium zone (red), Discount zone (green), Golden Pocket (gold)
Dashboard: Real-time confluence metrics and trade signals
The dashboard displays 8 key metrics:
1. Active Zones (count of confluence zones)
2. Peak Confluence (highest confluence count)
3. Nearest Zone (distance to closest confluence)
4. Magnetic Pull (Extreme/Strong/Moderate/Weak)
5. Golden Zone (Active/Inactive)
6. Heatmap Density (total Fibonacci levels)
7. Trade Signal (Sniper Entry/Valid Setup/Wait)
Input Parameters
Harmonic Waves:
Primary Wave: First swing length (default: 20)
Secondary Wave: Second swing length (default: 50)
Tertiary Wave: Third swing length (default: 100)
Golden Pocket: Enable 0.618-0.65 zone highlighting
Confluence Engine:
Resonance Tolerance: Percentage range for confluence (default: 0.3%)
Min Harmonic Count: Minimum levels required for confluence (default: 3)
Magnetic Zones: Enable/disable confluence zone boxes
Visualization:
Fibonacci Levels: Show/hide retracement lines
Confluence Zones: Show/hide confluence boxes
Density Heatmap: Show/hide vertical heatmap
Extensions: Show/hide 1.272, 1.414, 1.618 levels
Equilibrium Boxes: Show/hide EQH zones
Liquidity Sweeps: Show/hide sweep markers
Gradient Backgrounds: Show/hide value zone colors
Enhanced Candlesticks: Enable special candle coloring
How to Use This Indicator
Step 1: Identify Confluence Zones
Look for horizontal boxes with "3x CONFLUENCE" or higher labels. These are magnetic zones where price is likely to react. 4x+ confluence = highest probability.
Step 2: Check Golden Pocket Status
Dashboard shows if Golden Pocket is active. When price enters the golden zone (0.618-0.65), it's optimal reversal area. Candles turn gold.
Step 3: Monitor Nearest Zone Distance
Dashboard shows distance to nearest confluence. <0.5% = price is at the zone. <1.0% = approaching. >2.0% = far away.
Step 4: Assess Magnetic Pull Strength
Dashboard shows pull strength. "EXTREME" = 4+ confluence within 0.5%. "STRONG" = 3+ confluence within 1.0%. Trade extreme and strong only.
Step 5: Watch for Liquidity Sweeps
When price sweeps a high/low at a confluence zone and reverses, it's a sniper entry. Institutions trapped retail and are now reversing.
Step 6: Use Extensions for Targets
After entry at confluence zone, use extension levels (127.2%, 141.4%, 161.8%) as profit targets. These are natural resistance/support zones.
Step 7: Check Trade Signal
Dashboard shows "SNIPER ENTRY" when price is within 0.5% of 4+ confluence. "VALID SETUP" for 3+ confluence within 1.0%. "WAIT" otherwise.
Best Practices
Higher confluence = higher probability - prioritize 4x+ zones
Golden Pocket + confluence = best reversal setups
Liquidity sweeps at confluence zones = institutional positioning
Use heatmap for quick visual reference of key zones
Extensions work best after confluence zone holds
Equilibrium boxes show fair value - expect gravitational pull
Premium/discount background shows context - buy discount, sell premium
Enhanced candles signal when price is at key zones
Multiple timeframe confluence (all three swings) = strongest setups
Confluence zones can act as support after breaking resistance (and vice versa)
Indicator Limitations
Fibonacci analysis is subjective - different swing selections produce different levels
Confluence zones show where levels cluster, not guaranteed reversals
Golden Pocket doesn't always hold - strong trends can blow through it
Liquidity sweeps can extend further than expected (double sweeps)
Heatmap density doesn't account for level importance (all levels weighted equally)
Extensions may not be reached in weak trends
Tolerance setting affects confluence detection - too tight misses zones, too wide creates false zones
The indicator shows harmonic structure, not fundamental drivers
Confluence zones can fail during news events or market shocks
Technical Implementation
Built with Pine Script v6 using:
Triple swing Fibonacci calculations with automatic trend detection
Confluence detection algorithm with tolerance-based clustering
Golden Pocket identification and highlighting system
Fibonacci extension projections (1.272, 1.414, 1.618)
Density heatmap with grid-based level counting
Liquidity sweep detection with close confirmation
Equilibrium box generation throughout chart history
Enhanced candlestick coloring based on zone proximity
Multi-gradient background system for value zones
Real-time dashboard with 8 harmonic metrics
The code is fully open-source and can be modified to suit individual trading styles and preferences.
Originality Statement
This indicator is original in its comprehensive harmonic integration approach. While individual components (Fibonacci retracements, golden ratio, extensions) are established concepts, this indicator is justified because:
It synthesizes three simultaneous swing analyses into unified confluence detection
The confluence algorithm identifies clustering zones with configurable tolerance
Golden Pocket highlighting with enhanced visualization and candlestick coloring
Density heatmap provides visual representation of Fibonacci concentration
Liquidity sweep detection combines with Fibonacci zones for trap identification
Equilibrium box system marks fair value zones throughout chart history
Multi-gradient background system shows premium/discount context
Magnetic pull strength quantification based on confluence and proximity
Real-time dashboard presents 8 metrics simultaneously for holistic harmonic analysis
Each component contributes unique information: Triple swings show multi-timeframe structure, confluence shows magnetic zones, golden pocket shows optimal entry, extensions show targets, heatmap shows density, sweeps show manipulation, and equilibrium shows fair value. The indicator's value lies in presenting these complementary perspectives simultaneously with unified classification and actionable trade signals.
Disclaimer
This indicator is provided for educational and informational purposes only. It is not financial advice or a recommendation to buy or sell any financial instrument. Trading involves substantial risk of loss and is not suitable for all investors.
Fibonacci analysis is a tool for identifying potential support and resistance zones, not a crystal ball for predicting future price movement. Confluence zones do not guarantee reversals. Golden Pocket does not guarantee entries. Extensions may not be reached. Past harmonic patterns do not guarantee future harmonic patterns. Market conditions change, and strategies that worked historically may not work in the future.
The zones displayed are analytical constructs based on current market data, not predictions of future price movement. High confluence scores do not guarantee profitable trades. Users must conduct their own analysis and risk assessment before making trading decisions.
Always use proper risk management, including stop losses and position sizing appropriate for your account size and risk tolerance. Never risk more than you can afford to lose. Consider consulting with a qualified financial advisor before making investment decisions.
The author is not responsible for any losses incurred from using this indicator. Users assume full responsibility for all trading decisions made using this tool.
-Made with passion by officialjackofalltrades Penunjuk

Fibonacci Structure Engine [WillyAlgoTrader]📐 Fibonacci Structure Engine is an overlay indicator that combines automatic Fibonacci retracement from live market structure with Smart Money Concepts (BOS/CHoCH detection), weighted confluence scoring, premium/discount zone classification, and context-filtered engulfing pattern entries — creating a complete structure-to-Fibonacci-to-entry workflow where every component feeds into the next.
The core idea: Fibonacci levels are only meaningful when drawn from the correct swing points. This indicator automates the entire process: it detects swing highs/lows with ATR-filtered pivot detection, identifies structure breaks (BOS) and trend reversals (CHoCH), anchors Fibonacci retracement levels from the structure-defined swing, trails the live edge as price extends, locks it when a confirmed pivot arrives, scores the confluence between current price and Fibonacci levels, and generates entry signals when engulfing patterns occur at high-confluence zones in the correct structural context.
Most Fibonacci tools on TradingView require manual drawing — you select the swing high and low, and the levels appear. The problem: selecting the wrong swing, forgetting to update after a new structure break, or drawing from a minor swing that doesn't reflect the current trend leg. This indicator solves all three: the Fibonacci anchors update automatically on every structure break, trail the live edge as price extends, and lock when a confirmed pivot arrives — always reflecting the most relevant swing for the current market structure.
🧩 WHY THESE COMPONENTS WORK TOGETHER
Fibonacci retracement levels alone are static S/R lines. Structure detection alone tells you trend direction. Engulfing patterns alone fire everywhere. Confluence scoring alone has nothing to score against.
This indicator chains them into a dependency pipeline:
ATR-filtered swing detection → HH/HL/LH/LL classification → BOS/CHoCH structure breaks → Fibonacci anchor from structure swing → Live edge trailing + pivot locking → Fib level calculation → Confluence scoring (price vs Fib levels) → Premium/Discount zone classification → Engulfing pattern detection in structural context → Entry signal with cooldown
The swing detection feeds the structure engine — without confirmed pivots, no BOS/CHoCH can fire. The structure breaks anchor the Fibonacci levels — without a break, there's no swing to draw from. The Fibonacci levels feed the confluence scorer — without levels, there's nothing to score proximity against. The confluence score plus the premium/discount zone filter the engulfing patterns — without context, engulfing patterns produce too many false entries. And the signal cooldown prevents clustering from this entire chain.
Removing the structure detection breaks the Fibonacci anchoring. Removing the ATR filter floods the structure with noise swings. Removing the confluence scoring allows entries at non-Fibonacci prices. Removing the premium/discount filter allows bullish entries in premium (where sells should occur). Each component eliminates a specific failure mode.
🔍 WHAT MAKES IT ORIGINAL
1️⃣ Structure-anchored Fibonacci with live edge trailing.
The Fibonacci engine uses a 4-phase lifecycle:
Phase 1 — Anchor on structure break: When a BOS or CHoCH is detected:
— Bullish break: top = current high (live, will trail), bottom = most recent swing low (locked)
— Bearish break: bottom = current low (live, will trail), top = most recent swing high (locked)
This instantly draws Fibonacci levels from the break point.
Phase 2 — Trail live edge: As price extends beyond the initial break, the live edge (top for bull, bottom for bear) updates to the new extreme. Fibonacci levels recalculate continuously to reflect the current move. This captures the full extent of the breakout without waiting for a pivot confirmation.
Phase 3 — Lock on pivot: When a confirmed swing high (for bullish trailing) or swing low (for bearish trailing) is detected by the pivot engine, the live edge locks to that confirmed pivot. The Fibonacci levels stop updating and represent the confirmed swing range.
Phase 4 — Update on new swings: When a new confirmed swing arrives that differs from the current locked anchor, the Fibonacci levels update to the new structure — always reflecting the most recent confirmed swing.
This lifecycle means the Fibonacci levels are always relevant: immediately reactive after a break (phases 1–2), then structurally confirmed once a pivot is detected (phases 3–4).
2️⃣ ATR-filtered pivot detection with noise suppression.
Standard ta.pivothigh/ta.pivotlow detects every local extreme, including minor fluctuations that don't represent real swing points. The ATR filter requires:
— For a swing high: the distance from the pivot high to the most recent swing low ≥ ATR × multiplier (default 0.5)
— For a swing low: the distance from the most recent swing high to the pivot low ≥ ATR × multiplier
This ensures only swings of meaningful size (relative to current volatility) are used for structure detection and Fibonacci anchoring. The multiplier is configurable: lower (0.2–0.3) for more granular structure, higher (0.8–1.0) for only major swings.
3️⃣ BOS / CHoCH structure detection with bias tracking.
The indicator tracks a persistent structureBias variable (+1 bullish, −1 bearish, 0 neutral):
— BOS (Break of Structure) : close breaks above the most recent swing high while bias is already bullish (or below swing low while already bearish) — trend continuation
— CHoCH (Change of Character) : close breaks above swing high while bias was bearish, or below swing low while bias was bullish — trend reversal
Each break requires: barstate.isconfirmed + the swing level hasn't been broken before (tracked via lastBrokenHigh/lastBrokenLow). Structure lines are drawn from the swing point to the break bar with configurable style (solid/dashed/dotted) and width.
4️⃣ Weighted confluence scoring (0–100).
The indicator measures how close the current price is to each Fibonacci level (within ATR × tolerance) and assigns weights by Fib importance:
— 0.236 → weight 1.0 (minor level)
— 0.382 → weight 1.5 (shallow retracement)
— 0.500 → weight 2.0 (equilibrium)
— 0.618 → weight 2.5 (golden ratio — highest weight)
— 0.786 → weight 1.5 (deep retracement)
Swing highs/lows within tolerance add +1.0 each. Total weight × 10 = confluence score (capped at 100). Classification: Strong (≥ 60), Moderate (≥ 30), Weak (> 0), None (0).
The tolerance is ATR-based (default 0.3× ATR) — on a volatile instrument, the "near" zone expands proportionally. On a quiet instrument, it tightens. This prevents false confluence readings from both too-tight and too-loose proximity checks.
5️⃣ Premium / Discount zone classification.
Using the 0.500 Fibonacci level as the equilibrium:
— Premium : close > Fib 0.500 — price is above equilibrium (expensive relative to the swing)
— Discount : close ≤ Fib 0.500 — price is below equilibrium (cheap relative to the swing)
This classification is used as a context filter for engulfing patterns: bullish engulfing patterns are only marked when price is in discount or at a confluence zone. Bearish engulfing patterns are only marked in premium or at a confluence zone. This prevents the most common engulfing failure mode: bullish patterns at the top of a range and bearish patterns at the bottom.
6️⃣ Context-filtered engulfing pattern detection.
The engulfing pattern detection requires:
— Current candle body > EMA(body, 14) — above-average body size (not a doji)
— Previous candle body < EMA(body, 14) — smaller previous candle (setup for engulf)
— Current candle fully engulfs previous candle's body
— Context filter: in premium/discount zone OR confluence weight ≥ 1.5
Bearish engulfing (▼): marked when price is in premium or near a Fib level — a reversal pattern at resistance. Bullish engulfing (▲): marked when price is in discount or near a Fib level — a reversal pattern at support.
7️⃣ Dual-path entry signals with cooldown.
Two entry paths:
— Engulfing + Structure + Confluence : engulfing pattern in context + structure bias aligned + confluence weight ≥ 1.5
— CHoCH (trend reversal) : any confirmed CHoCH — strong reversal signal, no additional confluence required
Both paths subject to signal cooldown (default 5 bars) to prevent clustering. Buy/Sell signals are displayed as labels (off by default — enable in Visual Settings).
8️⃣ Golden Zone + Target Zone visualization.
Two highlighted zones drawn as semi-transparent boxes:
— Golden Zone (0.500 – 0.786): the highest-probability retracement area. Where most retests find support/resistance.
— Target Zone (−0.500 – −0.618): the Fibonacci extension target for the next leg. Where price typically reaches after a confirmed retracement entry.
Both zones extend rightward by the configurable extension (default 20 bars) and update with Fibonacci level changes.
9️⃣ Seven configurable Fibonacci levels.
Individually toggleable: 0.236, 0.382, 0.500, 0.618, 0.786, −0.500, and Target (−0.618). Each drawn with distinct line styles — 0.618 is the thickest and most opaque (golden ratio emphasis), 0.236 is the thinnest (minor level). A dotted reference line connects the swing low to swing high showing the measured move.
⚙️ HOW IT WORKS — CALCULATION FLOW
Step 1 — Pivot detection: ta.pivothigh/ta.pivotlow with configurable lookback. ATR filter removes minor swings (swing size must exceed ATR × multiplier).
Step 2 — Swing tracking: Most recent two swing highs and two swing lows stored with bar indices. Each new swing is compared to previous → HH/HL/LH/LL classification.
Step 3 — Structure detection: Close breaks above swing high → BOS (if bias already bullish) or CHoCH (if bias was bearish). Same logic inverted for bearish breaks. Structure bias updated.
Step 4 — Fibonacci anchoring: On break → live edge set at current extreme, locked edge at swing. Live edge trails with price. Locks when confirmed pivot arrives. Updates on new swings.
Step 5 — Level calculation: fibLevel = swingHigh − (swingHigh − swingLow) × ratio for each ratio. Extension targets use negative ratios.
Step 6 — Confluence scoring: For each Fib level, check if |close − level| ≤ ATR × tolerance. Add weighted score. Include swing level proximity. Cap at 100.
Step 7 — Entry logic: Path A: engulfing in context + bias + confluence ≥ 1.5. Path B: CHoCH. Both respect cooldown.
📖 HOW TO USE
🎯 Quick start:
1. Add the indicator — Fibonacci levels and structure labels appear automatically
2. HH/HL/LH/LL labels show market structure
3. BOS/CHoCH labels show structure breaks and reversals
4. Yellow-shaded Golden Zone (0.500–0.786) = highest-probability retracement area
5. ▲/▼ arrows = engulfing patterns in structural context
6. Enable Buy/Sell Signals in Visual Settings for entry labels
👁️ Reading the chart:
— 🟢 HH / HL labels = bullish structure (higher highs, higher lows)
— 🔴 LH / LL labels = bearish structure (lower highs, lower lows)
— 🟢 "BOS" line + label = bullish break of structure (continuation)
— 🔴 "BOS" line + label = bearish break of structure
— 🟢🔴 "CHoCH" = Change of Character (trend reversal)
— 🔵 Horizontal lines = Fibonacci levels (0.236–0.786)
— 🟡 Shaded box (upper) = Golden Zone (0.500–0.786)
— 🟡 Shaded box (lower) = Target Zone (−0.500 to −0.618)
— 🟢 ▲ = bullish engulfing in discount / Fib zone
— 🔴 ▼ = bearish engulfing in premium / Fib zone
— 🟢 "BUY" / 🔴 "SELL" = confirmed entry signals (when enabled)
🔧 Tuning guide:
— Too many structure labels: increase Swing Length (12–20) or increase ATR Multiplier (0.7–1.0)
— Missing swings: decrease Swing Length (5–8) or decrease ATR Multiplier (0.2–0.3)
— Confluence too strict: increase Confluence ATR Tolerance (0.4–0.5)
— Too many engulfing signals: they self-filter by premium/discount — increase ATR Filter to reduce swing count
— Signal clustering: increase Signal Cooldown (8–15 bars)
⚙️ KEY SETTINGS REFERENCE
⚙️ Main:
— Swing Detection Length (default 10): pivot lookback — higher = larger swings
— ATR Swing Filter (default On): minimum swing size as ATR multiple
— ATR Filter Multiplier (default 0.5): how large swings must be
— Signal Cooldown (default 5): bars between consecutive signals
📐 Fibonacci:
— Show Fibonacci Levels (default On)
— Fib Extension Bars (default 20): rightward line extension
— Individual level toggles : 0.236 (off), 0.382, 0.500, 0.618, 0.786, −0.5, Target −0.618
— Confluence ATR Tolerance (default 0.3): proximity threshold
🏗️ Structure:
— BOS / CHoCH (default On): show structure break lines and labels
— Swing Labels (default On): HH/HL/LH/LL on pivots
— Engulfing Signals (default On): context-filtered patterns
🎨 Visual:
— Buy/Sell Signals (default Off): enable for entry labels
— Structure line style (Solid/Dashed/Dotted) and width (1–4)
— Auto / Dark / Light theme
🔔 Alerts
— 🟢 BUY / 🔴 SELL — ticker, price, TF, confluence score, SL, TP
— 🔵 BOS — structure break with direction
— 🟡 CHoCH — trend reversal with direction
All support plain text and JSON webhook format. Bar-close confirmed.
⚠️ IMPORTANT NOTES
— 🚫 No repainting. All structure breaks and signals require barstate.isconfirmed. Pivot detection uses equal left/right lookback (swingLen/swingLen) — pivots are confirmed swingLen bars after the actual high/low. Fibonacci levels update on confirmed pivots and structure breaks only.
— 📐 The Fibonacci anchor system has two states per edge: live and locked . A live edge trails with price (capturing the full move after a break). A locked edge is confirmed by a pivot. You'll see the Fibonacci levels shift on bar close as the live edge updates — this is by design, not repainting. Once the pivot locks, levels stabilize.
— ⚖️ The 0.618 level carries the highest confluence weight (2.5) because it is the golden ratio — the most statistically significant Fibonacci retracement level. The 0.500 carries weight 2.0, while the extreme levels (0.236, 0.786) carry 1.0–1.5.
— 📊 Buy/Sell signals are off by default . The indicator is designed primarily as a structure + Fibonacci analysis tool. Enable signals in Visual Settings when you want automated entry detection.
— 🔄 CHoCH signals do not require confluence — they represent a structural trend reversal, which is inherently a high-conviction event. Engulfing-based entries require confluence weight ≥ 1.5 + correct structural bias.
— 📏 The Golden Zone (0.500–0.786) is the area where most successful retests occur . The Target Zone (−0.500 to −0.618) is the area where the next impulse leg typically reaches. Both are highlighted with semi-transparent boxes.
— 🛠️ This is a structure analysis and Fibonacci visualization tool , not an automated trading bot. It maps market structure, draws Fibonacci levels, scores confluence, and identifies high-probability entry zones — trade decisions remain yours.
— 🌐 Works on all markets and timeframes. Penunjuk

Fibonacci Imbalance Zones [JOAT]Fibonacci Imbalance Zones
Introduction
Fibonacci Imbalance Zones is an open-source overlay indicator that merges automatic Fibonacci retracement with Fair Value Gap (FVG) detection and order block identification to find high-probability confluence zones where institutional concepts overlap. When a Fibonacci level aligns with an unmitigated FVG or an active order block, the indicator highlights that zone as a confluence point and optionally generates entry signals. It bridges the gap between classical Fibonacci analysis and modern Smart Money Concepts.
Built with Pine Script v6, the indicator uses custom types for Fibonacci levels, FVG zones, confluence points, swing points, order blocks, and institutional levels.
Why This Indicator Exists
Fibonacci retracement and FVG analysis are both widely used, but they are almost always applied as separate tools. Traders manually eyeball whether a Fibonacci level happens to overlap with an FVG, which is subjective and error-prone. This indicator automates that process by:
Auto-Fibonacci calculation: Automatically identifies the most recent significant swing high and swing low using pivot detection, then draws Fibonacci levels between them — no manual drawing required
FVG lifecycle tracking: Detects bullish and bearish FVGs, filters them by minimum size (ATR-based), tracks mitigation, and classifies them as premium or discount relative to fair value
Confluence detection: Programmatically checks whether any active Fibonacci level falls within a configurable ATR tolerance of any unmitigated FVG or order block, and calculates a confluence strength score
Entry signal generation: When price enters an FVG zone that overlaps with a key Fibonacci level (0.500-0.786 range), the indicator generates a directional entry signal
Core Components Explained
1. Automatic Fibonacci Levels
The indicator uses pivot detection to find the most significant recent swing high and swing low. The pivot strength parameter (default 5) controls how many bars on each side must be lower/higher for a point to qualify as a swing. Once swings are identified, Fibonacci levels are calculated:
calcFibLevel(float swingH, float swingL, float ratio, int direction) =>
float level = na
if direction > 0
level := swingL + (swingH - swingL) * ratio
else
level := swingH - (swingH - swingL) * ratio
level
Standard levels include 0.236, 0.382, 0.500, 0.618, and 0.786, each toggleable independently. Extensions at 1.618 and 2.272 are also available. When harmonic ratios are enabled, additional levels at 0.127, 0.414, 0.707, and 0.886 are drawn, covering the full spectrum of Fibonacci and harmonic trading levels.
Each level is drawn as a dashed line extending from the swing range to the right of the chart, with a label showing the ratio. Harmonic ratios receive a glow effect (thicker line, lower transparency) to visually distinguish them from standard levels.
2. FVG Detection with Premium/Discount Classification
Fair Value Gaps are detected using the standard three-bar pattern: a bullish FVG forms when the current bar's low is above the high from two bars ago. The indicator filters FVGs by a minimum size threshold (default 0.3x ATR) to avoid plotting insignificant gaps.
Each FVG is classified as premium or discount relative to the fair value of the middle candle:
Premium FVG: The gap's midpoint is above fair value — sellers may have an edge
Discount FVG: The gap's midpoint is below fair value — buyers may have an edge
FVGs are drawn as colored boxes. Premium FVGs use a gold color, discount FVGs use cyan, and neutral FVGs use the standard bull/bear colors. When mitigation tracking is enabled, the indicator monitors each FVG and updates its visual style (dotted border, faded color) when price fills the gap's midpoint.
Chart showing auto-drawn Fibonacci levels between swing high and swing low, with FVG boxes classified as premium (gold) and discount (cyan), and confluence diamonds where Fibonacci levels overlap with FVGs
3. Order Block Detection
The indicator identifies order blocks as the last opposing candle before a significant swing point, filtered by volume. A bullish order block is the last bearish candle before a swing high, but only if the volume on that candle exceeds 1.5x the 20-period volume average. This volume filter ensures that only institutionally significant order blocks are tracked.
Order blocks are drawn as semi-transparent boxes and monitored for sweeps. When price breaks through an order block, it is marked as swept and its visual is updated to a neutral, dotted style.
4. Confluence Detection Engine
The confluence engine is the core innovation of this indicator. It iterates through all active Fibonacci levels and checks each one against all unmitigated FVGs and active order blocks:
tolerance = atrVal * confluenceTol
for fib in fibLevels
if fib.isActive
for fvg in fvgZones
if not fvg.isMitigated
if math.abs(fib.price - fvg.mid) < tolerance
confStrength += 1
Each confluence point receives a strength score based on how many factors align:
Fibonacci level + FVG = base confluence
Add +1 if the Fibonacci level is a harmonic ratio (0.382, 0.618, etc.)
Add +1 if the FVG is in the premium or discount zone
Add +1 if the FVG has above-average volume
Add +1 if an order block also overlaps
Confluence points are drawn as labeled boxes showing which factors are present (e.g., "Harmonic+Discount+Volume"). A minimum confluence strength threshold (default 2) filters out weak confluences.
5. Entry Signal Generation
When entry signals are enabled, the indicator generates a bullish entry when price enters a bullish FVG zone that overlaps with a Fibonacci level in the 0.500-0.786 range (the "golden pocket") and the current candle closes bullish. The bearish entry is the inverse. These signals are plotted as circles below (bullish) or above (bearish) the price bars.
Visual Elements
Fibonacci Lines: Dashed lines at each active ratio with labels, harmonic ratios get glow effect
FVG Boxes: Color-coded by direction and premium/discount status, updated on mitigation
Order Block Boxes: Semi-transparent boxes with sweep tracking
Confluence Boxes: Highlighted zones where Fibonacci and FVG/OB overlap, with strength labels
Entry Signals: Circle markers for bullish/bearish entries at confluence zones
Structure Line: Line connecting the swing high and swing low
Background Coloring: Subtle trend-direction background tint
Dashboard: Displays current Fibonacci range, trend direction, active FVG count, confluence count, and entry status
Input Parameters
Fibonacci Settings:
Swing Lookback (default 50) and Pivot Strength (default 5)
Toggle each standard level (0.236, 0.382, 0.500, 0.618, 0.786) and extensions
FVG Detection:
FVG Max Age (default 50 bars)
Track Mitigation toggle
Min FVG Size (default 0.3 ATR)
Confluence Settings:
Confluence Tolerance (default 0.3 ATR)
Show Entry Signals and Confluence Strength
Min Confluence Strength (default 2)
Advanced Fibonacci:
Show Harmonic Ratios (0.127, 0.414, 0.707, 0.886)
Show Institutional Levels (volume-based levels near swings)
Show Smart Money Concepts and Order Blocks
Show Premium/Discount classification
Visual Settings:
Color Scheme: Quantum, Classic, Professional, or Minimal
Show Structure Lines, Dashboard, Glow Effects, Animation
Max Visual Elements (default 30)
How to Use This Indicator
Step 1: Let the indicator automatically identify the current swing range and draw Fibonacci levels. The structure line shows the swing high to swing low connection.
Step 2: Identify the trend direction from the structure line. In an uptrend (swing low formed after swing high), look for bullish setups at discount Fibonacci levels (0.618, 0.786). In a downtrend, look for bearish setups at premium levels.
Step 3: Watch for confluence diamonds. When a Fibonacci level overlaps with an unmitigated FVG, the confluence box appears. Higher strength confluences (3+) are more significant.
Step 4: If entry signals are enabled, wait for price to enter the confluence zone and print a confirming candle (bullish close for longs, bearish close for shorts).
Step 5: Use order blocks within the confluence zone as precise entry levels. The order block's range provides a natural stop-loss area (below the OB for longs, above for shorts).
Close-up of a high-strength confluence zone showing a 0.618 Fibonacci level overlapping with a discount FVG and a bullish order block, with an entry signal circle below the bar
Indicator Limitations
Automatic Fibonacci levels depend on pivot detection, which has an inherent delay. The swing points update only after the pivot is confirmed.
Fibonacci levels are drawn between the two most recent significant swings. In choppy markets with many equal swings, the selected range may not be the most relevant one.
FVG detection uses the standard three-bar pattern, which can produce many gaps on volatile instruments. Use the minimum size filter to manage this.
Confluence detection is proximity-based. A Fibonacci level near an FVG does not guarantee a price reaction — it identifies a zone of potential interest.
Entry signals are mechanical and do not account for broader market context. They should be used as alerts for further analysis, not as standalone trade triggers.
The indicator draws many visual elements. On busy charts, consider using the Max Visual Elements setting and disabling less critical features.
Originality Statement
This indicator is original in its automated confluence detection between Fibonacci analysis and Smart Money Concepts. While Fibonacci tools and FVG indicators exist separately, this indicator is justified because:
It programmatically detects overlap between Fibonacci levels and FVG zones, eliminating subjective visual assessment
The confluence strength scoring system quantifies how many institutional factors align at each zone
Premium/discount FVG classification adds a fair-value context layer to standard FVG detection
Volume-filtered order block detection integrated with Fibonacci levels creates a three-way confluence system
Harmonic ratio support extends beyond standard Fibonacci to cover the full spectrum of institutional trading levels
The entry signal system combines Fibonacci position, FVG presence, and candle confirmation into a structured trigger
Disclaimer
This indicator is provided for educational and informational purposes only. It is not financial advice or a recommendation to buy or sell any financial instrument. Trading involves substantial risk of loss. Fibonacci levels and FVG analysis are interpretive tools, not predictive guarantees. Always use proper risk management. The author is not responsible for any losses incurred from using this indicator.
-Made with passion by officialjackofalltrades
Penunjuk

Penunjuk
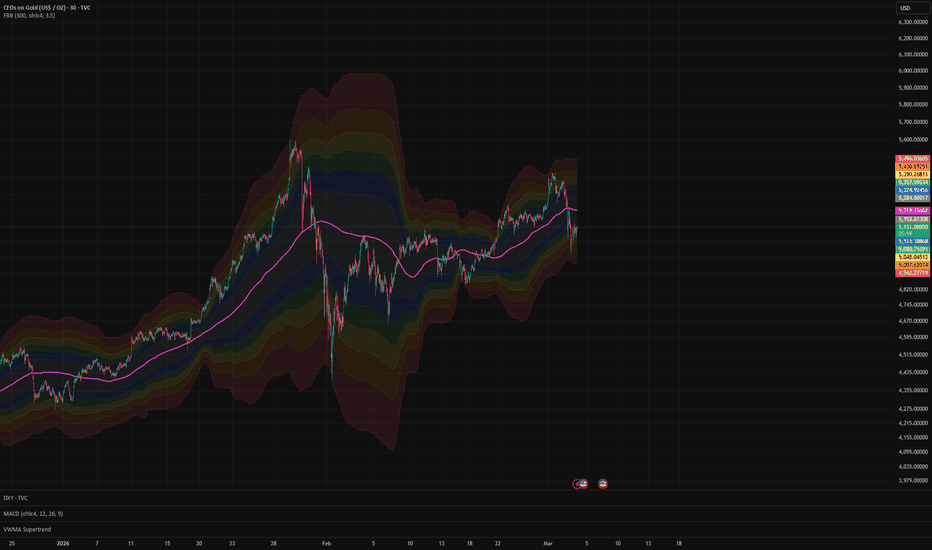
Inverse Golden Pocket MTF ZonesIGP Multi-TF Zones — Inverse Golden Pocket Mapper
Overview
IGP Multi-TF Zones identifies dynamic support and resistance by detecting when price inverts through a Fibonacci golden pocket (the 0.618–0.786 zone) on any timeframe. When price breaks through a golden pocket from one side, that zone flips from resistance to support (or vice versa), creating a high-probability area for re-entry on a retest.
The indicator overlays golden pocket zones from up to four timeframes simultaneously — your chart timeframe plus three configurable higher timeframes — so you can spot multi-timeframe confluence at a glance. Each zone tracks its lifecycle from formation through inversion or invalidation, with full visual feedback at every stage.
How it works:
Detects swing high → swing low pairs using pivot-based logic
Draws the golden pocket zone (0.618–0.786 retracement) between the swings
Monitors for inversion — a candle closing through the 0.786 level, confirming the zone has flipped
Inverted zones change color (green for long, red for short) and become active areas to watch for retests
Zones that get broken the wrong way (price closes beyond the swing origin) are invalidated and removed
This is not a signal generator — it's a zone mapper. It shows you where the important levels are across multiple timeframes and lets you apply your own entry logic.
Settings Reference
Timeframe Combo
Preset — Quick selection for which timeframes to display:
Chart Only: Only your chart's own timeframe zones
Chart + 15m: Chart TF plus 15-minute zones
Chart + 15m + 30m: Three-tier view (default)
Chart + 15m + 30m + 1h: Full four-tier stack
Custom: Manually select each HTF and toggle independently
Chart TF
Show Chart TF Zones — Master toggle for your chart's native timeframe zones. Turn off if you only want higher TF zones overlaid.
Extend Right (bars) — How many bars ahead the zone box extends past the current bar. Default: 15.
Label Position — Where the zone info label sits relative to the box: Top-Left, Top-Right, Bot-Left, or Bot-Right. Use different positions per TF to prevent overlap.
HTF 1 / HTF 2 / HTF 3
Each higher timeframe has its own self-contained settings group:
Timeframe — Which timeframe to pull swing data from (e.g., 15m, 30m, 1h, 4h, D).
Enabled — Toggle this HTF on/off.
Min Swing (pts) — Minimum size in points for a swing to qualify. Higher timeframes naturally produce larger swings, so set this proportionally. Defaults: HTF1 = 45, HTF2 = 80, HTF3 = 145.
Extend Right (bars) — Independent extend per TF. Higher TF zones represent bigger structures, so longer extensions make sense. Defaults: HTF1 = 30, HTF2 = 50, HTF3 = 80.
Freeze Inverted — When on, inverted zones stop extending after a set number of bars, freezing them in place on the chart.
Freeze After (bars) — How many bars after inversion before the zone freezes.
Label Position — Top-Left, Top-Right, Bot-Left, or Bot-Right. Set different TFs to different corners to avoid label stacking.
Swing Detection
Pivot Lookback — Number of bars on each side to confirm a swing high/low. Higher values = fewer, more significant swings. Default: 5.
Min Swing (pts) — Chart TF — Minimum point range between swing high and swing low for chart timeframe zones. Filters out insignificant micro-swings. Default: 25.
Fibonacci
Entry Level — Which fib level defines the entry edge of the golden pocket box. Options: 0.618 (default), 0.705, 0.786. The box always draws from your chosen entry level to 0.786.
Show Entry Lines — Dashed line at the entry fib level (the bottom/top edge of the GP zone).
Show CE Line — Consequent Encroachment line at the midpoint of the golden pocket (halfway between entry level and 0.786). CE is a key reaction level within the zone. Turns green/red on inversion.
Show 0.786 Line (uninverted) — Dotted line at the inversion trigger level. Visible only on potential (uninverted) zones — once the zone inverts, this line disappears since it has served its purpose.
Show 0.886 Line (uninverted) — Dotted line at the deep retracement level. Shows the extreme edge of the golden pocket. Also disappears on inversion.
Direction
Long Setups (Bearish GP) — Show zones where a bearish swing (high → low) creates a golden pocket that could invert into long support.
Short Setups (Bullish GP) — Show zones where a bullish swing (low → high) creates a golden pocket that could invert into short resistance.
IDs & Swing Labels
Show Zone IDs — Each zone gets a unique sequential ID (Z1, Z2, Z3...) shown on the zone label.
Show Swing IDs — Labels at each swing high (H) and swing low (L) that formed a zone, tagged with the zone ID and timeframe. Example: "Z42 5m H". Only swings that generated a zone are labeled. When multiple zones share the same swing point, labels merge with a "/" separator (e.g., "Z42 5m H / Z43 15m H").
Show Swing Lines — Dotted horizontal lines extending from each swing high and swing low to the right edge of the zone box. Lines turn solid on inversion.
Swing ID Size — Text size for swing labels: tiny, small, or normal.
Swing High ID Color — Color for swing high labels and lines. Default: orange.
Swing Low ID Color — Color for swing low labels and lines. Default: blue.
Zone ID Size — Text size for the zone ID portion of labels.
Zone Lifecycle
Delete Invalidated Zones — When on, zones that get broken (price closes beyond the swing origin) are immediately removed from the chart. When off, they stay visible with gray dotted borders.
Max Zones Per TF — Maximum number of zones to keep per timeframe. When exceeded, the oldest zone is removed. Default: 6. Max: 50.
Invalidation
Invalidate on Swing Break — When price closes below the swing low (for long zones) or above the swing high (for short zones), the zone is marked as invalidated. Turn off to keep all zones alive indefinitely.
Visuals
Show Zone Labels — Master toggle for all zone info labels.
Zone Label Size — Text size for zone labels: tiny, small, or normal.
Zone Label Content
Fine-grained control over what information appears in each zone's label. Every field can be toggled independently:
Zone ID (Z123) — The sequential zone identifier. Default: ON.
Timeframe + Direction — Shows the source timeframe and direction arrow, e.g., "5m GP↑" or "15m IGP↓". Default: ON.
Swing Size (42pt) — The point range of the swing that formed the zone. Default: ON.
Swing Refs — Shows which swing high and low IDs created the zone, e.g., " ". Default: OFF.
Swing Time — Timestamp (ET) of when the swing that formed the zone was detected. Default: ON.
Inversion Time — Timestamp (ET) of when the zone inverted. Only appears on inverted zones. Default: ON.
CE Value — The Consequent Encroachment price level. Default: ON.
TF Colors
Chart TF — Color for chart timeframe zones. Default: purple.
HTF 1 — Color for the first higher timeframe. Default: blue.
HTF 2 — Color for the second higher timeframe. Default: orange.
HTF 3 — Color for the third higher timeframe. Default: teal.
CE Line — Color for the Consequent Encroachment line. Default: white.
Inverted Long — Color for zones that have inverted bullish (long). Default: green.
Inverted Short — Color for zones that have inverted bearish (short). Default: red.
Zone States
Potential (colored by TF) — A golden pocket has formed but price hasn't broken through the 0.786 level yet. The zone extends to the right each bar. This is a zone to watch.
Inverted (green or red) — Price closed through the 0.786 level, confirming the golden pocket has flipped. The zone is now an active support/resistance area for retests. The CE line and swing lines turn solid. The 0.786 and 0.886 helper lines disappear.
Invalidated (gray/deleted) — Price closed beyond the swing origin, breaking the zone. Depending on settings, the zone is either deleted or shown as a gray dotted outline.
Multi-Timeframe Confluence
The real power is in stacking timeframes. When a 5m zone overlaps with a 15m and 30m zone at the same price level, that's multi-timeframe confluence — a much higher probability reaction area than any single-TF zone alone.
Higher timeframe zones draw with thicker borders and more opacity so they stand out visually. Color-coding by timeframe lets you instantly see which TFs are aligned.
Tips
Start with Chart + 15m + 30m preset and adjust from there
Set different label positions per TF (e.g., chart = Top-Left, HTF1 = Top-Right) to avoid clutter
Higher TFs need larger min swing values to filter noise — the defaults are tuned for NQ but adjust for your instrument
Use Freeze Inverted on lower TFs to keep the chart clean, turn it off on higher TFs so they keep extending
The CE line is often the first reaction level within a zone — watch for wicks to CE
When swing labels show merged IDs (Z42/Z43), that swing point is extra significant — multiple timeframes agree on it
Built for NQ futures. Works on any instrument — adjust min swing sizes to match your market's typical range. Penunjuk
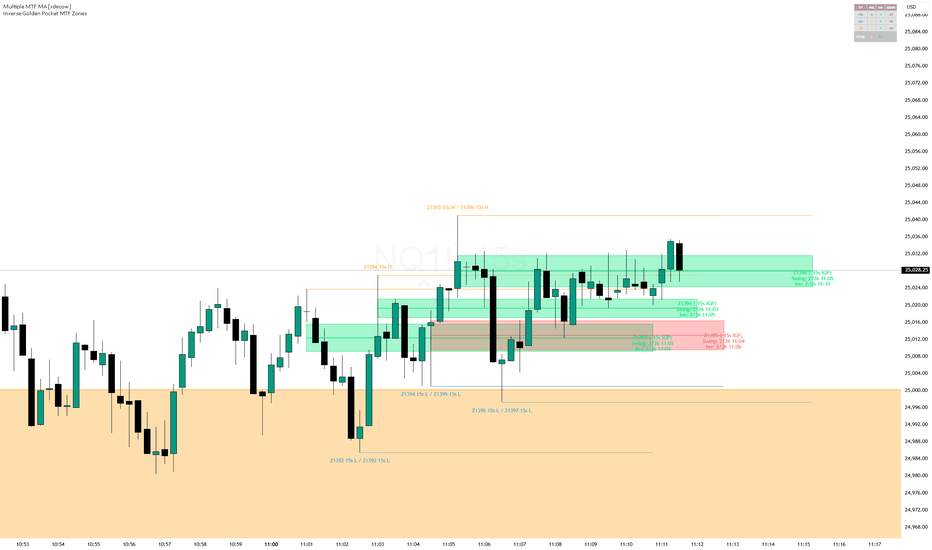
EBP + FibThis indicator automatically detects bullish and bearish EBP candles, highlights them visually, and generates an inverted Fibonacci framework used to plan continuation trades with precision.
🔍 What This Indicator Does
This tool fully automates the EBP workflow:
1. Detects Bullish & Bearish EBP Candles
Bullish EBP: price sweeps prior lows and closes strongly above the previous open/close.
Bearish EBP: price sweeps prior highs and closes strongly below the previous open/close.
EBP candles often serve as high-probability directional anchors, defining short-term and medium-term bias.
2. Plots an Inverted Fibonacci Framework
Once an EBP candle forms, the script builds a custom inverted fib projection using the candle’s high/low as anchor points.
The levels used:
1.0 – EBP extreme
0.75 / 0.65 / 0.50 / 0.25 / 0.0 – retracement levels
-0.25 / -0.50 – continuation targets
3. Clean Labeling & Custom Styling
You can customize:
Level colors
Line weights & styles
Label positions (left, middle, right)
Label text size
Vertical spacing (to separate labels from lines)
Labels show the actual fib value for fast reference during execution.
4. Directional Bias Made Simple
The indicator colors EBP candles and displays fib levels that express the market’s expected path:
Bullish: price is expected to retrace into 0.50–0.65, hold above the 1.0 extreme, and extend toward negative extensions.
Bearish: identical logic mirrored downward.
This makes bias extremely easy to read on any timeframe (1m → 4H → HTF).
5. Built-in Alerts
The indicator includes alert conditions for:
Bullish EBP detected
Bearish EBP detected
___________________________
___________________________
📈 How Traders Use This Tool
This indicator is designed for traders who want a clean, systematic framework for trading EBP-based continuation setups.
Common execution models:
🔹 Bullish EBP
A 1H or 4H bullish EBP forms → bullish bias.
Wait for price to retrace into the 0.65 or 0.50 level.
Look for lower-timeframe confirmation (BOS, sweep + reclaim).
Target 0, -0.25, or -0.50.
🔹 Bearish EBP
Mirror the process above.
This workflow is widely used in algorithmic price action, continuation models, and liquidity-based trading.
___________________________
___________________________
✨ Ideal For
Liquidity-based traders
Smart money / ICT-fluent traders
Continuation model traders
Systematic backtesters
Intraday ES/NQ/MNQ/MES traders
Crypto scalpers using HTF bias
Penunjuk

Fibonacci Confluence Grids (Levels + Time Zones) [Metrify]This script is built around a simple but often-misused idea: Fibonacci levels are only useful when the reference swing is meaningful. In practice, most traders do not fail because they “used the wrong ratio,” but because they anchored the Fib to a weak or inconsistent swing. A 0.618 level drawn from noise is still noise.
The core design of this indicator is therefore not “draw more levels” but to formalize three simple steps that we usually do inconsistently by eye:
identify an A→B swing,
filter that swing for significance, and
project both price levels and timing windows from that swing.
Once a valid swing is accepted, the script projects a configurable set of price Fibonacci levels (retracements and/or extensions) and a separate configurable sequence of time gates (bar offsets projected forward from point B). The price levels define a vertical map of potential reaction zones. The time gates define a horizontal map of potential timing windows. Used together, they create a 2D framework: not only where price may become sensitive, but also when the probability of a market event tends to increase.
Time gates: temporal structure and why “events cluster” around them
The time gate projects vertical markers forward from point B using a bar sequence (commonly Fibonacci-like). The key idea is not random, but practical timing structure.
Markets often exhibit rhythm: impulsive legs, pullbacks, consolidations, and expansions frequently have characteristic durations.
Time gates should be interpreted as attention windows: periods where you should expect the probability of a notable market event to be higher than usual. “Event” here is intentionally broad, because direction is not guaranteed:
acceleration / continuation burst
pullback completion and resumption attempt
volatility expansion after compression
reversal attempt (successful or failed)
fakeout / stop run / liquidity sweep
structural break and regime shift
This is why it’s accurate to say that significant events often occur around time gates. Not because the gate forces a reversal, but because it’s a timing checkpoint where participation and auction dynamics frequently change. Your edge comes from combining the gate with context: price location near a major Fib level, session behavior, and confirmation from price action/structure.
How to use it as a manual framework
A strong discretionary workflow is to treat this as a 2D confluence map: price zone × time window.
Start by asking: “Is the active A→B swing meaningful?” If it looks like chop, tighten filters (increase Min Size / Min Bars, or increase ZigZag reversal / pivot length). Once the swing quality is good, treat the map as a set of planned observation points.
When price approaches a major retracement (0.5/0.618/0.786) or extension (1.272/1.618), check whether a time gate is also nearby. If yes, you should expect higher information density so you watch for confirmation rather than forcing prediction.
Confirmation can be whatever your style uses: structure break, reclaim, rejection candle quality, volatility expansion, etc.
If price is mid-range (far from major fibs) and far from gates, that’s often low-quality territory for forcing trades —> your standards should be higher, not lower. Penunjuk

Automatic Fibonacci Levels [WillyAlgoTrader]Automatic Fibonacci Levels is an overlay indicator that detects the dominant swing high and swing low within the visible chart area, draws a full Fibonacci retracement and extension grid between them, highlights the Optimal Trade Entry (OTE) zone at 61.8%–78.6%, marks a target zone at the −50% to −61.8% extension, and labels four take-profit levels — all updating automatically as you scroll or zoom the chart.
Most Fibonacci tools on TradingView are either manual (you draw them yourself and they become stale as price evolves) or pivot-based (anchored to a fixed lookback period that may not match the swing you're actually looking at). This indicator takes a different approach: it uses the visible chart range as its context. It finds the highest high and lowest low within what you can currently see, determines trend direction based on which came first, and draws the full Fibonacci grid accordingly. When you scroll or zoom to a different area, the grid adapts — making it a dynamic analysis companion rather than a static drawing tool.
🔍 WHAT MAKES IT ORIGINAL
1. Visible-range swing detection. Instead of using a fixed pivot lookback or requiring manual anchor placement, the indicator scans the chart's visible window (chart.left_visible_bar_time to chart.right_visible_bar_time) to find the absolute high and low. This means the Fibonacci grid always reflects the swing structure you are currently analyzing. Zoom into a 50-bar range to see intraday retracements; zoom out to 500 bars to see the macro structure — the grid adjusts automatically. When the visible range changes (scroll or zoom), swing detection resets and recalculates.
2. Automatic trend direction from swing sequence. The indicator determines bullish or bearish bias by comparing when the swing low and swing high occurred. If the swing low formed first and the swing high formed later, the trend is classified as bullish (retracement levels are drawn down from the high, extensions project upward). If the swing high came first, the trend is bearish (retracement down from the low, extensions project downward). No manual input is needed — the grid orientation follows the price structure.
3. OTE Entry Zone + Target Zone as highlighted boxes. Two key zones are highlighted with semi-transparent boxes:
— Entry Zone (61.8%–78.6%) : the Optimal Trade Entry area from ICT/SMC methodology — the deep retracement zone where institutional re-entry is most likely
— Target Zone (−50% to −61.8%) : the extension zone where breakout moves frequently reach
Both zones have configurable colors and optional text labels ("ENTRY ZONE" / "TARGET ZONE") inside them. Zone-touch alerts fire when price enters either box for the first time.
4. Four labeled take-profit levels. TP labels are placed at key Fibonacci levels to provide a structured scale-out framework:
— TP1 at 38.2% (first retracement target — conservative exit)
— TP2 at 0% (full swing retest — swing high in uptrend, swing low in downtrend)
— TP3 at −27.2% (first Fibonacci extension)
— TP4 at −61.8% (deep extension — runner target)
Each TP level is only displayed if the corresponding Fibonacci line is enabled, keeping the chart clean.
5. 16 individually toggleable levels. The indicator supports a comprehensive set of levels: 0%, 23.6%, 38.2%, 50%, 61.8%, 70.6%, 78.6%, 100% (standard retracements), plus 18%, 150%, 200% (deep retracements), and −18%, −27.2%, −50%, −61.8%, −100% (extensions). Each level can be toggled on or off independently, so you can configure exactly the grid density you prefer — from a minimal 4-level setup to a full 16-level deep analysis.
⚙️ HOW IT WORKS
Swing detection:
On every bar, the script checks whether the current bar falls within the chart's visible time window (using chart.left_visible_bar_time and chart.right_visible_bar_time). Within this window, it tracks the highest high and lowest low, along with their bar indices. When the visible window changes (scroll/zoom), all swing data resets and recalculates from scratch. This ensures the grid always reflects your current view.
Trend direction:
If swingLowBarIdx < swingHighBarIdx (low came first), the trend is classified as bullish — Fibonacci levels count downward from the swing high (0% = high, 100% = low), and extensions project above the high. If the high came first, the trend is bearish — levels count upward from the swing low, extensions project below.
Level calculation:
Each Fibonacci level is calculated as: price = anchor ± (swingRange × ratio), where the anchor and direction depend on the trend bias. For a bullish trend: 0% = swingHigh, 61.8% = swingHigh − range × 0.618, −50% = swingHigh + range × 0.5. For bearish: mirrored.
Zone detection:
The Entry Zone (61.8%–78.6%) and Target Zone (−50% to −61.8%) are computed as price ranges. On each confirmed bar, the script checks if the close falls within either zone. A zone-touch alert fires on the first confirmed bar inside the zone (no repeated alerts while price stays in the zone). The inEntryZone / inTargetZone state resets when price leaves, allowing re-entry detection.
Drawing:
All visual elements (lines, labels, boxes) are drawn on barstate.islast and cleaned up on each redraw to prevent accumulation. Lines extend from 2 bars before the current bar to the label offset position. Zones use extend.right so they remain visible as new bars form.
📖 HOW TO USE
Reading the chart:
— Orange horizontal lines = Fibonacci levels (retracement + extensions)
— Optional % labels next to each line = level identification
— Gold semi-transparent box = Entry Zone (61.8%–78.6% OTE)
— Gold semi-transparent box with "TARGET ZONE" = extension target (−50% to −61.8%)
— TP1–TP4 labels = structured take-profit levels
— Optional diagonal line = swing connection (low-to-high or high-to-low)
Suggested workflow:
— Zoom to the swing you want to analyze — the grid adapts automatically
— In a bullish trend: look for buy entries when price retraces into the Entry Zone (61.8%–78.6%), with stop loss below 100% (swing low), targeting TP1 (38.2%) → TP2 (0% / swing high) → TP3 (−27.2%) → TP4 (−61.8%)
— In a bearish trend: look for sell entries when price retraces up into the Entry Zone, stop above swing high, targeting downward extensions
— Use the dashboard to confirm trend direction and monitor whether price is currently in the Entry or Target zone
— Set alerts for zone touches to get notified when price reaches OTE or target levels without watching the chart
Customization tips:
— For a clean chart: enable only 0%, 61.8%, 78.6%, 100%, −27.2%, −61.8% — this gives you the OTE boundaries, swing anchors, and two extension targets
— For deep analysis: enable all 16 levels to see the full Fibonacci structure
— Adjust Label Offset to move level labels further right if your chart is crowded
— Toggle Show Diagonal Swing Line to visually confirm which high/low pair is being used
⚙️ KEY SETTINGS REFERENCE
— Show All Elements (default On): master toggle for all Fibonacci visuals
— Line Width (default 1): thickness of Fibonacci lines (1 = subtle, 5 = bold)
— Line Style (default Dashed): solid, dashed, or dotted
— Label Offset (default 17 bars): how far right of the last bar to place labels
— Individual Levels : 16 toggleable levels from 200% to −100%
— Show Entry Zone (default On): highlight the 61.8%–78.6% OTE box
— Show Target Zone (default On): highlight the −50% to −61.8% extension box
— Show Text in Zones (default On): display "ENTRY ZONE" / "TARGET ZONE" labels
— Show TP Labels (default On): display TP1–TP4 at key levels
— Show Level % Labels (default Off): display percentage text next to each line
📊 Dashboard
The info panel displays:
— Trend direction (Bullish / Bearish) based on swing sequence
— Signal status (Entry Zone / Target Zone / —) when price enters a key zone
— Swing range in price units
— Current timeframe and indicator version
🔔 Alerts
Two alert conditions (each fires once per zone entry on bar close):
— Entry Zone touch : price closes inside the 61.8%–78.6% retracement zone
— Target Zone touch : price closes inside the −50% to −61.8% extension zone
Both support standard text and JSON webhook format.
⚠️ IMPORTANT NOTES
— This indicator anchors to the visible chart range — it recalculates when you scroll or zoom. This is a feature, not a bug: it lets you analyze any swing by simply framing it on your screen. However, it means the grid will change if you move the chart.
— Fibonacci levels are not predictive — they are reference points based on the measured swing range. Price may or may not react at any given level.
— The Entry Zone (61.8%–78.6%) is derived from the OTE concept used in ICT/SMC methodology. It represents a high-probability retracement area, but no retracement zone guarantees a reversal.
— Zone alerts require bar-close confirmation and fire once per entry — they do not repeat while price remains in the zone.
— Works across all asset classes and timeframes. No volume data required. Penunjuk

Adaptive Pivot Structure [WillyAlgoTrader]Adaptive Pivot Structure (APS) is an overlay indicator that maps market structure in real time by detecting swing pivots, classifying structural breaks (BOS / CHoCH), tracking missed reversal levels, and projecting a dynamic Fibonacci grid between the last confirmed pivot and the live forming extreme.
Most pivot-based tools plot swing points with a fixed delay and leave the trader to interpret structure manually. APS automates the full workflow: it detects pivots, grades their strength against ATR, identifies whether the structure is continuing (BOS) or reversing (CHoCH), keeps track of levels that price skipped over, and stretches a Fibonacci retracement grid that updates bar-by-bar as the current swing extends — giving you an always-current picture of where price sits within the swing.
🔍 WHAT MAKES IT ORIGINAL
APS combines five analytical layers into a single coherent overlay that would otherwise require multiple separate indicators:
1. ATR-graded pivot detection. Every swing high and low is measured against the current ATR to classify it as Strong (swing > 1.5× ATR) or Weak. You can filter the display to show only strong pivots, only weak ones, or all — allowing you to strip noise on lower timeframes while keeping full detail on higher ones.
2. Automated BOS / CHoCH classification. The indicator continuously compares each new pivot high to the previous pivot high, and each new pivot low to the previous pivot low. When a higher high forms in an existing uptrend, the script labels it as a Break of Structure (BOS ↑) — trend continuation. When a higher high forms after a downtrend, it labels a Change of Character (CHoCH ↑) — potential reversal. The same logic applies in reverse for bearish breaks. This removes the subjectivity of manually drawing and labeling structure shifts.
3. Missed reversal tracking. When two consecutive pivots form on the same side (e.g. two pivot highs without an intervening pivot low), the "missed" pivot low between them is flagged with a ◇ marker and extended as a dotted horizontal level until price breaks it. These missed levels often act as hidden support/resistance that conventional pivot tools ignore entirely.
4. Live (potential) pivot tracking. Instead of waiting for full confirmation (which inherently lags by N bars), APS tracks the running extreme since the last confirmed pivot and plots it in real time as a "potential next pivot" with a dashed zigzag extension. This gives you immediate visual feedback on how far the current swing has traveled and where the Fibonacci grid is anchored — without pretending the pivot is confirmed.
5. Dynamic Fibonacci grid. A full Fibonacci retracement (0, 0.236, 0.382, 0.5, 0.618, 0.786, 1.0 — with optional 1.272 and 1.618 extensions) is drawn between the last confirmed pivot and the live pivot. The grid redraws every bar as the live extreme moves, so the retracement levels always reflect the current swing range. The OTE (Optimal Trade Entry) zones at 0.236–0.382 and 0.618–0.786 are highlighted with a fill to make them easy to spot at a glance.
⚙️ HOW IT WORKS
Pivot detection:
Pivots are identified using ta.pivothigh() and ta.pivotlow() with a user-defined lookback (Pivot Length). A pivot high is confirmed when the bar has N lower highs on both sides; a pivot low when the bar has N higher lows on both sides. This means confirmed pivots appear with a delay of N bars — this is inherent to the standard pivot detection algorithm.
Strength grading:
Once a pivot is detected, the script measures the absolute price distance from the previous pivot to the current one. If this distance exceeds 1.5× the current ATR value, the pivot is classified as "Strong"; otherwise "Weak." A minimum swing size filter (Min Swing Size, expressed as an ATR multiple) lets you suppress insignificant swings entirely.
Structure logic:
The indicator maintains a running structure direction variable. When a new pivot high exceeds the previous pivot high and the current structure is already bullish, it triggers a BOS ↑. If the structure was bearish, it triggers a CHoCH ↑ (reversal). Mirror logic applies for lows. This follows standard Smart Money Concepts methodology.
Missed pivot logic:
Between any two consecutive same-side pivots, the indicator records the highest high or lowest low that occurred in the gap. This "missed" extreme is marked and extended as a horizontal level. The level is automatically removed from the chart when price closes through it — keeping only active levels visible.
Live pivot:
After each confirmed pivot, the script starts tracking the running high (if expecting a pivot high next) or running low (if expecting a pivot low). This value updates every bar and serves as one anchor of the Fibonacci grid. A "▲?" or "▼?" label and a dashed line show where this potential pivot currently sits.
Fibonacci grid:
The retracement is calculated between the lower and upper anchor of the current swing (using the confirmed pivot on one side and the live extreme on the other). All seven standard ratios are drawn as horizontal lines from the earlier pivot's bar index to 5 bars into the future. The 0.5 and 0.618 levels are drawn thicker and in a highlight color for emphasis.
⚠️ REPAINTING BEHAVIOR — IMPORTANT
This indicator is designed as a live analysis tool , not a backtesting signal generator. The following elements will change on the current bar:
— The Live Pivot marker moves as the running extreme updates
— The Fibonacci grid redraws as the live anchor moves
— BOS/CHoCH labels based on pivots inherit the standard pivot detection delay
Confirmed pivots themselves do not repaint — once a bar is no longer within the pivot lookback window, its pivot status is final. The alert system includes a "Confirmed Only" toggle (on by default) that restricts alerts to bar-close events, ensuring no repainting alerts reach your trading bot.
📖 HOW TO USE
Reading the chart:
— ▲ / ▽ labels at swing lows = confirmed pivot lows (filled = Strong, outline = Weak)
— ▼ / △ labels at swing highs = confirmed pivot highs (filled = Strong, outline = Weak)
— ◇ markers = missed reversals (cyan for missed lows, orange for missed highs)
— Dotted horizontal lines from ◇ markers = active missed levels (auto-removed when broken)
— "BOS ↑/↓" yellow labels = Break of Structure (trend continuation)
— "CHoCH ↑/↓" green/red labels = Change of Character (potential reversal)
— Purple dashed line with "▲?" or "▼?" = live potential pivot (updates every bar)
— Fibonacci lines with OTE zone fills = dynamic retracement grid
Suggested workflow:
— Use CHoCH labels as early warning of trend reversals — then look for entries in the Fibonacci discount/premium zones
— Use BOS labels to confirm trend continuation — look for pullback entries at 0.618–0.786 retracement
— Watch the dashboard's "Fib Zone" readout: Discount (below 38.2%) favors buys, Premium (above 61.8%) favors sells, Equilibrium suggests waiting
— Missed reversal levels act as hidden S/R — watch for reactions when price revisits them
Timeframe guidance:
— Scalping (1–5min): Pivot Length 3–5, Min Swing 0.5 ATR, Strong Only filter
— Intraday (15min–1H): Pivot Length 5–10, default settings
— Swing (4H–Daily): Pivot Length 10–20, show all strengths for full context
⚙️ KEY SETTINGS REFERENCE
— Pivot Length (default 5): bars left/right for pivot detection — lower = faster but noisier
— ATR Length (default 14): period for strength grading and minimum swing filter
— Min Swing Size (default 0.0): minimum swing as ATR multiple — increase to filter small moves
— Pivot Strength Filter (default All): show All / Strong Only / Weak Only
— Max Active Levels (default 10): maximum missed-reversal horizontal lines displayed
— Show Live Pivot (default On): toggle the real-time potential pivot tracker
— Show Fibonacci Grid (default On): toggle the dynamic retracement overlay
— Show Extensions (default Off): add 1.272 and 1.618 extension levels
— Show Fib Zone Fill (default On): highlight OTE zones (0.236–0.382 and 0.618–0.786)
— Alerts: Confirmed Only (default On): restrict alerts to bar-close confirmation — recommended for bots
📊 Dashboard
The info panel (adjustable to any chart corner) displays:
— Current market structure (Bullish / Bearish / Ranging)
— Last confirmed pivot type and price
— Live pivot direction and price
— Number of active missed-reversal levels
— Last PH and PL values
— Fib Zone classification (Premium / Discount / Equilibrium) with percentage
— Current timeframe and indicator version
⚠️ DISCLAIMER
— This tool is intended for live chart analysis and structure mapping — it is not a standalone entry/exit signal system.
— The live pivot and Fibonacci grid are designed to repaint by nature — they track the forming swing in real time. Do not use them for backtesting.
— Past pivot patterns and structure shifts do not guarantee future price behavior.
— Always combine structural analysis with proper risk management and additional confluence. Penunjuk

Harmonic Pulse Tracker [JOAT]Harmonic Pulse Tracker
Introduction
The Harmonic Pulse Tracker is an open-source institutional-grade wave and rhythm analysis system that combines Elliott Wave principles, Fibonacci harmonic analysis, WaveTrend oscillator mechanics, and cycle detection into a unified oscillator. This sophisticated system integrates multiple proven methodologies to identify high-probability reversal zones where harmonic patterns, wave cycles, and momentum indicators converge.
The indicator is designed for traders who understand that market movements follow natural harmonic patterns and cyclical rhythms. By synthesizing detrended price oscillation, Fibonacci retracement levels, WaveTrend momentum analysis, money flow dynamics, and volume confirmation, this tool helps identify structural market turning points with mathematical precision.
Why This Integration Exists
This indicator combines six distinct analytical frameworks that complement each other:
Harmonic Wave Analysis: Uses detrended price oscillation combined with Ehlers cycle detection to identify natural market rhythms
Fibonacci Harmonic Levels: Calculates dynamic Fibonacci retracements and extensions based on wave swing points
WaveTrend Oscillator: Implements LazyBear's WaveTrend algorithm for momentum and overbought/oversold detection
Money Flow Integration: Tracks institutional buying and selling pressure through Money Flow Index analysis
Volume Analysis: Confirms wave movements with volume spikes and directional volume pressure
Elliott Wave Counting: Simplified wave counting system to identify impulse and corrective wave phases
Each component addresses different aspects of market rhythm and harmony. The harmonic wave engine identifies natural price cycles, Fibonacci levels provide mathematical support/resistance, WaveTrend shows momentum extremes, money flow reveals institutional activity, volume confirms genuine moves, and Elliott Wave counting provides structural context. Together, they create a multi-dimensional view of market harmony and discord.
Core Components Explained
1. Harmonic Wave Engine
The core wave calculation combines two advanced techniques:
DPO (Detrended Price Oscillator) = close - sma(close, length/2 + 1)
Ehlers Cycle Component = High-pass filtered price with cycle smoothing
Harmonic Wave = Smoothed DPO + (Cycle Component * 0.5)
This creates a wave that removes trend bias while preserving cyclical components, revealing the natural harmonic rhythm of price movement.
Wave Derivatives:
- Wave Momentum: Rate of change in harmonic wave
- Wave Acceleration: Rate of change in momentum
- Wave Velocity: Percentage rate of change over 5 periods
These derivatives help identify wave phase transitions and momentum shifts before they become obvious in price.
2. Fibonacci Harmonic Level System
The indicator calculates dynamic Fibonacci levels based on harmonic wave swing points:
Standard Retracements:
- 23.6%, 38.2%, 50.0%, 61.8%, 78.6% of wave range
Extensions:
- 127.2%, 161.8%, 261.8% beyond wave high
Golden Pocket Zone:
The critical 61.8% to 78.6% retracement zone where most harmonic reversals occur. This zone represents the mathematical sweet spot where Fibonacci ratios converge with natural market rhythm.
Harmonic Resonance Detection:
The system identifies when price is within 5% of key Fibonacci levels and calculates confluence scores when multiple levels align.
3. WaveTrend Oscillator Integration
Implements the proven WaveTrend algorithm:
ESA = ema(hlc3, channel_length)
D = ema(abs(hlc3 - ESA), channel_length)
CI = (hlc3 - ESA) / (0.015 * D)
WT1 = ema(CI, average_length)
WT2 = sma(WT1, 4)
WaveTrend Signals:
- Crossovers in oversold zone (< -50): Bullish reversal signals
- Crossunders in overbought zone (> 50): Bearish reversal signals
- Regular crossovers: Momentum shift confirmation
4. Money Flow Analysis
Tracks institutional buying and selling pressure:
MFI = Money Flow Index over specified period
MFI Centered = (MFI - 50) * multiplier
- Positive MFI: Institutional buying pressure
- Negative MFI: Institutional selling pressure
- Strong MFI: Absolute value > 25 indicates significant institutional activity
5. Volume Analysis Engine
Comprehensive volume analysis including:
Volume Spikes: Volume > Average Volume * Threshold
Volume Ratio: Current volume / Average volume
Volume Strength: Normalized volume intensity (0-100)
Directional Volume:
- Bullish Volume Spike: High volume + green candle
- Bearish Volume Spike: High volume + red candle
6. Elliott Wave Phase Detection
Simplified wave analysis to identify market structure:
Impulse Waves:
- Impulse Up: Positive momentum + acceleration + velocity
- Impulse Down: Negative momentum + acceleration + velocity
Corrective Waves:
- Mixed momentum and acceleration signals indicating consolidation
Wave Counting:
Basic 5-wave count system that resets after wave 5 completion, helping identify potential reversal zones.
Multi-Factor Confluence Scoring System
The indicator calculates a real-time confluence score (0-100) by weighting each component:
Confluence Score Components:
- Fibonacci Zone: Up to 20 points (Golden Pocket = 20, other Fib levels = 4 each)
- Wave Strength: Up to 20 points (based on wave momentum intensity)
- WaveTrend: Up to 20 points (extreme zone crossovers = 20, regular = 15)
- Money Flow: Up to 20 points (strong institutional activity = 20)
- Volume: Up to 20 points (volume spikes = 20, elevated = 15)
Scores above 80 indicate exceptional confluence for potential trades. The dashboard displays individual component scores for transparency.
Perfect Harmonic Alignment Detection
The system identifies rare "Perfect Harmonic" setups when:
- Price is in Golden Pocket zone
- Impulse wave phase is active
- Wave strength > 70
- WaveTrend crossover in extreme zone
- Positive money flow (for bullish) or negative (for bearish)
- Volume spike confirmation
These setups represent the highest probability reversal opportunities.
Visual Elements
Harmonic Wave: Main oscillator with gradient coloring based on wave position
Wave Momentum: Histogram showing rate of change in wave movement
Fibonacci Levels: Key retracement and extension levels (38.2%, 50%, 61.8%, 78.6%, 161.8%)
Golden Pocket Zone: Highlighted area between 61.8% and 78.6% levels
WaveTrend Lines: WT1 and WT2 with overbought/oversold zones
Money Flow Columns: Institutional buying/selling pressure visualization
Volume Strength: Volume intensity histogram
Signal Markers: Perfect Harmonic signals and strong confluence alerts
Background Zones: Golden Pocket and Perfect Signal highlighting
Dashboard: Real-time display of all component values and confluence score
How Components Work Together
The integration creates a harmonic analysis approach:
Layer 1 - Wave Rhythm: Harmonic wave identifies natural market cycles and turning points
Layer 2 - Mathematical Levels: Fibonacci ratios provide precise support/resistance zones
Layer 3 - Momentum Context: WaveTrend shows overbought/oversold extremes
Layer 4 - Institutional Flow: Money flow reveals smart money positioning
Layer 5 - Volume Confirmation: Volume analysis validates genuine moves vs noise
Layer 6 - Wave Structure: Elliott Wave context provides structural framework
Example scenario: Harmonic wave reaches Golden Pocket zone (Layer 1 + 2) during WaveTrend oversold crossover (Layer 3) with positive money flow (Layer 4) and volume spike (Layer 5) in corrective wave phase (Layer 6). This confluence suggests exceptional reversal probability.
Input Parameters
Wave Settings:
Wave Length: Period for harmonic wave calculation (default: 34)
Smoothing Period: Wave smoothing factor (default: 5)
WaveTrend Settings:
Show WaveTrend: Toggle WaveTrend display
WT Channel Length: Channel calculation period (default: 9)
WT Average Length: Smoothing period (default: 12)
WT Overbought: Overbought threshold (default: 50)
WT Oversold: Oversold threshold (default: -50)
Money Flow Settings:
Show Money Flow: Toggle money flow display
MFI Length: Money Flow Index period (default: 14)
MFI Multiplier: Sensitivity adjustment (default: 1.5)
Volume Settings:
Show Volume Analysis: Toggle volume indicators
Volume Spike Threshold: Multiplier for spike detection (default: 1.5)
Fibonacci Settings:
Show Fibonacci Levels: Toggle Fibonacci level display
Fibonacci Lookback: Period for swing point calculation (default: 100)
Cycle Settings:
Cycle Period: Ehlers cycle detection period (default: 20)
Cycle Smoothing: Cycle component smoothing (default: 3)
How to Use This Indicator
Step 1: Identify Wave Phase
Check the dashboard for current wave phase (Impulse Up/Down, Corrective, Neutral) and Elliott Wave count.
Step 2: Locate Fibonacci Zones
Look for price approaching key Fibonacci levels, especially the Golden Pocket zone (61.8%-78.6%).
Step 3: Check WaveTrend Position
Identify if WaveTrend is in extreme zones and watch for crossovers in oversold/overbought areas.
Step 4: Analyze Money Flow
Confirm institutional positioning through Money Flow Index - positive for bullish setups, negative for bearish.
Step 5: Verify Volume Confirmation
Ensure volume supports the move - look for volume spikes in the direction of the expected reversal.
Step 6: Review Confluence Score
Check the dashboard confluence score. Scores above 80 indicate high-probability setups.
Step 7: Wait for Perfect Harmonic Signals
The highest probability trades occur when "PERFECT" signals appear, indicating all factors are aligned.
Best Practices
Use on 15-minute to 4-hour timeframes for optimal harmonic detection
Focus on Golden Pocket zone entries - this is where most harmonic reversals occur
Wait for WaveTrend crossovers in extreme zones for best risk:reward
Confirm with money flow direction - institutional flow should support the trade direction
Volume spikes add significant confirmation to harmonic setups
Perfect Harmonic signals are rare but offer exceptional probability
Wave 5 completions often coincide with major reversal opportunities
Use confluence scores above 80 as primary filter for trade selection
Indicator Limitations
Harmonic patterns can extend beyond expected Fibonacci levels
Perfect Harmonic signals are rare - patience is required for best setups
Wave counting is simplified and may not match complex Elliott Wave analysis
Fibonacci levels are dynamic and may adjust as new swing points form
Money flow can remain extreme longer than expected during strong trends
Volume confirmation may be less reliable in low-liquidity markets
Confluence scoring is mathematical, not predictive of future performance
Requires understanding of harmonic analysis principles for effective use
Technical Implementation
Built with Pine Script v6 using:
Advanced detrended price oscillation with Ehlers cycle detection
Dynamic Fibonacci calculation based on swing point analysis
LazyBear WaveTrend algorithm implementation
Real-time Money Flow Index with institutional bias detection
Volume analysis with spike detection and directional confirmation
Simplified Elliott Wave counting with phase detection
Multi-factor confluence scoring system with component weighting
Anti-overlap signal filtering to prevent signal clustering
The code is fully open-source and can be modified to suit individual trading styles and preferences.
Originality Statement
This indicator is original in its harmonic integration approach. While individual components (DPO, Fibonacci, WaveTrend, MFI, volume analysis, Elliott Wave) are established concepts, this integration is justified because:
It synthesizes six distinct methodologies that address different aspects of market harmony
The harmonic wave engine combines detrended oscillation with cycle detection for superior rhythm analysis
Dynamic Fibonacci levels adjust to current wave structure rather than using static retracements
Golden Pocket zone identification provides mathematical precision for reversal timing
Multi-factor confluence scoring quantifies setup quality across all components
Perfect Harmonic detection identifies rare, high-probability reversal opportunities
Each component contributes unique harmonic information: wave analysis reveals natural cycles, Fibonacci provides mathematical levels, WaveTrend shows momentum extremes, money flow indicates institutional positioning, volume confirms genuine moves, and Elliott Wave provides structural context. The integration's value lies in identifying moments when all these harmonic factors align simultaneously.
Disclaimer
This indicator is provided for educational and informational purposes only. It is not financial advice or a recommendation to buy or sell any financial instrument. Trading involves substantial risk of loss and is not suitable for all investors.
Harmonic analysis and Fibonacci levels are mathematical concepts that do not guarantee future price movement. Past performance and backtested results do not guarantee future results. Market conditions change, and harmonic patterns that worked historically may not work in the future.
Always use proper risk management, including stop losses and position sizing appropriate for your account size and risk tolerance. Never risk more than you can afford to lose. Consider consulting with a qualified financial advisor before making investment decisions.
The author is not responsible for any losses incurred from using this indicator. Users assume full responsibility for all trading decisions made using this tool.
-Made with passion by officialjackofalltrades Penunjuk