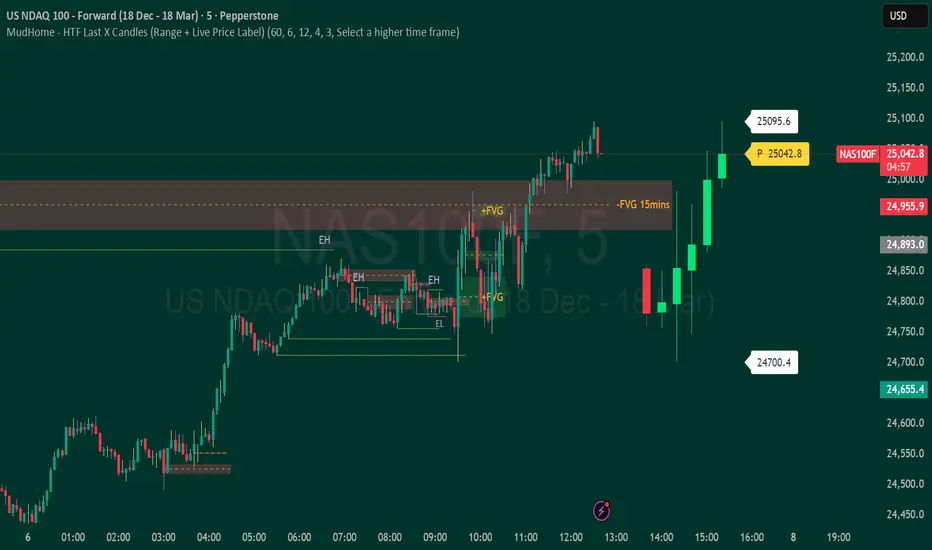
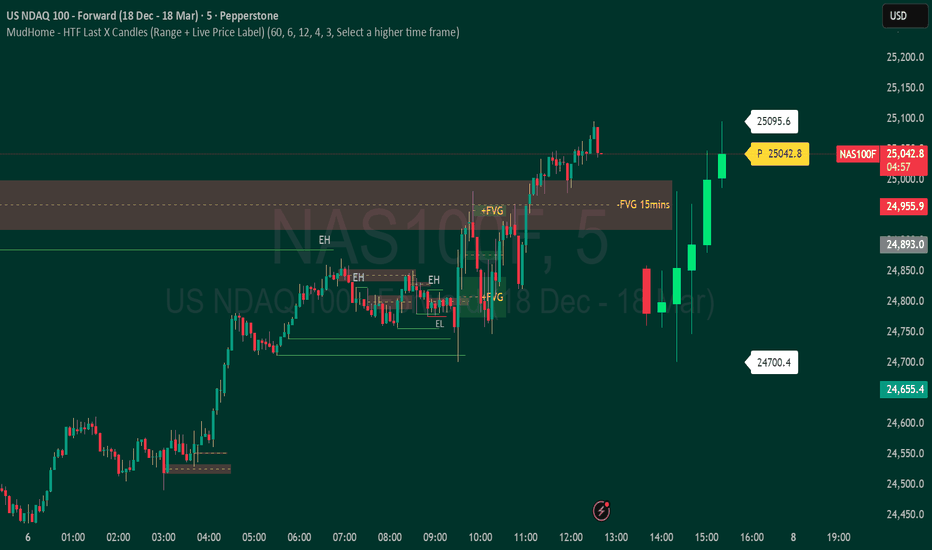
MudHome - HTF Last X Candles (Range + Live Price Label)This indicator provides a live Higher Timeframe (HTF) context overlay on lower-timeframe charts by displaying the most recent HTF candles as a compact inset, alongside a dynamically updating price range.
It plots the last N HTF candles (up to 10), including the currently forming HTF candle, arranged left-to-right in standard chart order. This allows traders to visually track HTF structure, expansion, and volatility in real time while executing on lower timeframes.
Key Features
Displays the most recent HTF candles, including the live, still-forming candle
Candles are drawn to the right of price, preserving chart clarity
Automatically calculates and displays the HTF range high and low across the selected candles
Range labels update dynamically as the current HTF candle expands
Shows a live current-price label, updating tick-by-tick
Clean, minimal presentation — no cluttered OHLC labels
Fully configurable candle spacing, body width, colors, and offsets
Smart Validation
The indicator only renders when the selected timeframe is higher than the chart timeframe
If not, a clear prompt is shown: “Select a higher time frame”
Ideal Use Cases
HTF bias and context on LTF execution charts
Range expansion and contraction analysis
ICT-style dealing range, premium/discount framing
Session and structure awareness without switching timeframes
This tool is designed to act as a live HTF context box, keeping higher-timeframe structure visible at all times while you focus on execution. Penunjuk
Penunjuk
ICT Kill Zones PanelICT Kill Zones Panel - Clean & Simple Trading Sessions Indicator
A simple, objective indicator to identify ICT Kill Zones with real-time status and smart visual highlighting based on New York timezone.
WHAT MAKES IT DIFFERENT:
Traditional indicators clutter charts with dozens of colored boxes from past sessions. This tool provides a clean alternative:
- Real-time information panel showing current active session
- Smart dual-transparency painting: ACTIVE session displays stronger (more visible), historical sessions display softer (less clutter)
- Accurate session timing: Only shows active when session is actually happening
- Mobile-optimized size for phone trading
- Professional interface that doesn't interfere with price action
FEATURES:
- Real-Time Detection: Panel uses actual NYC time (timenow) to show which session is active NOW
- Precise Timing: Sessions activate ONLY during their specific time windows - all zones show inactive outside trading hours
- Smart Visual System: Currently active session has stronger background color, past sessions are softer
- Color Synchronization: Active session color in panel matches chart background color automatically
- Clean Highlighting: Optional background painting with adjustable transparency levels
- Full Customization: 9 panel positions, 4 sizes (Mobile/Small/Normal/Large), fully customizable colors
- All Sessions: Asian (20:00-01:00), London (02:00-05:00), NY AM (08:00-11:00), London Close (10:00-12:00), NY PM (13:00-16:00)
KILL ZONE SCHEDULE (NYC TIME):
1. Asian: 20:00 - 01:00 (5 hours)
2. INACTIVE: 01:00 - 02:00
3. London: 02:00 - 05:00 (3 hours)
4. INACTIVE: 05:00 - 08:00
5. NY AM: 08:00 - 11:00 (3 hours) - overlaps with London Close
6. London Close: 10:00 - 12:00 (2 hours) - overlaps with NY AM
7. INACTIVE: 12:00 - 13:00
8. NY PM: 13:00 - 16:00 (3 hours)
9. INACTIVE: 16:00 - 20:00
During INACTIVE periods, all sessions show as inactive in the panel.
COLOR SYSTEM:
ALL COLORS ARE FULLY CUSTOMIZABLE:
- Each Kill Zone has its own color setting (Asian, London, NY AM, London Close, NY PM)
- Default colors shown in screenshots are just examples
- Active session in panel: displays with its assigned color (e.g., green for NY AM by default)
- Same color appears on chart background with adjustable transparency
- Inactive sessions in panel: display with gray (also customizable)
- Panel background and text colors: fully customizable
- Choose colors that match your chart theme
The green color shown for active sessions in examples is the DEFAULT color for NY AM - you can change it to any color you prefer.
TRANSPARENCY SYSTEM EXPLAINED:
ACTIVE SESSION (happening right now):
- Default 70% transparency = STRONGER/MORE VISIBLE background
- Instantly shows which Kill Zone is unfolding
- Panel row highlights with the session's assigned color
- Chart background displays same color stronger
HISTORICAL SESSIONS (already passed):
- Default 90% transparency = SOFTER/LESS VISIBLE background
- Provides context without visual clutter
- Panel rows show gray (inactive color)
- Both transparency levels fully adjustable in settings
MOBILE OPTIMIZED:
Select "Mobile" panel size for optimal viewing on phone screens - compact layout perfect for smaller displays.
REPAINTING BEHAVIOR:
Panel Status & Colors: Update in real-time as sessions change - panel color switches to match the new active session (intentional for current awareness)
Active Session Highlighting: Adjusts in real-time to show current session stronger on chart
Historical Background Colors: Do NOT repaint - accurately mark when sessions occurred
Session Activation: Sessions activate and deactivate precisely at their scheduled times
CUSTOMIZATION:
- Panel: 9 positions, 4 sizes including Mobile
- Colors: Individual customizable color for each Kill Zone
- Panel Colors: Customizable background, text, and inactive zone colors
- Transparency: Separate controls for active (default 70%) and historical (default 90%) sessions
- Toggle: Show/hide individual zones
- Chart Painting: On/off
HOW TO USE:
1. Add to chart - panel appears top-right
2. Active session displays with its assigned color in panel and stronger on chart
3. Panel shows all zones as inactive during non-trading hours (accurate timing)
4. Panel color automatically changes when new session begins
5. Adjust all colors in settings to match your preferences
6. Adjust transparency settings for optimal visibility
7. Use "Mobile" size for phone trading
BEST FOR:
- ICT traders timing entries during high-liquidity periods
- Smart money concepts (FVG, Order Blocks, Liquidity)
- Traders who want clean charts with essential information
- Traders needing accurate session timing without false signals
- Mobile traders needing compact, clear displays
- Traders who want to customize colors to match their chart theme
TECHNICAL:
- Works on all timeframes
- Built with Pine Script v6
- NYC timezone with automatic DST adjustment
- Precise hour-based session detection
- Lightweight and optimized
- Open source
FEEDBACK WELCOME:
All comments, critiques, and suggestions are welcome! Your input helps improve this tool for the trading community.
Created by ivrank13 for traders who value simplicity, accuracy, and clean charts.
© 2026 ivrank13. All Rights Reserved.
#ICT #KillZones #SmartMoney #ForexSessions #CleanCharts #MobileTrading #CustomColors #AccurateTiming Penunjuk

Inside Bar Zones by AAK (V6)📦 Smart Inside Bar Zones
Smart Inside Bar Zones is a price-action–based indicator designed to automatically detect, track, and visualize inside bar consolidation zones with full historical context.
Instead of marking single inside candles, this indicator groups consecutive inside bars into structured zones, locking the original mother candle range and extending it until price breaks out. This allows traders to clearly identify areas of compression, balance, and potential expansion.
🔍 Key Features
Automatic Inside Bar Detection
Identifies inside bars using candle bodies within the mother candle range, with an optional tick buffer.
Smart Zone Creation
Consecutive inside bars are grouped into a single zone, anchored to the original mother candle.
Unlimited Historical Storage (Data)
All previous inside bar zones are stored internally, enabling long-term analysis and backtesting.
Safe & Optimized Drawing
Zones are drawn using recyclable boxes to respect TradingView object limits while maintaining performance.
Highlight Inside Bars
Optional candle coloring for quick and clear visual confirmation.
Flexible Display Options
Show only the latest zone
Or display multiple zones with automatic recycling
📈 How Traders Use It
Identify consolidation before expansion
Spot compression zones for breakout or fakeout scenarios
Combine with SMC, order flow, support & resistance, or liquidity concepts
Use higher-timeframe zones for directional bias
Use lower-timeframe zones for entries and scalps
⚠️ Important Notes
This indicator does not predict direction — it highlights structure
Zones represent price balance, not buy or sell signals
Best used in confluence with your trading strategy and risk management
🧠 Designed For
Price action traders
SMC / market structure traders
Forex, crypto, indices, and futures
Any timeframe
⚠️ Risk Disclaimer
This indicator is for educational purposes only and is not financial advice. Trading involves significant risk, and losses may exceed expectations. Past performance does not guarantee future results. Always use proper risk management and trade at your own discretion. Penunjuk

Penunjuk

Penunjuk

Penunjuk

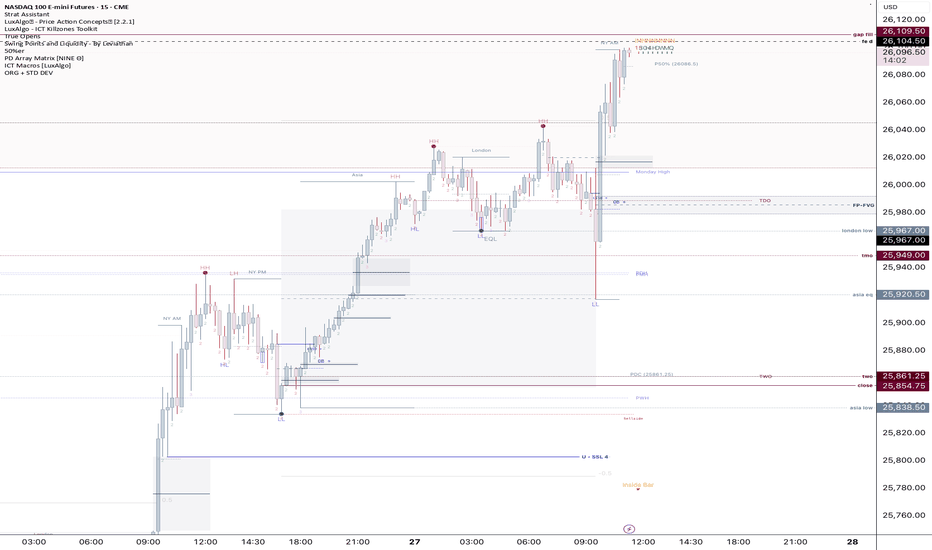
Fractal - VA (Dynamic Wicks)This indicator, which we’ve developed as the Frectal - VA (Multi-Timeframe Visual Analytics), is designed for traders who utilize multi-timeframe analysis but want to keep their main chart clean of overlapping candles.
It functions as a Projected Dashboard, pulling price action from a higher timeframe (HTF) and rendering it as a set of dynamic, solid objects in the right-hand margin of your chart.
Core Philosophy
The "Frectal - VA" is built on the principle of Nested Structure. In professional trading, the "Value Area" or the "Fractal" of a higher timeframe often dictates the trend of the lower timeframe. By projecting these candles into the future (the right side of the chart), you can monitor HTF trend shifts, volatility, and candle closes without the HTF candles obscuring your current "live" price action.
Key Components
Decoupled Visualization: Unlike standard MTF indicators that overlay large boxes behind your current bars, this indicator creates a side-by-side comparison in the chart's whitespace.
Real-Time Data Streaming: It doesn't just show historical candles; the "lead" candle in the dashboard updates with every tick of the current price, showing you exactly how the higher timeframe candle is forming.
Dynamic Color Sync: The body, border, and wick of each projected candle are linked. If a 1-hour candle flips from bullish to bearish on a 5-minute chart, the entire dashboard object changes color instantly.
Customizable Offset: You control the "Drop" (Vertical Offset) and the "Margin" (Horizontal Offset). This allows you to tuck the indicator into a corner of your screen as a heads-up display (HUD).
Strategic Use Cases
Trend Confirmation: If you are trading a 1-minute "scalp" but the 15-minute dashboard shows a solid, large-bodied bearish candle, you are alerted to trade with the HTF momentum.
Volatility Monitoring: By observing the size of the wicks in the dashboard, you can see if the higher timeframe is experiencing "rejection" at certain levels, even if your local timeframe looks like a steady trend.
Visual Backtesting: Because it maintains a queue of the last
X
candles, you can see the immediate history of the HTF structure (e.g., a "Morning Star" pattern or "Engulfing" candles) at a glance.
Technical Specifications
Pine Script Version: v6 (latest standard).
Drawing Engine: Uses box and line arrays for high-performance rendering that doesn't lag the UI.
Memory Management: Automatically deletes old objects to stay within TradingView’s script limits, ensuring stability during long trading sessions. Penunjuk

Penunjuk

Penunjuk
Penunjuk

Penunjuk

Penunjuk

Penunjuk

Penunjuk
Penunjuk

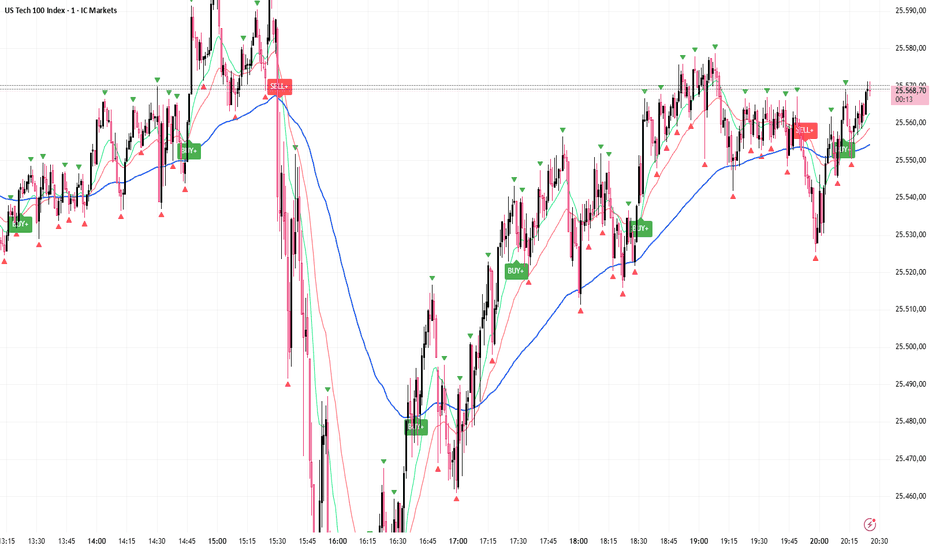
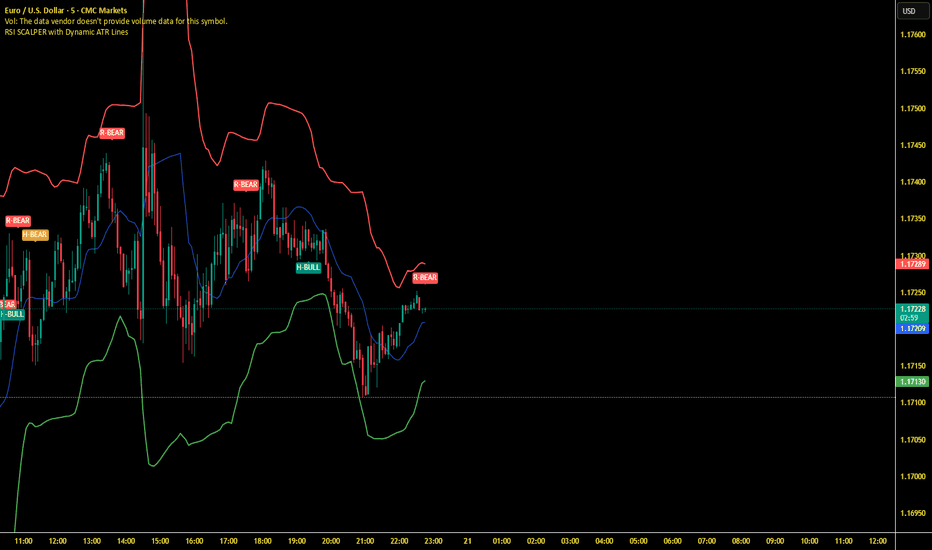
RSI SCALPER with Dynamic ATR LinesThis is a versatile scalping indicator that combines RSI-based signals, dynamic ATR channels, and Stochastic-based divergence detection to identify potential entry and exit points in the market .
Key Features
Dynamic ATR Channel – Calculates support and resistance based on ATR (Average True Range) with configurable length and multiplier for both support and resistance lines, plus a midline
Multi-timeframe RSI – Two separate RSI calculations with independent timeframe settings: one for "KUN RSI" signals and one for "GET READY" alerts
Divergence Detection – Identifies regular and hidden bullish/bearish divergences using Stochastic D and fractals
25 MA Types – Comprehensive library of smoothing functions including WMA, HMA, EMA, TEMA, DEMA, ZLEMA, and several advanced variants
Signal Types
Signal Description
Get Ready (Long) Price crosses above dynamic support while RSI is oversold
Get Ready (Short) Price crosses below dynamic resistance while RSI is overbought
EXIT (Buy Break) Price closes above resistance (previously below) without simultaneous short signal
EXIT (Sell Break) Price closes below support (previously above) without simultaneous long signal
R-BULL / R-BEAR Regular divergence – signals potential trend reversal
H-BULL / H-BEAR Hidden divergence – signals trend continuation
Settings
RSI Parameters:
Separate timeframe selection for both RSI calculations
Configurable length and overbought/oversold levels (default 70/30)
ATR Channel:
Independent timeframe for channel calculation
Individual ATR lengths and multipliers for support (8/1.44) and resistance (14/1.44)
Divergence:
Dedicated timeframe setting
Stochastic parameters (length, smooth K, smooth D)
MA type selection for smoothing
Alerts
The indicator includes four predefined alerts for divergence signals that trigger only on confirmed bars:
Regular Bullish/Bearish Divergence
Hidden Bullish/Bearish Divergence
Use Cases
Suitable for active scalping and swing trading on crypto, forex, and stocks. Combine signals with price structure and volume for optimal use. The ATR channel adapts automatically to volatility, while divergence signals provide early warning of potential trend shifts . Penunjuk
Penunjuk

Filtered Fractals (2-Stage + Alerts)Filtered Fractals
Overview
This indicator is an advanced evolution of the classic Fractal logic (like the WICK.ED or Bill Williams models). Standard fractals are often "noisy," marking every minor local peak or trough, which can lead to false signals in volatile markets.
This script solves the "noise" problem by introducing a Dual-Stage Filtering Process. Instead of displaying every fractal, it treats them as "candidates" and only confirms those that represent a dominant extremum relative to their neighboring fractals.
How It Works
The script operates in two distinct stages to ensure only the most significant structural pivot points are plotted:
Stage 1: Detection
The script identifies "Raw Fractals" based on your preferred sensitivity (Left/Right bars). By default, it uses a 5-bar lookback/lookforward, but these remain hidden from the chart initially.
Stage 2: Sliding Window Competition
The script monitors a rolling sequence of the last three identified fractals. It compares their prices to find the "True Extremum":
For Highs , it compares the 3 most recent fractal peaks.
For Lows , it compares the 3 most recent fractal troughs.
The Point System: Every time a fractal is the "winner" (the highest high or lowest low) within its 3-fractal window, it receives a confirmation point.
The Priority Rule: In cases where two fractals have the exact same price, the script gives priority to the earlier one (the "left" peak), reducing late entries.
Visual Confirmation
A fractal is only plotted on your chart once it achieves two confirmations . This means it has proven to be a significant price extreme compared to both its predecessor and its successor.
Key Features
Noise Reduction: Eliminates "crowded" fractals, leaving only the structural backbone of the trend.
Non-Repainting Logic: The script only processes confirmed closed bars. The current developing candle will never trigger a false fractal or a premature alert.
Smart Alerts: Built-in alert() functionality. You can set a single alert to notify you the exact moment a Bullish or Bearish fractal is confirmed.
Customizable Sensitivity: Adjust the Left/Right Bars in the settings to fit your specific timeframe (e.g., higher values for macro trends, lower for scalping).
How to use
Support/Resistance: Use these filtered fractals to draw more reliable S/R zones.
Stop Loss Placement: Ideal for trailing stops behind truly significant swing points.
Trend Confirmation: A series of higher-high filtered fractals provides a much cleaner view of an uptrend than standard indicators.
Penunjuk

Penunjuk

Penunjuk

Penunjuk

Penunjuk