TON Grid - Long IndicatorTON Grid - Long Indicator
🔷 What it does:
This is a signal-only indicator that mirrors a price-grid long workflow on TON / USDT between two fixed bounds. It tracks up to 67 independent virtual slots between a configurable High and Low — each slot fires a webhook-ready buy signal when price crosses down through it, and a paired sell signal when price subsequently crosses up through the slot immediately above. The indicator computes a running average entry, total deployed capital, and open PnL from the live slot ledger and renders all of it on the chart.
- Pre-computes 7–200 grid levels in Geometric (default) or Arithmetic spacing.
- Each slot is an independent ownership flag with its own buy/sell webhook payload.
- Avg entry is derived from fill-by-fill bookkeeping — total cost and total qty are updated on every event.
- Every event emits a webhook-ready JSON alert payload tagged with the specific grid slot.
🔷 Who is it for:
- Swing traders harvesting volatility on TON in range-bound regimes.
- Bot operators looking for a chart-driven signal source that emits per-slot JSON ready for a DCA Bot configured for grid execution.
- Traders who want to monitor a virtual grid state — avg entry, owned slots, deployed capital, open PnL — directly on the chart without a backtest engine.
- Portfolio operators using a high-trade-count contributor alongside directional strategies.
🔷 How does it work:
Grid Construction: On script load, the indicator computes N price levels between the configured High and Low bounds. In Geometric mode (default), level k is at High × (Low/High)^(k/(N-1)), giving constant percent spacing — approximately 0.6–1.0% per step at default settings. In Arithmetic mode, levels are linearly spaced by absolute price.
Per-Slot State Machine: Each grid level is an independent slot tracked by a boolean ownership flag. When close price crosses down through an empty slot's level, the slot is marked owned, virtual cost-basis is added, and the BUY webhook payload is dispatched. When close price crosses up through the level immediately above an owned slot, the slot is marked free, virtual cost-basis is subtracted, and the SELL webhook payload is dispatched.
Honest Virtual Bookkeeping: Total cost and total qty are updated incrementally on each event, so the avg entry, deployed capital, and open PnL displayed in the status table reflect the actual broker-equivalent position state — no shortcuts from base entry, no synthetic averaging.
No Trailing, No Stop Loss: By design, each slot has a fixed exit (the level above). The indicator never trails the exit and never signals a slot-out for a loss — slots that fall below their entry stay owned until price comes back. This is the canonical grid-bot behavior.
🔷 Why it's unique:
- Per-Level Webhook Ledger: Every BUY and SELL emits a fully-formed JSON alert payload tagged with the specific grid slot ("Grid_BUY_L5" / "Grid_TP_L5"). The indicator can drive a DCA Bot configured for grid emulation without any glue layer.
- Fill-by-Fill Avg Entry: The orange avg-entry line is derived from running totals updated on every event — what you see is what the broker-equivalent position would actually have.
- Active Slot Highlighting: Owned grid levels are rendered with a thicker green stroke; empty slots stay dashed gray. Slot density and current loading are visible at a glance.
- Range Box & Bounds Labels: A semi-transparent box spans the configured High/Low range, and crisp HIGH/LOW labels mark the bounds — the grid topology is obvious without zooming.
- Calibrated for TON 15m: Default bounds, level count, and step size are set against TON's observed historical range — granular enough to catch frequent 15m round-trips, wide enough to avoid fee churn.
🔷 Considerations Before Using the Indicator:
Market Selection & Range Validity: Grid strategies are most profitable in range-bound, mean-reverting markets. On strong directional trends below the configured Low, slots will keep marking as owned as price falls and won't free until price reverses. The default High/Low (2.04 / 1.211) was set against TON's observed range; update both whenever the regime changes.
Capital Deployment: The default Total Investment of 10,000 USDT is a virtual reference used for the avg-entry and open-PnL computation. The real sizing happens on the bot side — match the indicator's per-slot allocation to your bot's grid configuration to keep the avg-entry display honest.
Cross Detection Granularity: Crossings are detected on bar close, comparing the current close to the previous close. A bar that spikes through a level and returns within the same bar may be missed by design — this prevents over-signaling on intra-bar wicks.
Live vs Historical State: The virtual slot ledger is rebuilt from chart history each time the indicator is recompiled. If the indicator is added mid-deployment or the live bot diverges from the signal stream (manual interventions, partial fills), the indicator state may not match the live bot. Toggle the indicator off and on to reset.
No Stop Loss: There is no exit signal on adverse moves below the lowest grid level. Risk is structurally capped on the bot side by the bounded Total Investment configured at the bot. If a hard stop is required, layer it on the bot side.
Backtesting Note: This is an indicator, not a strategy. There is no built-in P&L tester. For performance metrics over a four-month sample (~768 closed trades, 3.05% max drawdown, profit factor 2.888), use the companion strategy version on identical parameters.
🔷 How to Use It:
🔸 Add the indicator to a TON / USDT 15m chart.
🔸 Set the High and Low bounds to a range you expect TON to respect.
🔸 Pick Geometric (default, recommended) or Arithmetic spacing.
🔸 Set Grid Levels (7–200) and the virtual Total Investment used for avg-entry computation.
🔸 In the DCA Bot Webhook group, paste your Bot ID, Email Token, and Pair (QUOTE_BASE format, e.g., USDT_TON).
🔸 Create an alert on the indicator with "Any alert() function call". Paste the DCA Bot's webhook URL into the alert's Webhook field. Every grid-level buy and grid-level close will emit a dedicated JSON payload tagged with the slot index, so each level can be tracked independently downstream.
🔷 INDICATOR SETTINGS
High Price: Top of the grid. The highest level a slot can be created from.
Low Price: Bottom of the grid. The lowest level a slot can be created from.
Grid Levels: Number of price levels between High and Low (default 67, range 7–200).
Spacing Mode: Geometric (constant percent step) or Arithmetic (constant absolute step).
Total Investment (USDT): Virtual capital allocated across all slots. Used for the avg-entry and open-PnL computation only.
Bot ID / Email Token / Pair: Webhook fields injected into every alert payload.
Visualization: Toggle grid lines, range box, HIGH/LOW labels, avg entry plot, fill labels, signal triangles, status table.
Brand Watermark: Configurable text, position, size, and transparency.
👨🏻💻💭 We hope this tool helps enhance your trading. Your feedback is invaluable, so feel free to share any suggestions for improvements or new features you'd like to see implemented.
__
The information and publications within the 3Commas TradingView account are not meant to be and do not constitute financial, investment, trading, or other types of advice or recommendations supplied or endorsed by 3Commas and any of the parties acting on behalf of 3Commas, including its employees, contractors, ambassadors, etc. Penunjuk

TON Grid Bot - Long StrategyTON Grid Bot — Long Strategy
🔷 What it does:
This is a long-only price-grid strategy that harvests volatility on TON / USDT through repeated round-trips on a pre-defined ladder of price levels between two fixed bounds. Each level is an independent slot: when price crosses down through a level, the strategy opens one slot; when price subsequently crosses up through the level immediately above, that slot is closed for a fixed round-trip profit. The grid is generated geometrically by default, so spacing adapts to the price scale.
- Up to 67 simultaneous long slots at default settings, each sized as a fixed fraction of the configured Total Investment.
- No trailing exit, no stop loss — each slot's exit is the level above its entry.
- Per-slot exposure is approximately 1.5% of equity at default settings, comfortably inside the 5–10% per-trade risk band.
- Every fill and close emits a webhook-ready JSON alert payload tagged with the specific grid slot.
🔷 Who is it for:
- Swing traders harvesting volatility on TON in range-bound regimes.
- Bot operators looking for a chart-driven signal source with per-slot webhook JSON ready to drive a DCA Bot configured for grid execution.
- Traders running a portfolio of low-correlation strategies who want a high-trade-count contributor with bounded per-trade risk.
- Range traders who prefer mechanical execution over discretionary entries.
🔷 How does it work:
Grid Construction: On script load, the strategy computes N price levels between the configured High and Low bounds. In Geometric mode (default), level k is at High × (Low/High)^(k/(N-1)), giving constant percent spacing — approximately 0.6–1.0% per step at default settings. In Arithmetic mode, levels are linearly spaced by absolute price.
Per-Slot Logic: Each grid level is an independent slot tracked by a boolean ownership flag. When bar close moves price down through an empty slot's level, a long is opened at that level for one slot's worth of capital (Investment / N). When bar close moves price up through the level immediately above an owned slot, that slot is closed, locking the round-trip profit between the two adjacent levels.
No Trailing, No Stop Loss: By design, each slot has a fixed exit (the level above). The strategy never trails the exit and never stops a slot out for a loss — slots whose entry price is below current market simply wait until price comes back. This is the canonical grid-bot behavior.
Capital Bounds: Total deployed capital cannot exceed the configured Investment. When all 67 slots are filled, no new orders are opened until price rises and starts closing slots. This structural cap is the strategy's primary risk control.
🔷 Why it's unique:
- Per-Level Webhook Ledger: Every fill and close emits a fully-formed JSON alert payload tagged with the specific grid slot ("Grid_BUY_L5" / "Grid_TP_L5"). The strategy can drive a DCA Bot configured for grid emulation without any glue layer.
- Pre-Allocated State: All up to 200 slot ledgers live in fixed-size arrays, so state lookups are constant-time and the chart can render every active slot with no performance overhead.
- Honest Backtest Surface: The avg entry line plotted on the chart and the open PnL displayed in the status table both reflect the actual broker-equivalent position state — derived from fill-by-fill bookkeeping, not synthetic averaging.
- Calibrated for TON 15m: Default bounds, level count, and step size are set against TON's observed historical range. The 67-level geometric ladder gives roughly 0.6–1.0% per step — granular enough to catch frequent 15m round-trips, wide enough to avoid fee churn.
🔷 Considerations Before Using the Strategy:
Market Selection & Range Validity: Grid strategies are most profitable in range-bound, mean-reverting markets. On strong directional trends below the configured Low, slots will keep loading as price falls and won't close until price reverses. The default High/Low (2.04 / 1.211) was set against TON's observed range; update both whenever the regime changes.
Capital Deployment: The default Investment of 10,000 USDT equals 100% of starting capital — this is a high-conviction setting that assumes the configured range holds. Per-slot risk remains low (~1.5% of capital), but if price collapses far below the Low bound, the aggregate unrealized loss can be substantial. Scale the Investment input down to match the worst-case drawdown you are willing to absorb in a range-break scenario.
No Stop Loss Justification: There is no exit on adverse moves below the lowest grid level. The strategy's per-trade risk is structurally capped by the per-slot allocation (Investment / N levels) — at defaults that is 149 USDT per slot, well inside the conventional 5–10% per-trade band. The aggregate unrealized exposure is controlled separately via the Investment input.
Trade Volume & Fees: Grid bots on 15m generate a very high number of round-trips. The default commission (0.1% per trade) is calibrated for Bybit / Binance spot taker conditions; any mismatch with your exchange's actual fees will materially shift the results given the high trade count.
Demo Testing: Always demo-test before going live. Past results do not guarantee future performance, especially on a strategy whose profitability is bounded by the chosen High/Low range remaining valid.
🔷 STRATEGY PROPERTIES
Symbol: BINANCE:TONUSDT (Spot) — strategy is portable to any TON / USDT pair.
Timeframe: 15M
Test Period: January 23, 2026 — May 23, 2026 (~4 months).
Initial Capital: 10,000 USDT.
Total Investment: 10,000 USDT (100% of capital, high-conviction setting).
Order Size per Slot: Investment / 67 ≈ 149 USDT (~1.5% of equity).
Commission: 0.1% per trade.
Slippage: 3 ticks.
Margin for Long Positions: 100%.
Indicator Settings: Default Configuration.
Grid Bounds: High 2.04 / Low 1.211 (range −38.86%).
Grid Levels: 67 (Geometric spacing, ~0.6–1.0% per step).
Stop Loss: None — per-slot allocation is the structural risk cap.
Trailing: None.
Strategy: Long Only.
🔷 STRATEGY RESULTS
⚠️ Remember, past results do not guarantee future performance.
Net Profit: +1,001.46 USDT (+10.01%)
Max Equity Drawdown: 343.54 USDT (3.05%)
Total Closed Trades: 768
Percent Profitable: 60.81% (467 / 768)
Profit Factor: 2.888
🔷 How to Use It:
🔸 Adjust Settings: Open the strategy inputs and set the High and Low bounds to a range you expect TON to respect. Pick Geometric for percent-spaced levels (default, recommended) or Arithmetic. Set Grid Levels (7–200) and Total Investment to match your risk profile.
🔸 Results Review: Run a full-period backtest and confirm Max Drawdown stays within your personal risk band. Validate that the trade count is high enough to be statistically meaningful (≥ 100 closed trades is a reasonable floor — at default settings the strategy typically generates several hundred to several thousand round-trips per 90-day window on TON 15m).
🔸 Create alerts to trigger the DCA Bot: Add one alert on the strategy using "Any alert() function call". Paste your DCA Bot's webhook URL into the alert's Webhook field, and fill the Bot ID, Email Token, and Pair inputs on the script. Every grid-level buy and grid-level close will emit a dedicated JSON payload tagged with the slot index, so each level can be tracked independently downstream.
🔷 INDICATOR SETTINGS
High Price: Top of the grid. The highest level a slot can be created from.
Low Price: Bottom of the grid. The lowest level a slot can be created from.
Grid Levels: Number of price levels between High and Low (default 67, range 7–200).
Spacing Mode: Geometric (constant percent step) or Arithmetic (constant absolute step).
Total Investment (USDT): Total capital allocated across all slots. Per-slot size = Investment / Grid Levels.
Bot ID / Email Token / Pair: Webhook fields injected into every alert payload.
Visualization: Toggle grid lines, range box, HIGH/LOW labels, avg entry plot, fill labels, status table.
Brand Watermark: Configurable text, position, size, and transparency.
👨🏻💻💭 We hope this tool helps enhance your trading. Your feedback is invaluable, so feel free to share any suggestions for improvements or new features you'd like to see implemented.
__
The information and publications within the 3Commas TradingView account are not meant to be and do not constitute financial, investment, trading, or other types of advice or recommendations supplied or endorsed by 3Commas and any of the parties acting on behalf of 3Commas, including its employees, contractors, ambassadors, etc. Strategi

Multi-Session Levels (Exclusive Logic)Overview
Multi-Session Levels (Exclusive Logic) is a specialized technical analysis tool designed for intraday traders who rely on session-based liquidity and reference levels (Highs, Lows, Opens, and Pivots). Unlike standard session indicators that often clutter the chart with overlapping historical data, this script utilizes a custom "Exclusive Display Logic" to ensure that traders only see the most relevant historical context based on the current time of day.
The primary innovation of this script is its context-aware filtering. When a specific market session is active (e.g., London), the script automatically hides that session's own previous day levels to prevent visual "intrusion" or bias. Instead, it projects the locked reference levels of the other major global sessions (Asia and New York) onto the current price action. This allows traders to focus on cross-session liquidity grabs and breakout retests without the distraction of redundant data.
Technical Methodology & Calculations
The script calculates levels based on the official exchange market hours using native timezones to ensure 100% accuracy regardless of the user's local clock:
Asia (Tokyo Stock Exchange): 09:00 - 15:00 JST
London (London Stock Exchange): 08:00 - 16:30 GMT/BST
New York (New York Stock Exchange): 09:30 - 16:00 EST/EDT
Key Calculations:
PSH / PSL (Previous Session High/Low): Uses a state-machine tracking algorithm that captures the absolute high and low of the defined session window. Once the session window closes, these values are "locked" and projected forward to the next relevant trading day.
PSO (Previous Session Open): Captures the open price of the very first bar within the session string.
PSP (Previous Session Pivot): Calculated as the Midpoint $(High + Low) / 2$ of the completed session, serving as a critical mean-reversion level.
Current Session Open: Identifies the real-time opening price of the active session to monitor current-day bias.
How to Use
Identify Liquidity Pools: Use the PSH (Previous Session High) and PSL (Previous Session Low) labels to identify where "buy-side" and "sell-side" liquidity may be resting from previous global sessions.
Monitor Cross-Session Breaks: While trading London, watch how price reacts to the Asia PSH/PSL. A break and retest of these levels often signals a trend continuation or a fake-out (liquidity sweep).
Pivot Midpoints: Use the PSP (Dashed line) as a value area. Price trading above the PSP generally indicates a bullish session bias, while trading below indicates a bearish bias.
Customization: Use the "Visibility" toggles in the settings to isolate specific levels (like just the Open or just the High/Low) depending on your specific trading strategy.
Settings
Market Hours: Users can refine the session strings if they wish to track "Pre-market" or "Electronic Trading Hours" instead of official exchange hours.
Visibility: Toggle PSH, PSL, PSP, and PSO individually.
Styling: Full control over session colors to match your chart theme. Penunjuk

MTIDDescription
MTID is an all-in-one overlay built for swing and position traders who want price action, key statistics and fundamentals on a single pane. Six configurable moving averages, a "big move" marker, a live stats dashboard, and an 8-quarter fundamentals table are combined into one indicator with independent toggles for every section.
WHAT'S ON THE CHART
• Six moving averages — each with its own length, type (SMA/EMA), color and timeframe-visibility filter (All / Intraday+Daily / Weekly+Monthly / Intraday-only / Daily-only / Weekly-only). Default lengths 10/20/50/100/150/200 cover the most-watched values.
• Purple-Dot Big Move — flags bars whose move ≥ a configurable % AND volume ≥ a configurable threshold. Shape, size, color and timeframe-visibility are all configurable; bars can be color-coded on move direction.
• Optional bar coloring for high relative-volume bars.
STATS DASHBOARD (vertical table or horizontal headband)
• Sector & Industry (auto-detected from the symbol)
• Market Cap with currency conversion (Auto / USD / INR / EUR / GBP / JPY) and Indian (Cr/LCr) or Western (M/B/T) formatting
• 52-Week High/Low — % off the high and % off the low (daily-candle based regardless of chart TF)
• 13-Week Peak/Bottom — same idea over a quarter
• ADR (Average Daily Range %) and ATR — daily-candle based
• U/D Ratio — up-volume vs down-volume
• Float %
• Distance vs Daily SMA and Distance vs Weekly SMA — both shown simultaneously, regardless of chart timeframe
• Relative Volume (RVol)
• % above Low-of-Day (intraday session low; bar low on daily+)
FUNDAMENTALS TABLE
Last four quarters (with three more held internally for YoY math) of:
• EPS with YoY and QoQ % change
• Sales (auto-scaled units) with YoY and QoQ % change
• OPM% (Operating Margin = Operating Income / Revenue) with YoY and QoQ
• Per-quarter P/E (annualised from quarter EPS)
Plus an optional row showing the next two estimated quarters (EPS estimates, YoY/QoQ).
Header row showing Market Cap, Free-Float Mkt Cap, ROE and TTM P/E.
Vertical (full grid) or horizontal (transposed headband) layout.
IPO-FRIENDLY
Lookback windows adapt to available history. A newly listed symbol with fewer than 52 weeks (or 13 weeks, 50 bars for RVol, 20 days for ADR, etc.) still gets values computed over whatever data exists, instead of showing "N/A".
CUSTOMIZATION
• Every section independently togglable.
• Per-table position (6 anchor points), text size, layout (vertical / horizontal headband), border & frame width.
• Per-column text alignment (Left / Center / Right) for the dashboard.
• Configurable blank spacer rows at the top of each table — useful when TradingView's hover controls overlap the table.
• Fully themable colors (positive / negative / neutral, backgrounds, borders).
NOTES
• Sector, Industry, Market Cap, ROE, Float, EPS, Sales, Operating Income and EPS estimates are sourced from TradingView's request.financial / request.earnings and may be unavailable for some symbols or exchanges.
• Currency conversion uses FX_IDC daily rates.
• Built in Pine Script v6. Penunjuk

Penunjuk

Penunjuk

Penunjuk

Penunjuk

Penunjuk

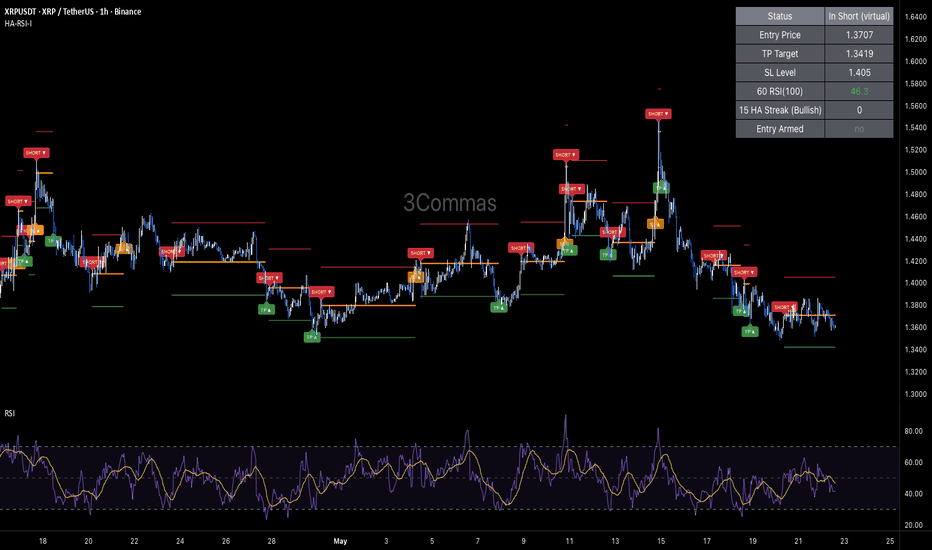
Heikin Ashi RSI Fade - Short IndicatorHeikin Ashi RSI Fade — Short Indicator
🔷 What it does:
This is a signal-only indicator that mirrors a fade-the-strength short workflow. It tracks one virtual short position at a time and fires webhook-ready alerts on three discrete events: a short entry confirmed by dual filters across two timeframes, a take-profit close when price drops a fixed percentage below entry, and a stop-loss close when price rises a fixed percentage above entry. No backtest engine — the indicator is built to drive a live DCA Bot directly through TradingView alerts.
- Dual confirmation entry: RSI(100) on 1h above 46 AND a configurable number of consecutive bullish Heikin Ashi candles on 15m.
- Fixed exits: TP at −2.1% from entry, SL at +2.5%. No trailing.
- Every event emits a fully-formed JSON payload ready for direct DCA Bot consumption.
- Status table tracks the live virtual state on every bar close.
🔷 Who is it for:
- Swing traders running a DCA Bot on crypto pairs that frequently overrun local resistance.
- Bot operators who want a chart-driven signal source that emits webhook JSON natively, with no glue scripts required.
- Traders who want to monitor entry, TP, and SL conditions in real time on the chart without the strategy-tester overhead.
- Risk-conscious operators looking for a clean fade engine with bounded per-trade exposure.
🔷 How does it work:
RSI Bias Filter: A long-window RSI(100) is sampled from the 1-hour timeframe via request.security. The threshold (default 46) sits just below the midline, so the filter is satisfied during prolonged bullish drift — exactly the regime where fading strength has the highest expectancy. When RSI falls below 46, the bias is considered to have flipped bearish and the indicator stops looking for new short signals.
Heikin Ashi Streak Trigger: A 15-minute Heikin Ashi stream is sampled in parallel, and the indicator counts consecutive same-direction HA candles using ta.barssince inside request.security. When the bullish streak reaches the configured length (default 7), the trigger is armed. A single input flips the HA direction between Bullish (fade strength, default) and Bearish (follow trend).
Virtual Position Tracking: When both filters align at host-bar close, the indicator marks a virtual short entry, captures the entry price, and pre-computes the TP and SL levels from the configured percentages. The position state, target prices, and live RSI / HA filter readouts are surfaced in the status table on every bar.
Close-Based Exit Detection: Exit signals are evaluated on bar close — when the close drops to the TP level, the TP event fires; when the close rises to the SL level, the SL event fires. This matches what a polling bot would see at each candle close and avoids over-signaling on intra-bar wicks.
Webhook Dispatch: Every event (entry, TP, SL) emits a dedicated JSON payload through alert(). One TradingView alert configured for "Any alert() function call" drives a DCA Bot end-to-end through the indicator's lifetime.
🔷 Why it's unique:
- Dual-Timeframe Confirmation: RSI on 1h filters macro bias, Heikin Ashi on 15m times the entry. The two conditions operate on different scales so they cannot be satisfied by the same noise pattern — every entry requires alignment across both.
- Fade-or-Follow Switch: A single input flips the HA direction filter between Bullish (fade strength, default) and Bearish (follow trend). The same engine handles two opposing setup archetypes.
- Honest Virtual State: Entry price, TP target, SL level, and live filter readouts are all surfaced on the chart in real time. No hidden math, no shortcut from a synthetic base — what you see is what the bot would see.
- DCA Bot Integration: Webhook payloads are identical to the companion strategy version, so the same bot configuration drives both. Use the indicator for live signals and the strategy for backtest validation.
🔷 Considerations Before Using the Indicator:
Market Selection: Designed for liquid crypto pairs that respect mean-reversion behavior on 1h–2h ranges. Strongly trending markets will repeatedly stop the indicator out; the 1h RSI(100) > 46 filter limits exposure to confirmed bullish drift, but a regime shift to a stronger trend requires manual oversight.
Cross-Detection Granularity: The indicator evaluates entries and exits on bar close. A bar that spikes through a TP or SL level intra-bar and returns within the same bar will not fire the event by design — this matches realistic polling behavior and avoids over-signaling on wicks.
Live vs Historical State: The virtual position state is rebuilt from chart history each time the indicator is recompiled or reloaded. If the indicator is added mid-deployment or the live bot diverges from the signal stream (manual interventions, partial fills), the indicator state may not match the live bot. Toggle the indicator off and on to reset.
No Stop Loss on the Bot Side: The indicator fires a close webhook when its virtual SL level is reached, but the underlying bot still relies on the indicator being live and the webhook being delivered. If hard exchange-side risk protection is required, configure a parallel SL on the exchange directly.
Backtesting Note: This is an indicator, not a strategy. There is no built-in P&L tester. For performance metrics over a five-year sample (~349 closed trades, 0.47% max drawdown, profit factor 1.117), use the companion strategy version on identical parameters.
🔷 How to Use It:
🔸 Add the indicator to a 1H or 2H crypto chart on the pair you want to trade.
🔸 Review the RSI filter (timeframe / length / condition / level) and the Heikin Ashi filter (timeframe / streak / direction). Defaults are calibrated for XRPUSDT — recalibrate per asset before deploying.
🔸 Set the Take Profit and Stop Loss percentages to match the volatility profile of your asset.
🔸 In the DCA Bot Webhook group, paste the Bot ID, Email Token, and Pair (QUOTE_BASE format, e.g., USDT_XRP).
🔸 Create an alert on the indicator with "Any alert() function call". Paste the DCA Bot's webhook URL into the alert's Webhook field. The indicator will emit JSON payloads for short entry, TP close, and SL close — formatted for direct DCA Bot consumption.
🔷 INDICATOR SETTINGS
Base Order Size (USDT): Virtual order size, used only for the status-table display.
RSI Timeframe / Length / Condition / Level: Lower-timeframe RSI bias filter on the host symbol.
HA Timeframe / Streak / Direction: Heikin Ashi consecutive-candle trigger on the lower timeframe. Direction defines fade (Bullish) vs follow (Bearish) mode.
Take Profit (%) / Stop Loss (%): Fixed distance exits from the entry price.
DCA Bot Webhook: Bot ID, Email Token, and Pair fields injected into every alert payload.
Visualization: Toggle Avg Entry / TP / SL plot lines, fill labels, signal triangles, status table.
Brand Watermark: Configurable text, position, size, and transparency.
👨🏻💻💭 We hope this tool helps enhance your trading. Your feedback is invaluable, so feel free to share any suggestions for improvements or new features you'd like to see implemented.
__
The information and publications within the 3Commas TradingView account are not meant to be and do not constitute financial, investment, trading, or other types of advice or recommendations supplied or endorsed by 3Commas and any of the parties acting on behalf of 3Commas, including its employees, contractors, ambassadors, etc. Penunjuk
Penunjuk

Penunjuk

Previous Session Range + Projected Candles + BOS/CHOCH Protected
Overview:
Previous Session Range + Projected Candles + BOS/CHOCH Protected is a multi-feature price action framework designed to combine session context, market structure, and protected liquidity logic into a single overlay.
The indicator builds and extends the previous session range across the active session, projects both the previous and current session candles for quick visual comparison, and tracks BOS (Break of Structure) and CHOCH (Change of Character) events using swing-based structure logic.
In addition, the script introduces protected high/low tracking, allowing traders to monitor structural invalidation levels after bullish or bearish shifts. Optional displacement filtering can also be enabled to require stronger momentum and candle participation before structure breaks are confirmed.
The framework is intended to help traders:
identify continuation vs reversal conditions,
understand session positioning,
track protected liquidity,
monitor structural shifts,
and improve contextual decision-making.
Core features include:
Previous session high/low range box
50% equilibrium midpoint
Previous + active projected session candles
BOS / CHOCH market structure detection
Protected high / low logic
Optional displacement confirmation filter
Structure invalidation tracking
Customizable visuals and alerts
The indicator is best used as a contextual analysis tool rather than a standalone entry system and works especially well when combined with higher timeframe bias, liquidity concepts, fair value gaps (FVGs), VWAP, volume profile, or session-based trading models.
//────────────────────────────────────────────
// DISCLAIMER
//────────────────────────────────────────────
//
// This indicator is provided for educational
// and informational purposes only.
//
// It is a market-structure and price-action
// analysis tool designed to assist with
// contextual decision-making.
//
// The script does NOT provide financial,
// investment, or trading advice.
//
// Nothing in this indicator should be
// interpreted as a recommendation to buy,
// sell, or hold any financial instrument.
//
// Trading involves substantial risk.
// Past performance does not guarantee
// future results.
//
// Users are solely responsible for their
// own trading decisions, risk management,
// and capital allocation.
//
// The author assumes no responsibility
// for financial losses, damages, or
// decisions made from use of this script.
//
// This tool should be used in conjunction
// with additional analysis, confirmation,
// and proper risk management.
//
// BOS, CHOCH, protected levels, session
// ranges, projections, and displacement
// logic are analytical references — not
// guaranteed predictive signals.
//
// Use at your own risk.
//────────────────────────────────────────────
Penunjuk

[Tiestobob] Previous Day and Overnight Highs/Lows** Previous Day and Overnight Highs/Lows**
This indicator plots two of the most widely watched price levels used by intraday traders — the **Previous Day High/Low (PDH/PDL)** and the **Overnight High/Low (ONH/ONL)** — directly on your chart, automatically adjusted for New York time (EST/EDT).
---
**📌 What It Does**
- **Previous Day H/L** — Draws dashed white lines at the prior trading day's high and low (6:00 PM – 4:00 PM ET session)
- **Overnight H/L** — Draws dotted green/red lines marking the high and low of the overnight session (6:00 PM – 9:30 AM ET), a key range watched by futures and forex traders before the regular market open
- Optional **H/L labels** (PDH, PDL, ONH, ONL) appear at the close of each session
- Lines can be **extended to the right** so levels remain visible throughout the trading day
---
**⚙️ Settings**
| Option | Description |
|---|---|
| Select what to plot | Choose between Previous Day H/L or Overnight H/L |
| Show H/L Labels | Toggle end-of-session labels on/off |
| Line Width | Adjust line thickness (1–3) |
| Extend Lines Right | Keep levels visible after the session ends |
---
**📋 Notes**
- All sessions are calculated using the **America/New_York** timezone, automatically accounting for daylight saving time
- Best used on intraday timeframes (1m, 5m, 15m, 1H)
- Pairs well with volume profile, VWAP, and market structure tools
---
*These levels are commonly used as areas of interest for reversals, breakouts, and liquidity sweeps. Use them as context — not signals.* Penunjuk

Penunjuk

Penunjuk

XAU Grid - Long IndicatorXAU Grid — Long Indicator
🔷 What it does:
This is a signal-only indicator that mirrors a price-grid long workflow between two fixed bounds. It tracks up to 48 independent virtual slots between a configurable High and Low — each slot fires a webhook-ready buy signal when price crosses down through it, and a paired sell signal when price subsequently crosses up through the slot immediately above. The indicator computes a running average entry, total deployed capital, and open PnL from the live slot ledger and renders all of it on the chart.
- Pre-computes 5–50 grid levels in Geometric (default) or Arithmetic spacing.
- Each slot is an independent ownership flag with its own buy/sell webhook payload.
- Avg entry is derived from fill-by-fill bookkeeping — total cost and total qty are updated on every event.
- Every event emits a webhook-ready JSON alert payload tagged with the specific grid slot.
🔷 Who is it for:
- Swing traders harvesting volatility on range-bound assets where directional bias is unclear.
- Bot operators looking for a chart-driven signal source that emits per-slot JSON ready for a DCA Bot configured for grid emulation.
- Traders who want to monitor a virtual grid state — avg entry, owned slots, deployed capital, open PnL — directly on the chart without a backtest engine.
- Portfolio operators using a low-volatility contributor alongside directional strategies.
🔷 How does it work:
Grid Construction: On script load, the indicator computes N price levels between the configured High and Low bounds. In Geometric mode (default), level k is at High × (Low/High)^(k/(N-1)), giving constant percent spacing. In Arithmetic mode, levels are linearly spaced by absolute price.
Per-Slot State Machine: Each grid level is an independent slot tracked by a boolean ownership flag. When close price crosses down through an empty slot's level, the slot is marked owned, virtual cost-basis is added, and the BUY webhook payload is dispatched. When close price crosses up through the level immediately above an owned slot, the slot is marked free, virtual cost-basis is subtracted, and the SELL webhook payload is dispatched.
Honest Virtual Bookkeeping: Total cost and total qty are updated incrementally on each event, so the avg entry, deployed capital, and open PnL displayed in the status table reflect the actual broker-equivalent position state — no shortcuts from base entry, no synthetic averaging.
No Trailing, No Stop Loss: By design, each slot has a fixed exit (the level above). The indicator never trails the exit and never signals a slot-out for a loss — slots that fall below their entry stay owned until price comes back. This is the canonical grid bot behavior.
🔷 Why it's unique:
- Per-Level Webhook Ledger: Every BUY and SELL emits a fully-formed JSON alert payload tagged with the specific grid slot ("Grid_BUY_L5" / "Grid_TP_L5"). The indicator can drive a DCA Bot configured for grid emulation without any glue layer.
- Fill-by-Fill Avg Entry: The orange avg-entry line is derived from running totals updated on every event — what you see is what the broker-equivalent position would actually have.
- Active Slot Highlighting: Owned grid levels are rendered with a thicker green stroke; empty slots stay dashed gray. Slot density and current loading are visible at a glance.
- Range Box & Bounds Labels: A semi-transparent box spans the configured High/Low range, and crisp HIGH/LOW labels mark the bounds — the grid topology is obvious without zooming.
🔷 Considerations Before Using the Indicator:
Market Selection: Grid strategies are most profitable in range-bound, mean-reverting markets. On strong directional trends, the indicator will keep marking slots as owned as price moves away and won't free any until price reverses. Pick assets that respect a defined range, and re-tune High/Low whenever the regime changes.
Range Configuration: The default High/Low (4857.27 / 3568.69) was set against XAUTUSDT historical extremes. Update both bounds before deploying on any other asset — the Geometric spacing is sensitive to the bounds ratio.
Cross Detection Granularity: Crossings are detected on bar close, comparing the current close to the previous close. A bar that spikes through a level and returns within the same bar may be missed by design — this prevents over-signaling on intra-bar wicks.
Live vs Historical State: The virtual slot ledger is rebuilt from chart history each time the indicator is recompiled. If the indicator is added mid-deployment or the live bot diverges from the signal stream (manual interventions, partial fills), the indicator state may not match the live bot. Toggle the indicator off and on to reset.
No Stop Loss: There is no exit signal on adverse moves below the lowest grid level. Risk is structurally capped on the bot side by the bounded Total Investment input. If a hard stop is required, layer it on the bot side.
Backtesting Note: This is an indicator, not a strategy. There is no built-in P&L tester. For performance metrics, use the companion strategy version on the same parameters.
🔷 How to Use It:
🔸 Add the indicator to a chart on the asset and timeframe you want to trade.
🔸 Set the High and Low bounds to a range you expect the asset to respect.
🔸 Pick Geometric (default, recommended for crypto and commodities) or Arithmetic spacing.
🔸 Set Grid Levels (5–50) and the virtual Total Investment used for avg-entry computation.
🔸 In the DCA Bot Webhook group, paste your Bot ID, Email Token, and Pair (QUOTE_BASE format, e.g., USDT_XAU).
🔸 Create an alert on the indicator with "Any alert() function call". Paste the DCA Bot's webhook URL into the alert's Webhook field. Every grid-level buy and grid-level close will emit a dedicated JSON payload tagged with the slot index, so each level can be tracked independently downstream.
🔷 INDICATOR SETTINGS
High Price: Top of the grid. The highest level a slot can be created from.
Low Price: Bottom of the grid. The lowest level a slot can be created from.
Grid Levels: Number of price levels between High and Low (default 48, capped at 50).
Spacing Mode: Geometric (constant percent step) or Arithmetic (constant absolute step).
Total Investment (USDT): Virtual capital allocated across all slots. Used for the avg-entry and open-PnL computation only.
Bot ID / Email Token / Pair: Webhook fields injected into every alert payload.
Visualization: Toggle grid lines, range box, HIGH/LOW labels, avg entry plot, fill labels, signal triangles, status table.
Brand Watermark: Configurable text, position, size, and transparency.
👨🏻💻💭 We hope this tool helps enhance your trading. Your feedback is invaluable, so feel free to share any suggestions for improvements or new features you'd like to see implemented.
__
The information and publications within the 3Commas TradingView account are not meant to be and do not constitute financial, investment, trading, or other types of advice or recommendations supplied or endorsed by 3Commas and any of the parties acting on behalf of 3Commas, including its employees, contractors, ambassadors, etc. Penunjuk

XAU Grid Bot - Long StrategyXAU Grid Bot — Long Strategy
🔷 What it does:
This is a long-only price-grid strategy that operates between two fixed bounds and harvests volatility through repeated round-trips on a pre-defined ladder of price levels. Each level is an independent slot: when price crosses down through a level, the strategy buys one slot; when price crosses up through the level immediately above, that slot is closed for a fixed profit. The grid is generated geometrically by default (constant percent step), so the spacing adapts to the asset's scale.
- Up to 48 simultaneous long slots, each sized as a fixed fraction of the total investment.
- No trailing exit, no stop loss — the exit for each slot is the level above its entry, full stop.
- Risk is structurally capped by bounded total investment (default 20% of equity) — if all 48 slots fill, maximum exposure equals the configured investment and cannot exceed it.
🔷 Who is it for:
- Swing traders harvesting volatility on range-bound assets where directional bias is unclear.
- Traders who want a fully mechanical, no-judgment system that runs around the clock.
- Bot operators looking for a chart-driven signal source with per-level webhook JSON ready to drive a DCA Bot configured for grid execution.
- Traders running a portfolio of low-correlation strategies who want a low-drawdown contributor.
🔷 How does it work:
Grid Construction: On script load, the strategy computes N price levels between the configured High and Low bounds. In Geometric mode (default), level k is at High × (Low/High)^(k/(N-1)), giving constant percent spacing. In Arithmetic mode, levels are linearly spaced by absolute price.
Per-Slot Logic: Each grid level is an independent slot tracked by a boolean ownership flag. When bar close moves price down through an empty slot's level, a long is opened at that level for one slot's worth of capital (Investment / N). When bar close moves price up through the level immediately above an owned slot, that slot is closed, locking the round-trip profit between the two adjacent levels.
No Trailing, No Stop Loss: By design, each slot has a fixed exit (the level above). The strategy never trails the exit and never stops a slot out for a loss — slots that fall below their entry simply wait until price comes back. This is the canonical grid bot behavior.
Capital Bounds: Total deployed capital cannot exceed the configured Investment. When all slots are filled, no new orders are opened until price rises and starts closing slots. This structural cap is the strategy's risk control.
🔷 Why it's unique:
- Per-Level Webhook Ledger: Every fill and close emits a fully-formed JSON alert payload tagged with the specific grid slot ("Grid_BUY_L5" / "Grid_TP_L5"). The strategy can drive a DCA Bot configured for grid emulation without any glue layer.
- Pre-Allocated State: All 48 slot ledgers live in fixed-size arrays, so state lookups are constant-time and the chart can render every active slot with no performance overhead even at maximum density.
- Honest Backtest Surface: The avg entry line plotted on the chart and the open PnL displayed in the status table both reflect the actual broker-equivalent position state — no shortcut from base entry, no synthetic averaging.
🔷 Considerations Before Using the Strategy:
Market Selection: Grid strategies are most profitable in range-bound, mean-reverting markets. On strong directional trends, the strategy will keep loading slots as price moves away and won't close any until price reverses. Pick assets that respect a defined range, and re-tune High/Low whenever the regime changes.
Range Configuration: The default High/Low (4857.27 / 3568.69) was set against XAUTUSDT historical extremes. Update both bounds before deploying on any other asset — the Geometric spacing is sensitive to the bounds ratio.
No Stop Loss Justification: There is no exit on adverse moves below the lowest grid level. The strategy's risk is structurally capped by total Investment — at default settings, the maximum deployed capital across all 48 slots is 2,000 USDT = 20% of equity, and the bounded slot count prevents further drawdown beyond that. If price collapses far below the Low bound, that 20% is held at unrealized loss until recovery. Size the Investment input to match the maximum drawdown you are willing to absorb in a range-break scenario.
Trade Volume & Fees: Grid bots generate a high number of round-trips. At default settings, the backtest produced 556 closed trades in 13 months. Realistic commission and slippage are baked into the script; any mismatch with your exchange's actual fees will materially shift the results.
Demo Testing: Always demo-test before going live. Past results do not guarantee future performance, especially on a strategy whose profitability is bounded by the chosen High/Low range remaining valid.
🔷 STRATEGY PROPERTIES
Symbol: BYBIT:XAUTUSDT (Spot)
Timeframe: 15M
Test Period: Sept 1, 2025 — May 21, 2026 (~13 months)
Initial Capital: 10,000 USDT.
Order Size per Slot: Investment / Grid Levels (default 2,000 / 48 ≈ 41.67 USDT, ~0.42% of equity per slot).
Max Capital Deployed: 2,000 USDT (~20% of equity if all 48 slots fill).
Commission: 0.06% per trade.
Slippage: 5 ticks.
Margin for Long Positions: 100%.
Indicator Settings: Default Configuration.
Grid Bounds: High 4857.27 / Low 3568.69.
Grid Levels: 48 (Geometric spacing).
Stop Loss: None — bounded position size is the structural risk cap.
Strategy: Long Only.
🔷 STRATEGY RESULTS
⚠️ Remember, past results do not guarantee future performance.
Net Profit: +101.99 USDT (+1.02%)
Max Equity Drawdown: 64.03 USDT (0.64%)
Total Closed Trades: 556
Percent Profitable: 67.27% (374 / 556)
Profit Factor: 2.267
🔷 How to Use It:
🔸 Adjust Settings: Open the strategy inputs and set the High and Low bounds to a range you expect the asset to respect. Pick Geometric for percent-spaced levels (default, recommended for crypto and commodities) or Arithmetic for linearly-spaced levels. Set Grid Levels (5–50) and Total Investment.
🔸 Results Review: Run a full-period backtest and confirm Max Drawdown stays within your personal risk band. Validate that the trade count is high enough to be statistically meaningful (≥ 100 closed trades is a reasonable floor).
🔸 Create alerts to trigger the DCA Bot: Add one alert on the strategy using "Any alert() function call". Paste your DCA Bot's webhook URL into the alert's Webhook field, and fill the Bot ID, Email Token, and Pair inputs on the script. Every grid-level buy and grid-level close will emit a dedicated JSON payload tagged with the slot index, so each level can be tracked independently downstream.
🔷 INDICATOR SETTINGS
High Price: Top of the grid. The very highest level a slot can be created from.
Low Price: Bottom of the grid. The very lowest level a slot can be created from.
Grid Levels: Number of price levels between High and Low (default 48, capped at 50).
Spacing Mode: Geometric (constant percent step) or Arithmetic (constant absolute step).
Total Investment (USDT): Total capital allocated across all slots. Per-slot size = Investment / Grid Levels.
Bot ID / Email Token / Pair: Webhook fields injected into every alert payload.
Visualization: Toggle grid lines, range box, HIGH/LOW labels, avg entry plot, fill labels, status table.
Brand Watermark: Configurable text, position, size, and transparency.
👨🏻💻💭 We hope this tool helps enhance your trading. Your feedback is invaluable, so feel free to share any suggestions for improvements or new features you'd like to see implemented.
__
The information and publications within the 3Commas TradingView account are not meant to be and do not constitute financial, investment, trading, or other types of advice or recommendations supplied or endorsed by 3Commas and any of the parties acting on behalf of 3Commas, including its employees, contractors, ambassadors, etc. Strategi

Yield Spread MacroYield Spread Macro — Indicator Guide
What it does
This indicator compares the interest rate differential between two countries against the actual FX price of their currency pair, both plotted on the same normalised scale so they can be directly compared. The core idea is that exchange rates are fundamentally driven by the difference in yields between two economies — when one country's rates are significantly higher than another's, capital tends to flow toward the higher-yielding currency, pushing its price up. This indicator tracks whether the FX price is keeping up with that yield story or diverging from it.
What you're looking at on the chart
Blue line — Yield Spread (z-score)
The interest rate differential between the US and the local country, normalised to show where it sits relative to its own history. Above zero means the spread is above average. Below zero means it has compressed.
Aqua line — FX Price (z-score)
The FX pair price, normalised on the same scale as the spread so the two can be directly compared.
Shaded fill between the lines
The gap between the spread and price. When this gap is wide, the two series have diverged — price is not reflecting what the rate differential is saying.
Coloured line (lime/yellow/orange/red) — Rolling Correlation
This is the most important line on the chart. It measures how closely the yield spread and FX price are actually tracking each other over the selected window. Think of it as a trust meter for the spread signal:
🟢 Above 0.80 — strong alignment, spread is a reliable guide right now
🟡 0.40–0.80 — moderate, use alongside other inputs
🟠 0.20–0.40 — weak, something else is driving the pair
🔴 Below 0.20 — regime shift, the spread relationship has broken down entirely
Green background / ▲ DIV label
The yield spread is rising but price has not caught up yet. If correlation is strong this suggests price may follow higher. If correlation is weak, treat it as a tension signal rather than a directional call.
Red background / ▼ DIV label
The yield spread is falling but price has not caught down yet. Price is elevated relative to where the rate differential says it should be. Same caveat — only a strong correlation makes this actionable.
Horizontal dotted lines
The ±1σ and ±2σ bands show historically stretched levels. When either the spread or price z-score pushes beyond ±2, it is statistically extended relative to the lookback window.
Settings explained
Pair Settings
FX Pair
The currency pair you want to analyse. Options are USDJPY, USDCAD, EURUSD, GBPUSD, AUDUSD. Changing this automatically updates all yield series, breakeven data, and FX price feeds — you don't need to change anything else.
Yield Timeframe
The timeframe used to fetch yield data. Default is Daily. Leaving this at D is recommended regardless of what chart timeframe you are on — yield data is most meaningful and cleanest on a daily basis.
General Settings
Normalization Length
The lookback window for the z-score calculation — how many bars of history the indicator uses to compute the average and standard deviation that everything is measured against.
Lower (20–50) — reactive, reflects recent history only, z-score moves frequently
Default (100) — roughly five months on a daily chart, good medium-term context
Higher (200–300) — structural, slow-moving, only flags genuinely historical extremes
If you are a shorter-term trader bring this down. If you want to see where things sit in a multi-year context bring it up.
Spread EMA Smoothing
Applied to the raw yield spread before it gets z-scored. Yield data can print erratic single-day spikes due to auction flows or data feed quirks. This smooths those out.
Lower (3–5) — close to raw spread, more reactive, more noise
Default (10) — removes day-to-day jitter while still tracking real moves
Higher (20–30) — only responds to sustained shifts in the differential, very smooth
Divergence Settings
Divergence Lookback (bars)
How far back the indicator looks when deciding whether the spread and price are moving in opposite directions. A divergence is flagged when the spread has moved one way and price has moved the other way over this window.
Lower (3–5) — very sensitive, signals fire frequently, more noise
Default (10) — roughly two trading weeks on a daily chart
Higher (20–30) — only flags sustained, structural divergences
Min Z-Score Gap to Flag Div
The minimum difference between the spread z-score and price z-score required before a divergence label appears. This prevents the labels from firing when the two lines are close together and the divergence is trivial.
Lower (0.1–0.2) — more signals, lower quality
Default (0.3) — reasonable filter for meaningful gaps
Higher (0.5+) — only the most extreme divergences get flagged
Correlation Settings
Correlation Length (bars)
The rolling window used to measure how tightly the yield spread and FX price are tracking each other. This is the most important setting to understand.
Lower (20–30) — very reactive, correlation shifts quickly, good for seeing regime changes as they happen but noisy
Default (60) — roughly three months on a daily chart, captures a meaningful regime without being too slow
Higher (120–200) — slow-moving, tells you about the long-run structural relationship rather than the current regime
Plot Correlation Line
Toggle the correlation line on or off. If you find the chart visually busy you can turn this off and rely on the table value instead.
Display Settings
Show Zero Line — the dashed horizontal line at zero. Useful reference for whether z-scores are above or below their historical average.
Show ±1σ / ±2σ — the dotted band lines. Turn off if you want a cleaner chart.
Show Data Table — the data panel in the top right corner showing all live values including FX price, yields, real yield, implied breakeven, spread in basis points, z-scores, divergence status, and correlation reading. Turn off if you don't need it or are using the indicator on a small screen.
How to read it in practice
The right workflow is to check the correlation first, then the divergence, in that order.
Check correlation. If it is below 0.40 the spread is not currently driving the pair and the divergence signals should be treated with scepticism. Something else — geopolitics, intervention risk, risk sentiment — is dominant.
Check the spread z-score. Is the differential historically stretched or compressed? Above +2 or below −2 is a significant reading.
Check the divergence. Is price keeping up with the spread or lagging it? A green divergence with strong correlation means price may have room to catch up higher. A red divergence with strong correlation means price may have room to correct lower.
Use the real yield toggle. Switching between nominal and real yields shows you how much of the spread is being driven by inflation expectations versus actual rate differentials. If the two modes show very different spreads, inflation expectations are a significant part of the story.
The indicator works best on a daily chart with the yield timeframe set to D. It is a macro context tool, not a precise entry signal — it tells you whether the fundamental backdrop supports a directional bias, and how much to trust that signal right now. Penunjuk

Shift Share - 5-Model Production MatrixThe 5-Model Stock Breakdown: A Beginner Guide
Imagine you are looking at a single stock—let us call it SuperEco Corp—and its price just jumped up by 10 percent over the last few weeks.
If you ask a regular person why it went up, they might say, "Because it is a good stock!" But a seasoned investor knows that a stock price does not move in a vacuum. It is being pulled and pushed by different invisible forces.
This guide explains how our tracking tool uses a method called Regression to break down that 10 percent jump and reveal exactly who was responsible for the move. You do not need a background in math, economics, or statistics to understand how it works.
1. The Three Invisible Forces
Our model assumes that a stock price movement depends on three major factors:
The Market (The Rising Tide): This is the entire stock market (like the S&P 500). When the overall economy is booming, optimism runs high, and almost every stock gets lifted. If the market goes up sharply, our stock will likely get dragged up with it, purely by association.
The Sector (The Industry Wave): This is the specific neighborhood the stock lives in (such as Technology, Energy, or Healthcare). If electric vehicles are suddenly booming, all EV stocks will rise together, even the poorly managed ones, because money is pouring into that specific industry bucket.
The Stock Itself (Its Unique Engine): This is the company own secret sauce. It includes their unique products, their management team, their earnings reports, and their breakthroughs. This is what belongs only to this stock and no one else.
What is Regression?
Think of a stock total return like a baked cake. You know the cake tastes sweet (the stock went up 10 percent), but you do not know how many cups of sugar, flour, or butter went into it.
Regression is a tool that acts like a laboratory test for that cake. It analyzes the final product, compares it to how the broader market and sector were moving at the same time, and extracts the exact recipe. It tells you: "Of this 10 percent move, 5 percent was caused by the market, 3 percent was caused by the sector, and 2 percent was the stock unique engine."
2. Leftover Mystery: The Statistical Error
No matter how smart a math model is, it can never perfectly predict human behavior or random events. When we add up what the Market and the Sector should have done to the stock, it rarely perfectly matches the actual final price.
The piece that is left over is called the Statistical Error (or Noise Floor).
Think of it like static on an old television set, or the background chatter in a crowded restaurant. It represents random daily market zig-zags, algorithmic trading glitches, or minor noise that has no real structural meaning. If our model is working correctly, this error row should be very small, meaning our factors successfully explained the vast majority of the price movement.
3. The 5 Steps of Understanding: Our Dropdown Models
To help you see how these forces interact, our indicator lets you switch between 5 different structural models using a simple settings dropdown menu. Think of this like changing lenses on a camera to see the data in different ways:
Model 1: No Variables (The Blindfold View)
This model assumes that external factors do not exist. It completely ignores the market and the sector. The stock price is treated as moving entirely on its own, plus some random mystery noise. This establishes a baseline to see what the stock looks like when you isolate it from macro events.
Model 2: Market Only (The Macro Lens)
This model assumes that only the big picture matters. It watches how the stock moves in relation to the main stock market index. It tells you if your stock is just a mirror of the broader economy. If the market explains almost all of the move, your stock is behaving like an index fund.
Model 3: Sector Only (The Neighborhood Watch)
This model ignores the broader market and looks strictly at the stock specific industry group. This helps you see if the stock is simply riding an industry-wide trend or hype cycle, completely independent of whether the rest of the world markets are up or down.
Model 4: Both Market and Sector (The Parallel View)
This model looks at both forces simultaneously, but treats them as completely independent. It assumes they run side-by-side like two trains on parallel tracks. This isolates how much of the stock price was swept up by the macro economy versus how much was driven by its specific industry peer group.
Model 5: Full Interactive Model (The Chemistry Lab)
In the real world, forces do not just run on parallel tracks—they collide and alter each other. This model introduces a special Interaction Term. When a roaring market slams into a hyper-growth sector, they create a compounding synergy that accelerates or dampens stock prices. This is the most realistic model, stripping away all shared group behavior to isolate the stock true standalone engine.
4. Reading Your Screen: The Output Matrix Table Explained
When you load the script on your chart, it generates a clean summary table in your indicator pane. Here is how to interpret the four columns:
Column 1: Source Factor
This lists the different forces we are tracking: Market Component, Sector Component, Cross-Factor Interaction, Pure Unique Asset, and Statistical Error Noise.
Column 2: Window Return
This column shows you the direct, absolute performance footprint measured in percentage points. If you add up every number in this column from top to bottom, it will perfectly equal the final Asset Total Return row at the very bottom. If the final row says +10.00%, and the Market row says +6.00%, the market tide handed your stock 6 of its 10 points of growth. A negative number means that factor acted as a brake, actively dragging your stock backward.
Column 3: Share Allocation %
While Column 2 tells you the direction and points, this column tells you pure structural influence. It answers the question: "Regardless of whether it was pulling the stock up or pushing it down, what percentage of the total steering wheel did this factor control?" This column always adds up to exactly 100.00%.
Column 4: Dynamic Profile State
This column displays the real-time operational status of the factors based on your settings. If a factor is turned off in your dropdown choice, this column will clearly say "OFF / Excluded". If a factor is active, it reveals its underlying structural strength using standard financial metrics like Beta (market scaling) or Alpha (sector outperformance).
The Ultimate Check: Look at the Header (R2)
Right at the very top of the table header, you will see a score labeled R2 (R-Squared). Think of this as the Model Accuracy Grade, scaled from 0.00 (completely guessing in the dark) to 1.00 (absolute flawless perfection).
If your R2 is 0.85, it means your chosen model successfully captured and explained 85% of everything that caused the stock to move over that time window. By toggling through models 1 to 5, you can find the framework that creates the highest R2 score, giving you definitive statistical proof of how that specific stock is actually operating. Penunjuk

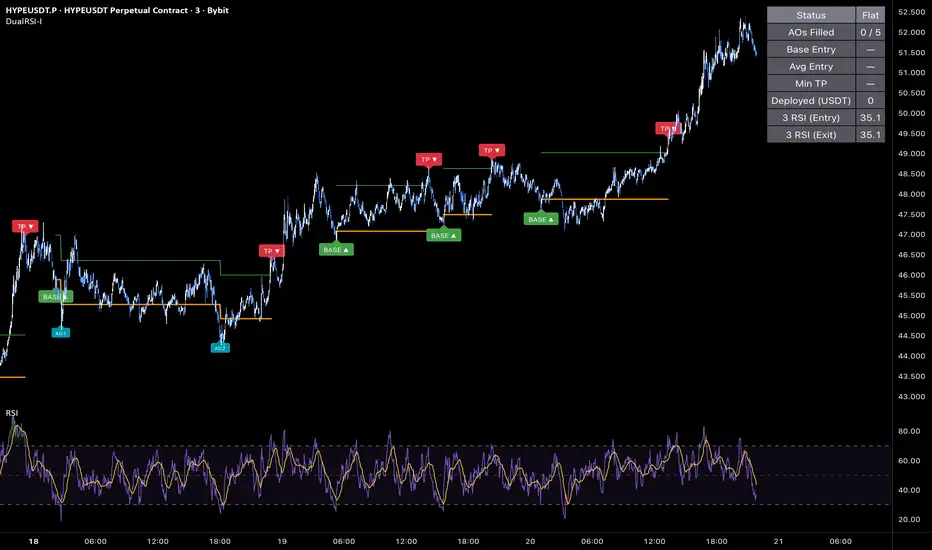
Dual RSI DCA - Long IndicatorDual RSI DCA — Long Indicator
🔷 What it does:
This is a signal-only indicator that mirrors a dollar-cost averaging long workflow with a dual RSI confirmation system. It identifies oversold reversal entries on the host chart using a lower-timeframe RSI cross-up, tracks a virtual position with up to five averaging fills on a deviation ladder, and fires the exit when the lower-timeframe RSI crosses down from overbought — but only after a minimum profit threshold from the running average entry has been reached.
- Base entry signal arms on a lower-timeframe RSI(14) crossing up the oversold level (default 31 on 3m).
- Up to five safety orders fire automatically as price ladders down, on a 1.3% step / 1.3 step multiplier / 1.25 size multiplier progression.
- Take profit fires only when the lower-timeframe RSI crosses down the overbought level (default 69) AND minimum profit (default 2.4%) from average entry has been reached.
- Every event emits a webhook-ready JSON alert payload formatted for direct DCA Bot consumption.
🔷 Who is it for:
- Swing traders running a DCA Bot on crypto pairs that frequently mean-revert from local extremes.
- Traders who want a clean oversold-to-overbought signal flow without the strategy-tester overhead.
- Bot operators looking for a chart-driven signal source that ships webhook JSON natively, with no glue scripts required.
- Anyone who wants to monitor a virtual DCA position with full transparency on average entry, fills, and deployed capital — directly on the chart.
🔷 How does it work:
Lower-Timeframe RSI Cross-Up: The indicator polls a lower-timeframe RSI through request.security and checks for a cross above the oversold level at each host-bar close. When the cross fires AND the indicator is flat, the base-entry event triggers, the virtual position state is initialized, and the entry webhook payload is dispatched.
Virtual Position Tracking: Once entered, the indicator captures the entry price, base USDT size, and seeds running totals of cost and asset units. Each subsequent safety order updates those totals so the average entry, total deployed capital, and profit zone are always derived from honest fill-by-fill bookkeeping.
Safety Order Ladder: Five deviation thresholds are pre-computed from the base entry (1.30%, 2.99%, 5.18%, 8.04%, 11.75% at default settings). When the close price reaches the next threshold, the corresponding safety-order signal fires, the virtual position updates, and the AO webhook payload is emitted. No RSI gating on the ladder — it's pure price action.
Take Profit Logic: Once price reaches the minimum-profit threshold above the running average entry, the exit becomes armed. The close signal then fires only when the lower-timeframe RSI crosses down from the overbought level — the indicator does not exit just because profit is reached, it waits for momentum confirmation.
🔷 Why it's unique:
- Dual-RSI Architecture: Two independent lower-timeframe RSI cross conditions — one gates the entry, one gates the exit. Most DCA tools use a filter on only one end of the deal; this one filters both.
- Profit-Armed Exit: The take profit does not fire on a static target. It waits for RSI to roll over from overbought, allowing winners to run while still requiring minimum profit before any close is considered.
- Honest Virtual Tracking: Average entry, total cost, deployed capital, and minimum-profit target are all computed from the same fill-by-fill bookkeeping a real broker would do. No price-from-base shortcuts.
- Webhook-First Design: Every event (base, each safety order, exit) emits a fully-formed JSON alert payload. Connect one alert to a DCA Bot's webhook URL and the indicator drives the bot end-to-end.
🔷 Considerations Before Using the Indicator:
Market & Timeframe: Designed for 3min crypto pairs with active mean-reversion behavior. Default RSI levels (31/69) are calibrated for liquid volatility; thin or strongly trending pairs may need recalibration.
Cross Detection Granularity: LTF RSI cross detection happens at host-bar close. A cross that completes and reverses inside a single host bar may be missed by design — this prevents over-signaling on intra-bar noise.
No Stop Loss: There is no exit signal on adverse moves beyond the safety-order ladder. Risk is structurally capped by the bounded position-size sequence — at default settings, base + all five safety orders deploy roughly 9.93% of equity, keeping the trade within the conventional 5–10% risk band. If a hard stop is required, layer it on the bot side.
Live vs Historical State: The virtual position state is rebuilt from the chart history each time the indicator is recompiled. If the indicator is added mid-trade or the live bot diverges from the signal stream (manual interventions, partial fills), the indicator state may not match the live bot. Toggle the indicator off and on to reset.
Backtesting Note: This is an indicator, not a strategy. There is no built-in P&L tester. For performance metrics, use the companion strategy version on the same parameters.
🔷 How to Use It:
🔸 Add the indicator to a 3min crypto chart on the pair you want to trade.
🔸 Configure the order sizing inputs to match the DCA Bot's settings (base order size, first AO size, multipliers).
🔸 Set the entry RSI level (default 31) and exit RSI level (default 69) — these are the two RSI gates.
🔸 Set the minimum profit threshold (default 2.4%) — exits will not fire below this.
🔸 In the DCA Bot Webhook group, paste the Bot ID, Email Token, and Pair (QUOTE_BASE format, e.g., USDT_HYPE).
🔸 Create an alert on the indicator with "Any alert() function call". Paste the DCA Bot's webhook URL into the alert's Webhook field. The indicator will emit fully-formed JSON payloads for each event — no integration layer required.
🔷 INDICATOR SETTINGS
Base Order Size (USDT): USDT size of the initial entry. Used for the virtual avg-entry computation.
First AO Size (USDT): USDT size of the first safety order. Subsequent safety orders scale by the Size Multiplier.
Order Size Multiplier: Factor that grows each subsequent safety order's USDT size (default 1.25).
Averaging Orders per Trade: Maximum number of safety orders allowed per cycle (default 5).
Deviation to First AO (%): Distance from base entry where the first safety order becomes eligible (default 1.3%).
Deviation Step Multiplier: Ladder factor that widens each subsequent deviation step (default 1.3).
Entry RSI Timeframe / Length / Level: Lower-timeframe RSI configuration for the oversold cross-up entry (default 3m / 14 / 31).
Exit RSI Timeframe / Length / Level: Lower-timeframe RSI configuration for the overbought cross-down exit (default 3m / 14 / 69).
Minimum Profit (%): Threshold above the running average entry that must be reached before the exit signal can fire (default 2.4%).
DCA Bot Webhook: Bot ID, Email Token, and Pair fields injected into every alert payload.
Visualization: Toggle the DCA Ladder, Signal Labels, Signal Triangles, Avg-Entry / Min-TP plots, and Status Table.
Brand Watermark: Configurable text, position (9 options), size, and transparency.
👨🏻💻💭 We hope this tool helps enhance your trading. Your feedback is invaluable, so feel free to share any suggestions for improvements or new features you'd like to see implemented.
__
The information and publications within the 3Commas TradingView account are not meant to be and do not constitute financial, investment, trading, or other types of advice or recommendations supplied or endorsed by 3Commas and any of the parties acting on behalf of 3Commas, including its employees, contractors, ambassadors, etc. Penunjuk

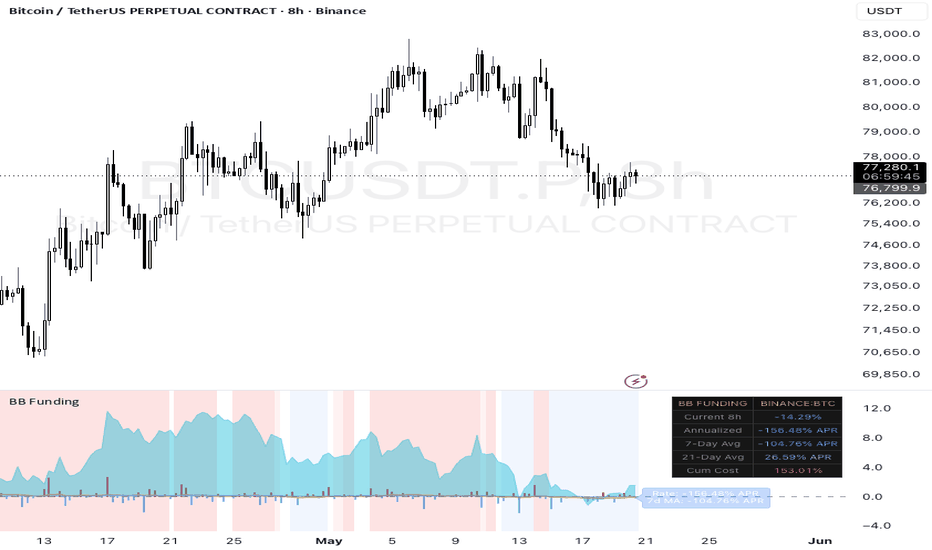
Brewberry Funding Rate TrendWhat it shows:
Histogram bars — the raw funding rate per 8-hour interval. Color-coded: bright red above 0.05%, orange above 0.03%, faded green for mild positive, blue for negative. The visual weight makes the current regime immediately obvious.
Yellow line (7-day MA) — this is the important one. The course says repeatedly that a single reading means nothing — it's the trend over 3-7+ days that tells you whether the structure is fragile. This line is that trend.
Purple line (21-day MA) — structural trend. Where the 7-day is above the 21-day and both are elevated, you're in a sustained crowding regime.
Background shading — red tint when 7-day MA crosses above 0.03% (danger zone), deeper red above 0.05% (extreme zone), blue tint when MA goes negative.
Threshold lines — dashed horizontal lines at 0.01%, 0.03%, and 0.05% per 8h with labels showing the annualized equivalent (10.95%, 32.85%, 54.75%).
Cumulative cost box — sums the actual funding paid over your lookback window. Shows the real dollar drain on a long position over the period.
Top-right table — current rate, annualized rate, 7-day avg APR, 21-day avg APR, cumulative cost. All in one glance.
Four built-in alerts — 7d MA enters danger zone, exits danger zone, hits extreme zone, and crosses below zero (short squeeze setup building).
To use on different assets: Change the Asset input from BTCUSDT to ETHUSDT, SOLUSDT, etc. Penunjuk
NEWS [Ordinary Trader]# NEWS
NEWS by Ordinary Trader marks high-impact USD economic news events on your chart — CPI, NFP, FOMC, PCE, GDP, and the rest of the red-folder calendar — both past and upcoming.
Part of the Ordinary Trader family alongside **EMAs**, **FVGs**, **KEY LEVELS**, **ZONES**, and **STRATEGY (LITE / PRO)**. The methodology calls for standing aside during high-impact news; this indicator makes those events impossible to miss.
## Visuals
Each event produces a **full-height vertical column** at the exact event time, plus a **small triangle marker** in a thin pane below the chart. Hover the marker for event name, day, date, and time in your selected timezone.
~3 months of historical events stay visible. ~1 week of upcoming events floats in the projected area to the right of your latest candle.
## Tiers + Filters
Events auto-classify into 4 tiers, each with its own colour:
- **Tier 1** — CPI, NFP, FOMC Rate Decision, PCE, GDP
- **Tier 2** — FOMC Minutes, Retail Sales, ISM PMI, PPI
- **Tier 3** — ADP, Consumer Confidence, Michigan, JOLTS, Initial Jobless Claims, Durable Goods
- **Uncategorised** — everything else (default OFF)
Hybrid filtering: tier master toggles + per-event toggles.
## Alerts (optional)
Pre-event TradingView alerts fire N minutes before each visible event (default 30). Same filters apply. One-time setup: enable in indicator settings + add a TradingView alert with condition `Any alert() function call`.
## Timezone
10 options (ET / CT / PT / UTC / UK / CET / Tokyo / HK / Singapore / Sydney) for tooltips and alerts. DST automatic.
## Notes
- USD events only; non-USD on the roadmap.
- Built on the Forex Factory data feed maintained by **@toodegrees** via Pine Seeds. The visual layer, tier classification, filter UI, and alerts are original work.
- License: Mozilla Public License 2.0. Free to use. Penunjuk