Strategi
Analisis Fundamental

XMR Grid - Long IndicatorXMR Grid — Long Indicator
🔷 What it does:
This is a signal-only indicator that mirrors a price-grid long workflow on XMR / USDT between two fixed bounds. It tracks up to 37 independent virtual slots between a configurable High and Low — each slot fires a webhook-ready buy signal when price crosses down through it, and a paired sell signal when price subsequently crosses up through the slot immediately above. The indicator computes a running average entry, total deployed capital, and open PnL fr
Penunjuk
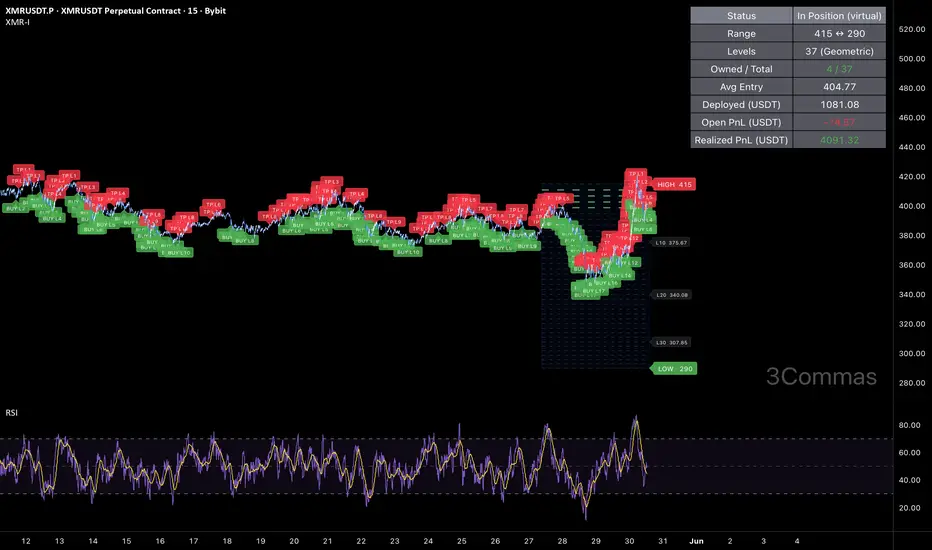
XMR Grid Bot - Long StrategyXMR Grid Bot — Long Strategy
🔷 What it does:
This is a long-only price-grid strategy that harvests volatility on XMR / USDT through repeated round-trips on a pre-defined ladder of price levels between two fixed bounds. Each level is an independent slot: when price crosses down through a level, the strategy opens one slot; when price subsequently crosses up through the level immediately above, that slot is closed for a fixed round-trip profit. The grid is generated geometrically by default, so s
Strategi

Salil1980 SenSex 1m ORB BreakoutsThe SenSex 5m ORB Breakout is a dedicated intraday trading indicator built specifically for the Sensex index. It integrates Opening Range Breakout (ORB) mechanics with VWAP and RSI momentum filters, providing traders with precise, automated entry signals.
Key Features:
5-Minute ORB Logic: Automatically identifies and plots the high and low of the first 5 minutes of the trading session, capturing the day's initial momentum.
VWAP & RSI Trend Confirmation: Generates actionable BUY and SELL signa
Penunjuk

Salil1980 SenSex 5m ORB BreakoutsThe SenSex 5m ORB Breakout is a dedicated intraday trading indicator built specifically for the Sensex index. It integrates Opening Range Breakout (ORB) mechanics with VWAP and RSI momentum filters, providing traders with precise, automated entry signals.
Key Features:
5-Minute ORB Logic: Automatically identifies and plots the high and low of the first 5 minutes of the trading session, capturing the day's initial momentum.
VWAP & RSI Trend Confirmation: Generates actionable BUY and SELL signa
Penunjuk

Salil1980 BankNifty 1m ORB BreakoutsThis indicator is a comprehensive technical tool specifically designed for intraday trading on BankNifty. It combines Opening Range Breakout (ORB) mechanics with VWAP and RSI momentum filters to identify high-probability breakout and trend-continuation setups.
Key Features:
5-Minute ORB: Automatically detects and plots the high and low of the first 5 minutes of the trading session.
VWAP & RSI Momentum: Displays clear Buy and Sell signals based on 1-minute VWAP crossovers confirmed by RSI thre
Penunjuk

Salil1980 BankNifty 5m ORB BreakoutsThis indicator is a comprehensive technical tool specifically designed for intraday trading on BankNifty. It combines Opening Range Breakout (ORB) mechanics with VWAP and RSI momentum filters to identify high-probability breakout and trend-continuation setups.
Key Features:
5-Minute ORB: Automatically detects and plots the high and low of the first 5 minutes of the trading session.
VWAP & RSI Momentum: Displays clear Buy and Sell signals based on 1-minute VWAP crossovers confirmed by RSI thre
Penunjuk

Penunjuk
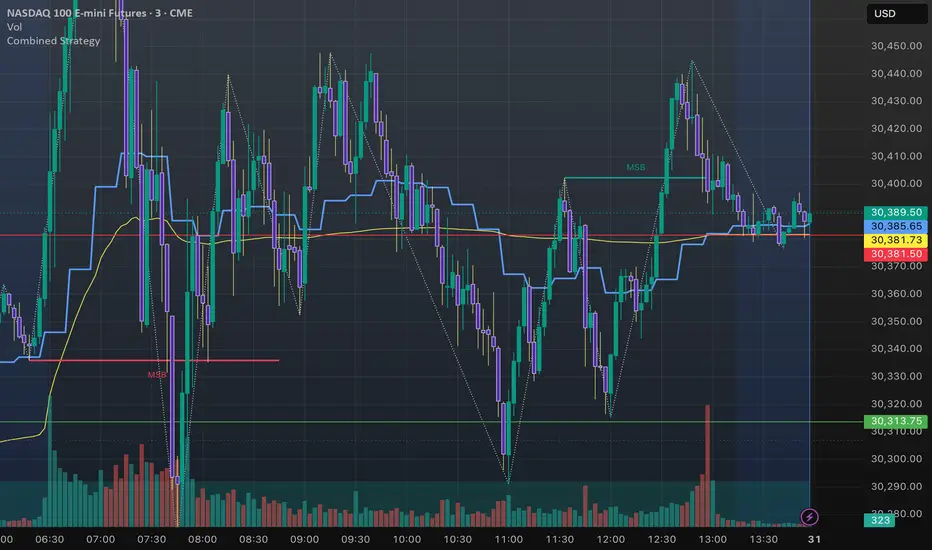
GFG Institutional Pressure Candle Overlay by AgaamGFG Institutional Pressure Candle Overlay by Agaam
This indicator is designed to help identify potential institutional-style buying pressure, selling pressure, and absorption directly on the chart.
The script analyzes each candle using multiple pressure factors, including candle body strength, close location, relative volume, ATR range expansion, VWAP position, and wick rejection. It then assigns a simple 0–10 pressure score and displays clean BUY or SELL labels when pressure conditions are de
Penunjuk

Penunjuk

Penunjuk

WSD - Seasonality Pro📈 WSD - Seasonality Pro
Overview
WSD - Seasonality Pro is an advanced asset-class agnostic data-mining tool designed to extract, isolate, and project multi-year seasonal tendencies directly onto your chart. By processing historical daily logs, the engine calculates baseline performance across specific phases of the calendar year, producing an institutional-grade seasonal roadmap. It visualizes both a comprehensive historical benchmark and a forward-looking Forecast Window to help traders align
Penunjuk

Sector Rotation (Zeiierman)█ Overview
Sector Rotation (Zeiierman) is a relative strength rotation tool designed to compare multiple sectors against a selected benchmark and visualize how leadership shifts across the market over time.
Instead of viewing sector performance as isolated price charts, the script converts each sector into a normalized RS-Ratio and RS-Momentum reading, then plots them inside a four-quadrant rotation map.
The result is a clean visual framework for identifying which sectors are Leading, Weak
Penunjuk

LTC RSI Oversold Doubling DCA - Long IndicatorLTC RSI Oversold Doubling DCA - Long Indicator
🔷 What it does:
This is a signal-only indicator that mirrors a high-conviction LTC dip-buying workflow with an aggressive doubling-martingale safety ladder. It tracks one virtual long position at a time, opened only when LTC prints a deep oversold reading on 4-hour RSI AND trades below a configurable price ceiling. Four safety orders fire at fixed deviations from base entry (−2.5%, −5%, −10%, −20%) with sizes doubling on every rung. Exit is a wide
Penunjuk

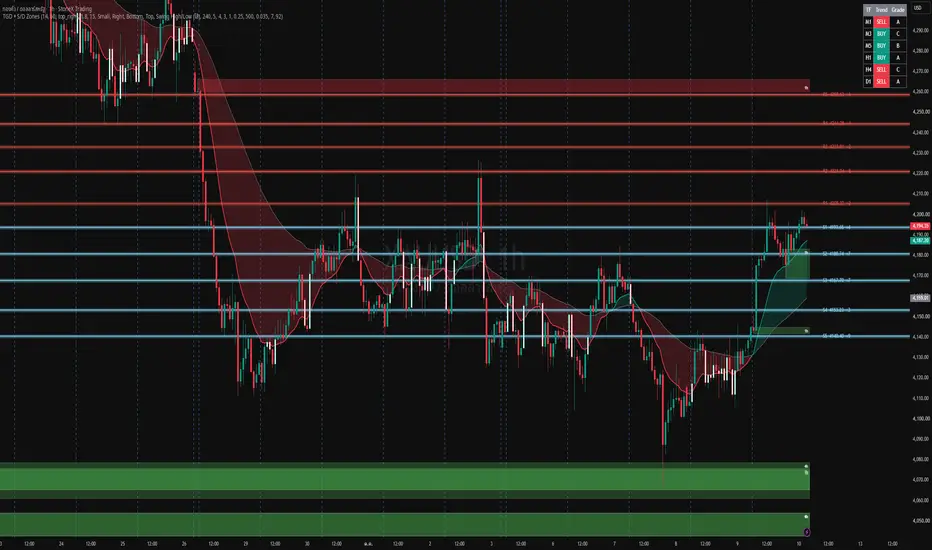
Trend Grading Dashboard V1.0Trend Grading Dashboard By Piyacham
Logic Overview:
Trend Determination:
BUY: EMA14 is above EMA60.
SELL: EMA14 is below EMA60.
Grading System:
Grade A: The trend is strong; price is trading "beyond" the fast EMA (Above EMA14 for BUY, Below EMA14 for SELL).
Grade B: The price is in a retracement zone between the two EMAs.
Grade C: The price has crossed below the slow EMA (for BUY) or above it (for SELL), suggesting a potential trend weakness or reversal.
Timeframes: The dashboard automaticall
Penunjuk
LTC RSI Oversold Doubling DCA - Long StrategyLTC RSI Oversold Doubling DCA — Long Strategy
🔷 What it does:
This is a long-only DCA strategy with an extremely selective entry filter and an aggressive martingale safety-order ladder. A long entry opens only when the 4-hour RSI falls below 29 AND the close price is below a configurable ceiling ($61 by default). Four safety orders fire at fixed deviations from base entry (−2.5%, −5%, −10%, −20%) with sizes doubling on every rung ($2,000 → $4,000 → $8,000 → $16,000). Exit is a wide 35% Take Pro
Strategi

VWAP + Volume Clusters [Pro]Институциональный VWAP и сессионный профиль объёма в одном инструменте — для intraday-трейдинга по логике «цена движется от ликвидности к ликвидности».
Индикатор объединяет два ключевых ориентира внутридневной торговли: VWAP как institutional reference (средняя цена, по которой реально торговали крупные участники) и распределение объёма по уровням как зоны
интереса. Минималистичный визуал, всё настраивается.
Что внутри
1. Session VWAP + полосы σ
VWAP с привязкой к сессии (сброс в на
Penunjuk

Penunjuk
Rich Scannerthis is real this is me I am exactly where I am Supposed to be now gonna let the light shine on me now I know where I am theres no way to hold it in this is me.
Penunjuk

RSI Oversold AO - Long StrategyRSI Oversold AO — Long Strategy
🔷 What it does:
This is a long-only DCA strategy that buys oversold dips and continues averaging into them only while the asset stays in the oversold zone. A long entry opens on a lower-timeframe RSI crossing down through 30. Four safety orders then average the position on an aggressive 2× deviation × 2× size ladder — but each one fires only if the lower-timeframe RSI is still below 25 at that moment. No falling-knife averaging into recovering momentum. Exit is a
Strategi

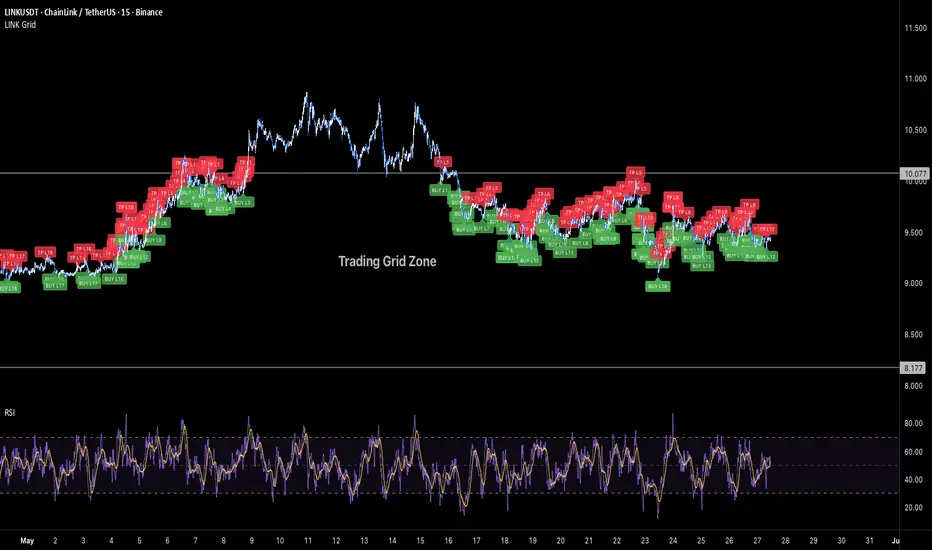
LINK Grid - Long IndicatorLINK Grid — Long Indicator
🔷 What it does:
This is a signal-only indicator that mirrors a price-grid long workflow on LINK / USDT between two fixed bounds. It tracks up to 36 independent virtual slots between a configurable High and Low — each slot fires a webhook-ready buy signal when price crosses down through it, and a paired sell signal when price subsequently crosses up through the slot immediately above. The indicator computes a running average entry, total deployed capital, and open PnL
Penunjuk

LINK Grid Bot - Long StrategyLINK Grid Bot — Long Strategy
🔷 What it does:
This is a long-only price-grid strategy that harvests volatility on LINK / USDT through repeated round-trips on a pre-defined ladder of price levels between two fixed bounds. Each level is an independent slot: when price crosses down through a level, the strategy opens one slot; when price subsequently crosses up through the level immediately above, that slot is closed for a fixed round-trip profit. The grid is generated geometrically by default, so
Strategi
profitzonetrades S/R + Strength + Sweepsprofitzonetrades S/R + Strength + Sweeps
profitzonetrades S/R + Strength + Sweeps is a technical analysis indicator designed to identify dynamic support and resistance zones, liquidity sweep rejections, and market reaction strength using price structure, candle behavior, and optional trend confirmation filters.
The script combines several technical analysis concepts into a single workflow focused on liquidity behavior and market structure analysis.
Technical Components Used
This indicator us
Penunjuk

Liquidity Gravity Map [PhenLabs]📊 Liquidity Gravity Map
Version: PineScript™ v6
📌 Description
The Liquidity Gravity Map is an advanced, quantitative approach to dynamic support and resistance detection. Rather than simply plotting static lines at prior highs and lows, this indicator treats liquidity as a gravitational force that accumulates, decays, and dynamically shifts based on price action and volume. It builds a real-time, scored “map” of liquidity zones on your chart, quantifying their structural integrity, mitiga
Penunjuk
