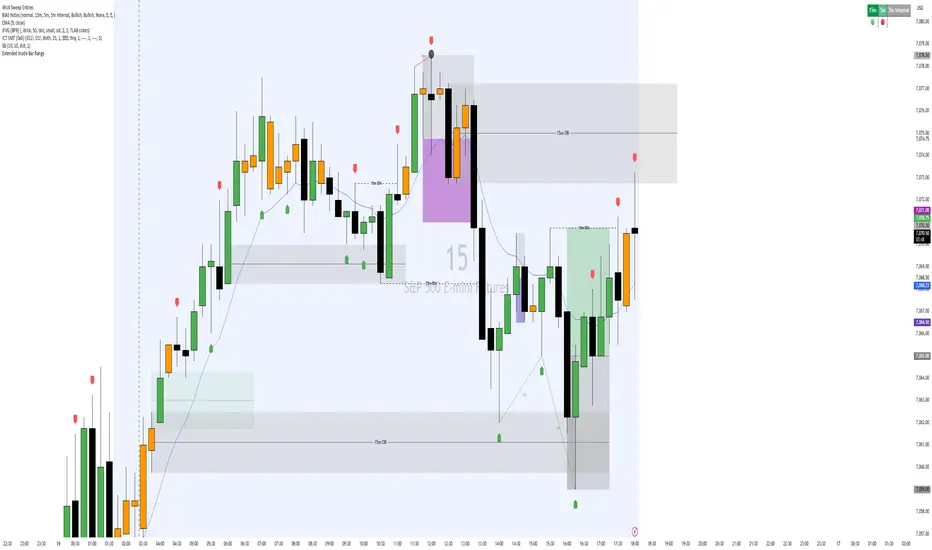
Inside Bar [scriptedge]Overview
Inside Bar looks for a higher timeframe candle that trades entirely within the range of the one before it. Throughout this description the larger candle is called the mother candle , the contained one is the inside bar , and the one that follows is the trading candle .
The indicator is designed so that the whole setup can be visualised from the lower timeframe you intend to trade. The higher timeframe is read in the background and its structure is drawn onto your chart, so there is no need to switch timeframes to see where the range sits or how the trading candle is developing.
The tool draws structure and context. It does not generate buy or sell signals, and it does not manage entries, exits, stops, or position size. Those decisions are left to the trader.
The Higher Timeframe Pattern
An inside bar is a two candle pattern. The second candle's high is at or below the first candle's high, and its low is at or above the first candle's low — the whole candle sits within the range of the one before it. That is compression. Range has contracted, and unlike most patterns it carries no direction of its own. Both boundaries of the mother candle are live, and the market decides which one matters.
What Gets Drawn
Once the inside bar closes, the mother candle's high and low are drawn as solid lines. These are the levels a break has to clear, and they are what almost every published treatment of this pattern uses for entries and stops.
A shaded box spans the compression itself: from the mother candle through every inside bar, ending where the trading candle opens. The box shows the coil, the lines carry the levels forward through the trading candle.
Two target lines are projected at one times the mother candle's range, one above the high and one below the low. This is the measured move, the conventional objective for a range break. They are drawn from the trading candle's open, since that is when a target first becomes relevant. Every line stops when price trades through it, or when the trading candle ends, whichever comes first.
Nested Inside Bars
Inside bars often arrive in runs. When the trading candle turns out to be another inside bar — still entirely within the mother's range — the coil has not resolved, so nothing is reset. The mother candle's levels stay exactly where they are, the box extends, and the next candle takes over as the trading candle. A label on the box counts the inside bars whenever there is more than one, so a deep coil is visible at a glance.
Higher Timeframe Panel
The mother candle, every inside bar and the trading candle are redrawn to the right of the live chart, with the mother's levels marked across them. The trading candle updates live. On a long coil the mother candle is often well off the left of your screen. The panel is what lets you see the whole pattern without scrolling or switching timeframes.
Stats Dashboard
The table counts how past breaks on the selected higher timeframe resolved. A break is recorded the moment price trades outside the mother candle's range during the trading candle.
Breakout — after breaking, price reached the target before reaching the opposite boundary.
Failed breakout — after breaking, price reached the opposite boundary first.
Those two levels sit exactly one mother range either side of the break, so this is a symmetrical test rather than an arbitrary pairing.
A trading candle can break both boundaries, in which case both breaks are counted separately with their own outcomes. Breaks that have not yet resolved are excluded until they do, and setups still coiling are not counted at all, so the two percentages always sum to one hundred.
There is deliberately no win rate here. A failed breakout is a losing outcome to one trader and the entire premise to another, and it is not the indicator's place to decide which.
Please read this table for what it is. It is a count of what price did on the bars loaded in your chart. It is not a backtest and not a strategy report. No entry price, exit price, stop, commission, or slippage is assumed, because the indicator does not place trades. Past behaviour of a market does not indicate future behaviour.
Settings
Chart Theme — light or dark colour palette.
Stats Dashboard — show or hide the table.
Higher Timeframe — 15m, 1h, 4h, D, W or M.
HTF Candle Separators — vertical line at each higher timeframe open.
Show Target Lines — the measured move projections.
Alerts
An alert fires the first time price trades outside the mother candle's range in each direction, with a message naming the timeframe and the side, for example 1h inside bar broken up . A trading candle that breaks both boundaries produces two alerts. To use them, create an alert on the indicator and choose Any alert() function call as the condition.
Repainting
Historical bars are never restated. Specifically:
Higher timeframe candles are built by aggregating completed chart bars, so the pattern is only known once the inside bar has closed. request.security() with lookahead is not used anywhere in the script.
Levels come from candles that have already closed. Nothing is drawn at a price that could still change.
A break occurs once price trades through a level, which cannot be undone within a bar — once price has traded outside the range it has traded outside the range.
The box and the lines extend to the right as the trading candle progresses. That is a drawing being lengthened, not a value being changed.
Limitations
The mother candle defines the levels . Some traders use the inside bar's own high and low instead, for a tighter trigger and smaller risk. This tool does not draw those.
A break is any trade outside the range, wick or close . A candle that pokes through and closes back inside counts as a break. If you think of a break as requiring a close, the counts here will run higher than you expect.
On the higher timeframe itself , target lines, the inside bar count and the stats table are not shown. There the trading candle is a single bar, which cannot say whether a break or its outcome came first. The pattern, its levels and the box are still drawn.
Above the higher timeframe , nothing is drawn. Select a chart timeframe lower than the higher timeframe setting.
The panel is capped at twelve candles . A coil deeper than that still tracks correctly, but the panel shows the mother candle and the most recent inside bars rather than all of them.
Drawing objects are capped by the platform . On very long histories the oldest drawings will drop off the chart.
The stats table depends on how much history your plan loads , so the counts will differ between account types on the same instrument.
This is an indicator, not a strategy . It offers no entries, exits, stop levels, position sizing, or risk management, and makes no claim about profitability.
Disclaimer
This script is for informational and educational purposes only. It is not financial advice and not a recommendation to buy or sell anything. Trading involves substantial risk of loss. Test any tool thoroughly and make your own decisions. Penunjuk

Penunjuk

Penunjuk

Penunjuk

Penunjuk

Penunjuk

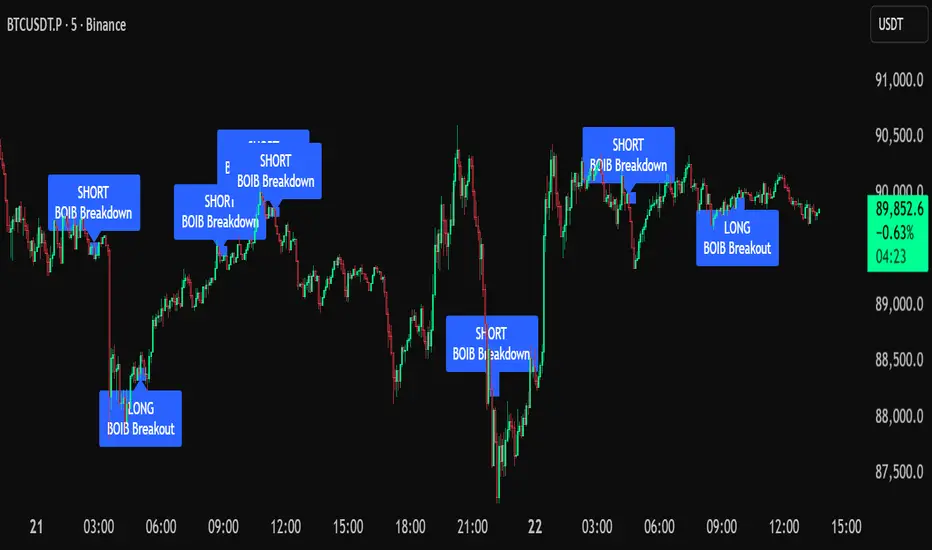
Inside / Outside BarsThis indicator highlights Inside Bars and Outside Bars directly on the chart, helping identify consolidation and expansion phases in price action.
Key Features:
Inside Bar Detection
An Inside Bar is a candle whose high and low are fully contained within the range of the previous candle.
This typically signals consolidation, reduced volatility, and potential buildup before a breakout.
Outside Bar Detection
An Outside Bar is a candle whose high is higher than the previous high and whose low is lower than the previous low.
This reflects range expansion, increased volatility, and possible reversal or continuation momentum.
Visual Highlighting
Inside and Outside Bars are clearly marked on the chart with customizable colors, allowing quick recognition without manual analysis.
Clean and Minimal Design
-The indicator is designed to avoid clutter, focusing only on key price action signals.
-Works on Any Market
-Can be applied to crypto, forex, stocks, and indices.
Use Cases:
-Identify breakout setups after consolidation (Inside Bars)
-Spot volatility expansion and potential reversals (Outside Bars)
-Combine with higher timeframe levels and liquidity concepts for improved decision-making
This tool is built for traders who rely on pure price action and want a clear, automated way to track key candle patterns. Penunjuk

Penunjuk
Penunjuk

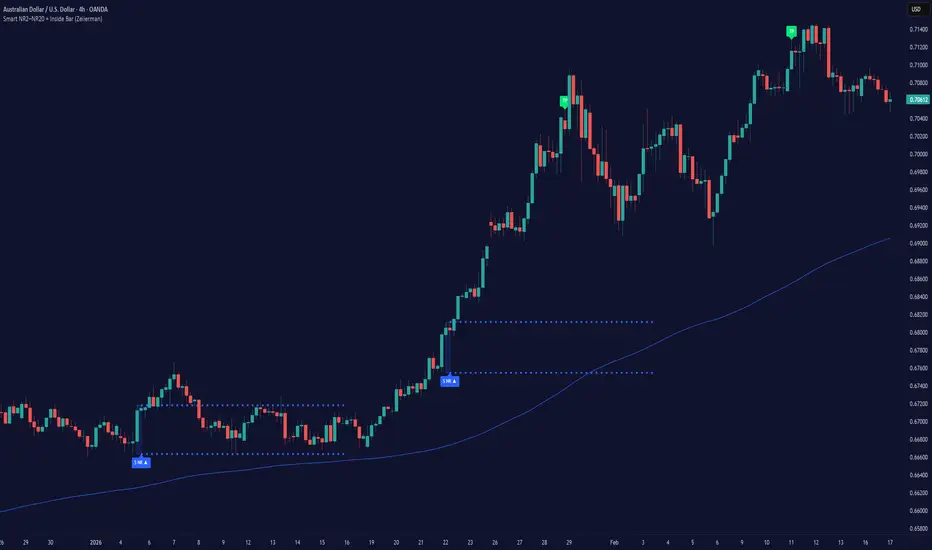
Smart NR2-NR20 and Inside Bar (Zeiierman)█ Overview
Smart NR2–NR20 + Inside Bar (Zeiierman) is a compression + breakout scanner that searches for the tightest Narrow Range (NR) condition across NR2…NR20, plus optional Inside Bar detection. When a valid compression forms, it draws a box around the setup, projects the high/low levels forward, and triggers on the first breakout. Optional Trend Filter logic can restrict triggers to trend-aligned breakouts, and optional Exit markers can annotate TP / SL / Time exits after a trigger.
🔘 What It Detects
The Smart Narrow Range (NR2…NR20) script continuously checks NR lengths from 2 to 20 and selects the most extreme contraction (tightest relative range vs history) inside the current Look Back window, highlighting the strongest “compression” zones where expansion risk is building. Optionally, it can also treat an Inside Bar as a valid compression trigger.
█ How It Works
⚪ 1) Compression Scan (NR Ranking Engine)
For each bar, the script evaluates NR2…NR20:
It calculates the N-bar range (highest high − lowest low).
It compares that range to prior N-bar ranges over Look Back.
It ranks candidates by “tightness” and keeps the strongest one.
Key effect:
Higher Look Back = fewer but higher-quality compressions
Lower Look Back = more frequent compressions
⚪ 2) Adaptive Look Back (Static or ADX-Adaptive)
Look Back can be:
Static: fixed comparison window
ADX Adaptive: Look Back dynamically shifts between LB Min and LB Max depending on trend strength
Conceptually:
Higher ADX (strong trend) — shorter Look Back (more responsive)
Lower ADX (chop/range) — longer Look Back (more selective)
█ How to Use
⚪ Bullish Setup
Wait for a tight range to form
Enter on a breakout above the range high
Stop below the opposite side of the range
Target a multiple of the range size or trail with momentum
Optional: wait for a small breakout retest before entering
⚪ Bearish Setup
Wait for a tight range to form
Enter on breakout below the range low
Stop above the opposite side of the range
Target a multiple of the range size or trail with weakness
Optional: enter on breakdown retest
█ Settings
Enable Inside Bar — toggles Inside Bar detection.
Look Back (compare window) — history window used to judge contraction quality.
Enable Trend Filter — gates long/short triggers relative to Trend MA.
Show Trend MA — plots the Trend MA on chart.
Trend MA Mode — Static or NR-Adaptive (length follows Look Back × multiplier).
MA Type — EMA or RMA smoothing for the Trend MA.
NR — MA Multiplier — scales adaptive MA length from Look Back.
Static MA Length — used when Trend MA Mode is Static.
Look Back Mode — Static or ADX Adaptive.
ADX Length / ADX Low / ADX High — controls adaptive response to trend strength.
LB Min / LB Max — bounds for adaptive Look Back range.
-----------------
Disclaimer
The content provided in my scripts, indicators, ideas, algorithms, and systems is for educational and informational purposes only. It does not constitute financial advice, investment recommendations, or a solicitation to buy or sell any financial instruments. I will not accept liability for any loss or damage, including without limitation any loss of profit, which may arise directly or indirectly from the use of or reliance on such information.
All investments involve risk, and the past performance of a security, industry, sector, market, financial product, trading strategy, backtest, or individual's trading does not guarantee future results or returns. Investors are fully responsible for any investment decisions they make. Such decisions should be based solely on an evaluation of their financial circumstances, investment objectives, risk tolerance, and liquidity needs.
Penunjuk

Penunjuk

Inside Candle Positional StrategyIntroduction
This strategy implements a structured Inside Candle breakout model designed to capture expansion moves following short-term price compression.
An inside candle represents a temporary contraction in volatility, where the entire range of the current bar is contained within the previous bar. The preceding bar becomes the Mother Candle, and its range defines the potential breakout boundaries.
The model focuses purely on price structure and predefined risk parameters rather than trend-following overlays or momentum filters.
Core Logic and Structure
Inside Candle Detection
An inside candle is defined as:
Current High < Previous High
Current Low > Previous Low
When this condition occurs, the previous bar is marked as the Mother Candle. Only one breakout attempt is allowed per identified structure to prevent repeated entries within the same consolidation phase.
Trade Entry Rules
Entries are executed at market on confirmed bar close.
Long Position
Close > Mother Candle High
No active position
Short Position
Close < Mother Candle Low
No active position
This ensures breakout confirmation rather than anticipatory positioning.
Risk Management Framework
Risk control is fully rule-based and determined at the moment of entry.
For each trade:
Initial Stop Loss = Opposite boundary of the Mother Candle
Risk = Distance between entry price and initial stop
Target = Entry ± (Risk × Risk-Reward Ratio)
The Risk-Reward Ratio is user configurable.
Only one position is active at any time (pyramiding disabled).
Optional ATR-Based Trailing Stop
An optional trailing mechanism may be enabled:
Trailing Stop updates on every confirmed bar.
Calculated using ATR × Multiplier.
Moves only in the direction of profit.
Never worsens beyond the initial stop level.
If disabled, exits rely solely on the fixed stop and target.
Execution Model
All signals are calculated on confirmed bar closes.
Entries are market orders.
Stop and target levels are evaluated using bar OHLC values.
No repainting logic is used.
No intrabar order sequencing assumptions are applied.
Backtest performance may differ from live execution due to slippage, spread, liquidity, and market conditions.
Visual Components
Inside candles are highlighted (default: yellow).
Entry, Initial Stop, Trailing Stop (if enabled), and Target levels are displayed using line-break formatting for clarity.
Designed to maintain structural visibility without excessive chart clutter.
Strategy Defaults
Initial Capital: $1000
Commission: 0.05%
Position Size: 1 (fixed quantity)
Pyramiding: Disabled
These defaults can be adjusted in the Strategy Properties panel.
Intended Application
This strategy is suited for studying breakout behavior after short-term consolidation phases.
Performance characteristics will vary depending on instrument volatility, timeframe, and market regime.
It is presented as a structural breakout framework and should be tested and adapted according to individual risk tolerance and trading objectives.
Disclaimer
Trading involves significant risk. This script is provided for educational and research purposes only and does not constitute financial advice. Users are responsible for evaluating its suitability for their own trading decisions. Strategi

Penunjuk

Toby Crabel's HisVolAs in Linda Raschke's Street smarts..... . This indicator shows the signals of Toby Crabel's Historical Volatility 6/100 strategy. The strategy assumes, that volatility contraction measured by two measures would give better results.
There is one other script that is a strategy , but it assumes that the signal requires both inside bar and narrowest range, what is not as in Linda Raschke's.
The strategy and what does the script do:
1) measures short-term unannualized volatility (by default six), long term uannualized volatility (by default 100), and measures the ratio of short volatility / long volatility.
2) checks if the current bar is an inside bar or has narrowest range out of last X bar (by default 4), or both,
3) puts an etiquette if short volatility / long volatility is equal to or smaller than 0,5 AND the day is inside bar, has narrowest range, or both.
Next day both buy-stop and sell-stop should be set. Buy-stop at the high and sell-stop at the low of the bar with etiquette.
This is by no means any financial advice, nor the historical results guarantee future gain.
Penunjuk

Penunjuk

Penunjuk
Penunjuk
Penunjuk
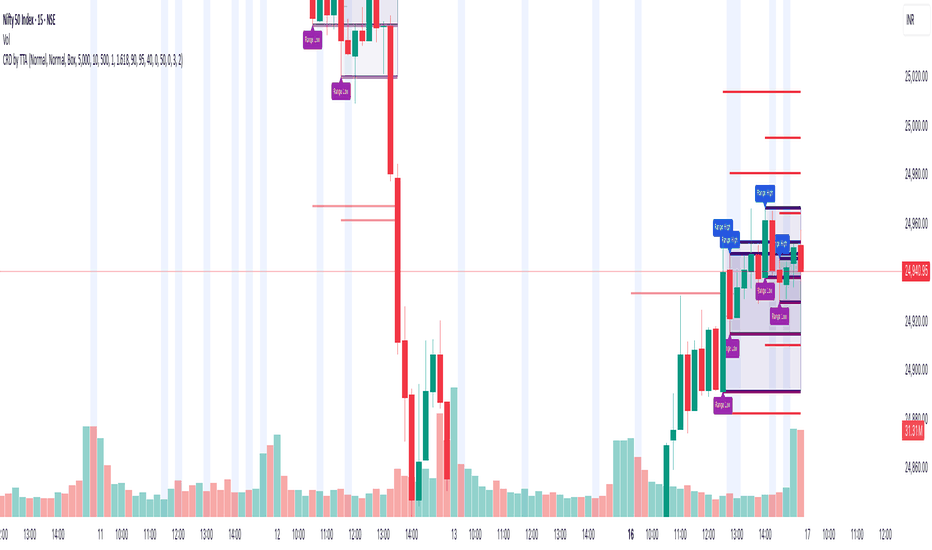
Candle Range Detector by TradeTech AnalysisCandle Range Detector by TradeTech Analysis
This advanced indicator identifies and visualizes price compression zones based on inside bar formations, then tracks how price behaves around those zones — offering valuable insights into liquidity sweeps, range expansions, and trap/mitigation behavior.
The script builds upon the foundational concept of range-based price action, commonly used by institutional traders, and adds automation, mitigation tracking, and sweep detection to map how price reacts around these critical ranges.
🔍 How It Works:
• Range Formation: A new range is detected when the current candle forms entirely within the high and low of the previous candle (i.e., an inside bar). This behavior often indicates price compression and potential breakout zones.
• Range Extension: Once a range is confirmed, the script projects upper and lower boundaries (using either a percentage-based multiplier or Fibonacci log extension), providing context for expected breakout zones.
• Mitigation Tracking: The script continuously monitors whether price breaks above or below the projected extensions, marking that range as mitigated — useful for confirming whether liquidity was absorbed.
• Sweep Detection: If price re-visits a mitigated zone and shows signs of a liquidity sweep (via wick + close behavior), the indicator triggers visual sweep labels and optional alerts.
🧠 Optional Visual Enhancements:
• Highlight range-forming candles with light blue background (toggle on/off)
• Midpoint dotted line for symmetry analysis
• Labels for “Range High” and “Range Low” for visual clarity
• Dynamic box drawing that adapts upon mitigation or continuation
⚙️ Customizable Features:
• Choose between Normal and Fibonacci-based detection modes
• Toggle visibility of range boxes, extension lines, and sweep markers
• Configure sweep alerts, mitigation window size, and visual transparency
⸻
🧪 Use Cases
• Identify consolidation zones before major price moves
• Confirm liquidity sweeps for entry/exit traps
• Visualize and test mitigation behavior of past zones
• Combine with Order Flow or Volume Profile tools to enhance context
⸻
⚠️ This is a fully original implementation that goes beyond classical inside-bar scanners by incorporating mitigation, extension projection, and liquidity sweeps — making it a powerful tool for intraday, swing, and even Smart Money-based trading setups. Penunjuk
Penunjuk

Penunjuk

Inside Bar with Swing PointsSwing Points with Inside Bar
This script combines swing point analysis with an inside bar pattern visualization, merging essential concepts to identify and visualize key price levels and potential trend reversals. This is especially useful for traders looking to understand price action through swing levels and reactions within inside bar boundaries, making it effective for short-term trend analysis and reversal zone identification.
Script Features:
Swing Point Analysis:
The script identifies swing points based on fractals with a configurable number of bars, allowing for a choice between three and five bars, helping traders fine-tune sensitivity to price movements.
Swing points are visualized as labels, highlighting potential reversal or continuation zones in the price chart.
Inside Bar Visualization:
Inside bars are defined as bars where both the high and low are contained within the previous bar. These often signal consolidation before a potential breakout.
The script displays boundaries of the mother bar (the initial bar encompassing inside bars) and colors candles accordingly, highlighting those within these boundaries.
This feature helps traders focus on price areas where a breakout or trend shift may occur.
Utility and Application:
The script enables traders to visualize inside bars and swing points, which is particularly useful for short-term traders focused on reversal or trend continuation strategies.
Combining swing point analysis with inside bar identification offers a unique approach, helping traders locate key consolidation zones that may precede significant price moves.
This provides not only strong support and resistance levels but also insights into probable breakout points.
How to Use the Script:
Set the number of bars for swing point analysis (3 or 5) to adjust fractal sensitivity.
Enable mother bar boundary visualization and color indication for inside bars to easily spot consolidation patterns.
Pay attention to areas with multiple swing points and inside bars, as these often signal potential reversal or breakout zones.
This script offers flexible tools for analyzing price movements through both swing analysis and consolidation zone identification, aiding decision-making under uncertainty and enhancing market structure understanding. Penunjuk

Penunjuk