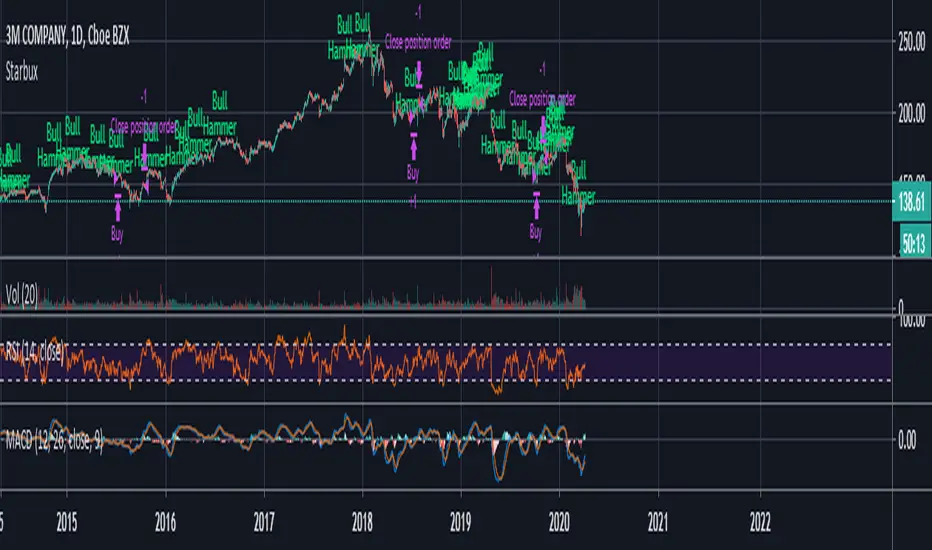
StarbuxI made this in starbucks . Bullish hammer trading signal algorithm using MACD for trend determination and holding period.Strategioleh FenixCapital113
DEMA Strategy with MACDThe Double Exponential Moving Average (DEMA) indicator was introduced in January 1994 by Patrick G. Mulloy, in an article in the "Technical Analysis of Stocks & Commodities" magazine: "Smoothing Data with Faster Moving Averages" It attempts to remove the inherent lag associated to Moving Averages by placing more weight on recent values. The name suggests this is achieved by applying a double exponential smoothing which is not the case. The name double comes from the fact that the value of an EMStrategioleh melihtuna7938
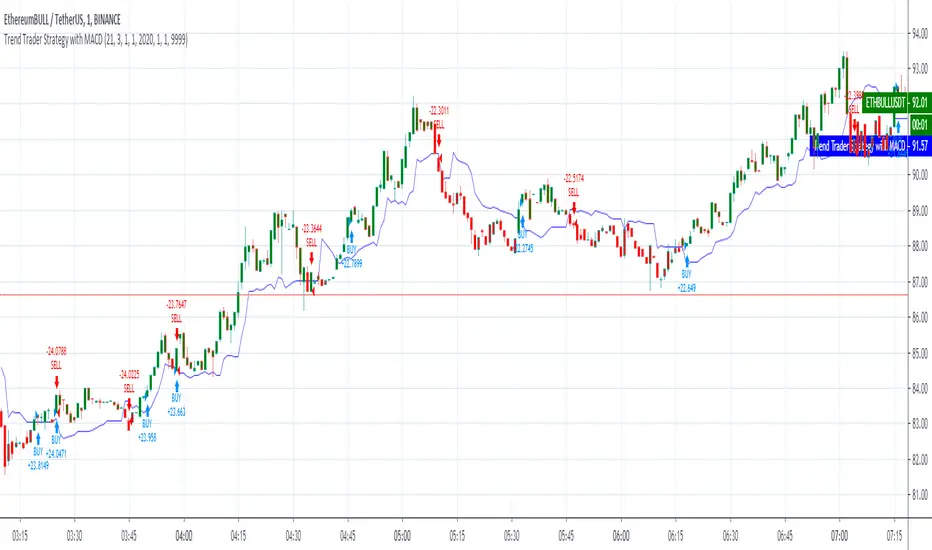
Trend Trader Strategy with MACDThis is plots the indicator developed by Andrew Abraham in the Trading the Trend article of TASC September 1998 The strategy I use has already been published explicitly by HPotter, you can review the core code from there. I have converted the existing strategy codes that have been published into the strategy and the result looks great but I noticed that the indicator performed too much in short periods like 1 minute and I thought it would be healthier to get MACD approval. MACD approval will coStrategioleh melihtuna9 1.5 K
MACD At Scales with AlertsI use the horizontal scale lines on the MACD indicator as part of my scalping strategy along with other indicators like RSI/EMA and Market Cipher B when trading BTC I am looking for a cross above or below the 12.5 and 25 horizontal scale lines, along with lining up other indicators I set my alerts on the 5 min TF and look to the 15 and 30 min TF's for further confirmation. I have find the scale lines to be very useful for visual reference of the crosses, above/below 25 lines is mostly a safPenunjukoleh sydneynetTelah dikemas kini 7218
WMA + MACD strategy with trailing stopHi! That's my first strategy. I already learn pine, so i will work on it more. Now i search how to make trailing stop working. "WMA + MACD strategy with traiing stop" is very simple strategy which is designated for stocks market. It is created only to take long positions. Buy signal is when WMA(120) is below price and macd(10,20,10) histogram is higher than 0. Position should be automaticly closed when price hits stoploss level. One transaction should be max 20% of our capital and stoplossStrategioleh heniu_11103
Quadratic Weighted (QWMA) MACDMACD but on the Quadratic Weighted Moving Average instead of regular Moving Average "The quadratic moving average ( QMA ) or quadratic weighted moving average (QWMA) is a type of moving average who is closer to the price when price is up trending. This moving average is defined as the square root of the moving average of the squared price." @alexgrover () Base MACD code from @RicardoSantos ()Penunjukoleh BilzerianCandle270
Ultimate Momentum IndicatorThis is an indicator I've been playing with for a while, based on my previous MACD w/ RSI Warning indicator. This one takes it a step further, including information from MACD, RSI, ADX, and Parabolic SAR. These four indicators are represented in this indicator as follows: MACD: The histogram itself is a normal MACD histogram. Nothing strange about it, and you can adjust the settings for it just as you would a normal MACD. RSI: Any time the RSI is outside of normal ranges (which can be adjPenunjukoleh JoshJaySalazar8462
Adam H Grimes - Keltner Channels with Day's High & LowThe indicator shows the day's high and low along with the Keltner Channels. Keltner Channel Period - 20 Keltner Channel Multiple - 2.25Penunjukoleh Senthaamizh2292
SMU Binary Decimal CandlesThis script creates a Decimal and Binary representation of the price using ROC. The idea is to simplify the price action into a distance from Zero to upside and downside. You can see clearly trend develops in the ROC in the decimal view, kind of like MACD but based on raw price action change. I'm' a big fan of raw price action, so my scripts are super simple. You can also use this script in a binary mode close higher = 1 and lower is -1. I use the binary mode to remove the psychological pressPenunjukoleh stockmarketupdate14246
Average Range Convergence DivergenceHi there, It's a script that plot the ATR (Average True Range) and ADR (Average Day Range) together and do an histogram of it. The histogram is the difference from ATR to ADR, I believe that it shows the average GAP in the asset. So I can easily found the offset to use when defining my stop. PT Esse script desenha o ATR (no profit True Range) e o ADR (media da diferença entre máximas e minimas) junto da diferença entre essas médias em formato de histograma. O gap médio de um ativo é mostrado nPenunjukoleh Vorfield317
MACD divergence with line drawing by RexioAnother appoach to finding divergences at MACD. This time I think it is much smoother so I could check for divergences between two "peaks" at MACD. I added my SL line which is last peak +- 1xATR. And the second line is peak between two points of divergence and most of the time it acts like an SR line. If the higher timeframe trend backs up our divergence (for example: higher trend UP - divergence for L position) I can try to jump in after crossing EMA10. This indicator is only sugestion for me. Penunjukoleh Rexio11 1 K
CM_MacD_Ult_MTF_Custom_MeglestusBased of off ChrisMoody his version of this With some customization from my side to make it more reliable on BTC, Crypto. I have made it a long time ago so I am not too sure on what it all uses, just look through the code :PPenunjukoleh MeglestusTelah dikemas kini 1111
MACD_RSI strategyUse three indicator to entry a position EMA (20), MACD (12, 26, 20), RSI (14) apply ema20 on rsi as signal line Entry long when price above EMA20, MACD above signal line and RSI above signal line Entry short when price below EMA20, MACD below signal line and RSI below signal line Study only, use it under your own risk.Strategioleh fangdingjun5726
Point and Figure (PnF) MACDThis is live and non-repainting Point and Figure Chart MACD tool. The script has it’s own P&F engine and not using integrated function of Trading View. Point and Figure method is over 150 years old. It consist of columns that represent filtered price movements. Time is not a factor on P&F chart but as you can see with this script P&F chart created on time chart. P&F chart provide several advantages, some of them are filtering insignificant price movements and noise, focusing on important priPenunjukoleh LonesomeTheBlue4377
MacD (Future Known or Unknown) StrategyThis indicator/strategy is to be used as a way to baseline the top potential any strategy could have with other strategies and indicators. What I have created literally shows the BEST moves possible you could have made in my opinion for SHORTING or LONGING using only the MacD values of the 4 hour while on the 30 minute chart. To use this, try checking out XBTUSD on the 30 minute chart . It will work under different time frames but works best on the 30 minute chart in my opinion. It WILStrategioleh Gentleman-Goat21384
New RenaissancePrelim version of MACD long entry and exit with custom time frame selector. To do: Add Stoch and Stoch RSI criteria.Strategioleh CranialNerve79
Commodity Channel Index MACD I've not seen any reprensentation of this type based on CCI chanel.... This indicator is an hybrid between CCI and MACD. The CCI MACD line is calculated using a moving average between 2 CCI period a (FastCCI - SlowCCI) aplied on the (Fast + Slow) periods The CCI signal line is a moving average of (CCI MACD line, on the signal line smoothing length. The histogram is only the difference between the CCI MACD and CCI Signal line //--------CODER--------// R.VPenunjukoleh RVD-Projects86
unRekt - KISS MacdieMacdie is the MACD 'Moving Average Convergence Divergence' indicator and is part of the 'keeping it simple' series that have a similar color scheme. MACD is based on the difference between two moving averages calculated for different periods, typically 12 and 26. The MACD can show trend and strength of an asset while also showing Divergences.Penunjukoleh Upland138
VMACDIntended to be used in exactly the same way as the built-in MACD, but uses volume-weighted moving averages instead. This gives it a tiny edge for spotting high volume breakouts.Penunjukoleh saolof125
Minkowski Distance Factor Adaptive Period MACDHi, this script comes from the idea that Ricardo Santos' Minkovski Distance Function is transferred to the period as a factor. Minkowski distance is used as a percentage factor with the help of Relative Strength Index function. Minkowski Distance Function Script : And thus an adaptive MACD was created. This script can give much better results in more optimized larger periods. I leave the decision to determine the periods and weights. I used the weights of 9,12,26 and periods createdPenunjukoleh NoldoTelah dikemas kini 3125
[fikira] MACD & RSI+Stoch + DivergencesThis is a new version of my "Divergences" Compared to my "Divergences (Pivots)", this is calculated totally different There are 3 options: - MACD - RSI - Stoch RSI Since this script is very heavy in calculation it is limited in time (= inspired from a script of "Che_Trader") Also it uses "max_bars_back" (=1000) For MACD and Stoch RSI there is a "custom Divergences Period", which compares more then 7 Pivot Points, the higher the number, the less reliable, it is not necessary to use this,Penunjukoleh fikiraTelah dikemas kini 50 3.2 K
MACD 4H StrategyThis strategy is a basic example of using MACD AND the instrument must be found an appropriate timeframe (4H recommended) before being tested with.Strategioleh acolyteeTelah dikemas kini 69
ANN BTC MTF Golden Cross Period MACDHi, this is the MACD version of the ANN BTC Multi Timeframe Script. The MACD Periods were approximated to the Golden Cross values. MACD Lengths : Signal Length = 25 Fast Length = 50 Slow Length = 200 Regards.Penunjukoleh Noldo5382