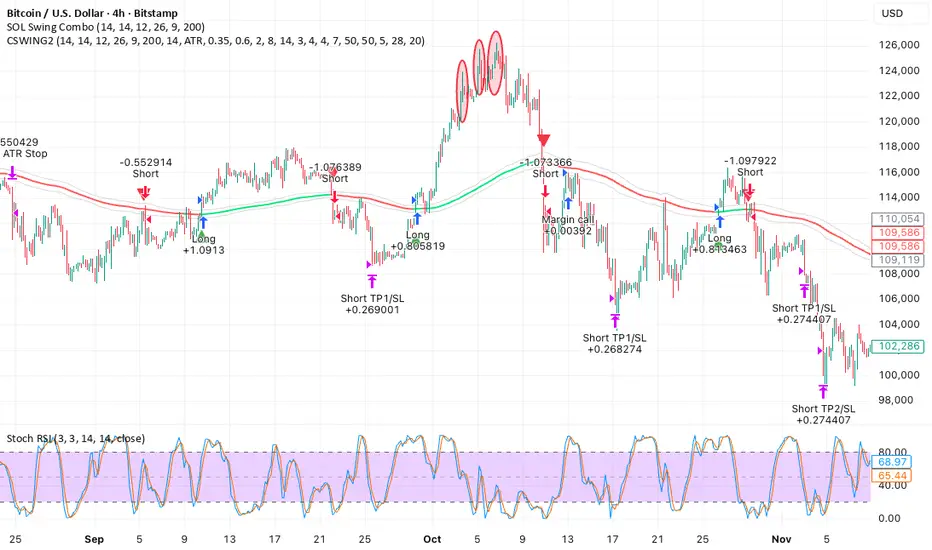
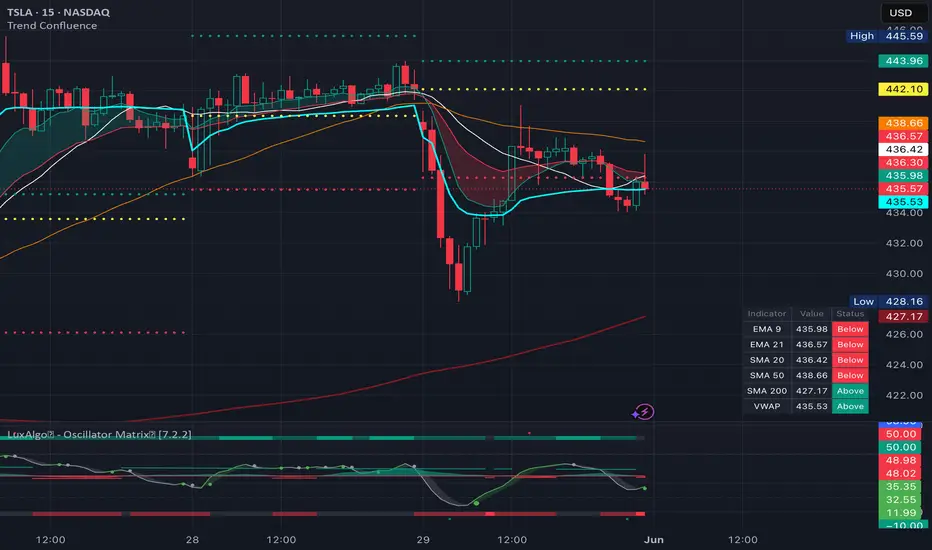
SPX Market Pressure & Momentum OutlookSPX Market Pressure is a professional market-reading dashboard designed to help traders understand liquidity pressure, market participation, risk appetite, volatility conditions, and momentum exhaustion probability through a structured intermarket framework.
This indicator is NOT a buy signal, sell signal, strategy, forecasting model, or market prediction tool.
Its purpose is to provide context, market structure awareness, and probability-based decision support by combining multiple market components into a single dashboard.
━━━━━━━━━━━━━━━━━━━━━━━━━━━━━━━━━━━━━━
RECOMMENDED MARKETS
━━━━━━━━━━━━━━━━━━━━━━━━━━━━━━━━━━━━━━
This indicator was primarily designed for:
• SPX
• ES Futures
• NQ Futures
• SPY
• QQQ
• Other major U.S. index-related instruments
The intermarket logic relies on relationships between SPY, QQQ, IWM, and VIX. Therefore, the most accurate results are generally achieved when used on U.S. equity index markets.
━━━━━━━━━━━━━━━━━━━━━━━━━━━━━━━━━━━━━━
WHAT THE INDICATOR MEASURES
━━━━━━━━━━━━━━━━━━━━━━━━━━━━━━━━━━━━━━
The dashboard combines several independent market components:
• Liquidity Pressure
• Market Participation
• Risk Appetite
• Volatility Conditions
• Momentum Condition
• Momentum Exhaustion Probability
Each component contributes information about the current market environment rather than attempting to predict future price direction.
━━━━━━━━━━━━━━━━━━━━━━━━━━━━━━━━━━━━━━
SPY & QQQ LIQUIDITY ENGINE
━━━━━━━━━━━━━━━━━━━━━━━━━━━━━━━━━━━━━━
The foundation of the indicator is a proprietary liquidity pressure model built around SPY and QQQ.
The model evaluates:
• Close Location within the candle range
• Candle Body Pressure
• ATR-normalized Momentum
• Relative Volume Participation
The output is converted into directional liquidity pressure scores representing:
• Demand
• Supply
• Neutral Conditions
This creates a structured view of where institutional participation is currently flowing.
━━━━━━━━━━━━━━━━━━━━━━━━━━━━━━━━━━━━━━
SIGMA (Σ SPY + QQQ)
━━━━━━━━━━━━━━━━━━━━━━━━━━━━━━━━━━━━━━
Sigma combines SPY and QQQ liquidity pressure into a single market participation engine.
Rather than using price alone, Sigma evaluates the combined liquidity behavior of both major index ETFs.
Strong Sigma readings indicate broad participation.
Weak or conflicting Sigma readings may indicate deteriorating market participation.
Sigma serves as the primary market pressure reference inside the dashboard.
━━━━━━━━━━━━━━━━━━━━━━━━━━━━━━━━━━━━━━
IWM RISK APPETITE ENGINE
━━━━━━━━━━━━━━━━━━━━━━━━━━━━━━━━━━━━━━
IWM acts as a risk appetite reference.
Strong IWM participation generally suggests:
• Healthy market participation
• Broader market involvement
• Risk-On conditions
Weak IWM participation may suggest:
• Narrow leadership
• Defensive positioning
• Risk-Off behavior
IWM is used as a confirmation component rather than a directional signal.
━━━━━━━━━━━━━━━━━━━━━━━━━━━━━━━━━━━━━━
VIX VOLATILITY ENGINE
━━━━━━━━━━━━━━━━━━━━━━━━━━━━━━━━━━━━━━
The indicator evaluates volatility conditions using VIX.
Instead of relying only on raw VIX values, the model also evaluates:
• Relative VIX positioning
• Volatility expansion
• Volatility compression
• VIX Bollinger Band location
This helps determine whether market volatility is:
• Normal
• Elevated
• High
• Extreme
Volatility is treated as a market condition measurement, not a directional forecast.
━━━━━━━━━━━━━━━━━━━━━━━━━━━━━━━━━━━━━━
MARKET SUPPORT
━━━━━━━━━━━━━━━━━━━━━━━━━━━━━━━━━━━━━━
Market Support measures whether current liquidity pressure is supported by the broader market environment.
Inputs used:
• Sigma
• IWM
• VIX
Possible states include:
• Strong Bull Support
• Bull Support
• Neutral
• Bear Support
• Strong Bear Support
Market Support measures participation quality, not future price direction.
━━━━━━━━━━━━━━━━━━━━━━━━━━━━━━━━━━━━━━
CURRENT SYMBOL OUTLOOK ENGINE
━━━━━━━━━━━━━━━━━━━━━━━━━━━━━━━━━━━━━━
The Outlook Engine dynamically analyzes the active chart symbol.
The engine automatically adapts to whichever symbol the indicator is attached to.
Examples:
• SPX Outlook
• ES Outlook
• NQ Outlook
• SPY Outlook
• QQQ Outlook
The Outlook Engine is designed to evaluate:
• Momentum Condition
• Momentum Maturity
• Momentum Exhaustion Probability
It does NOT attempt to forecast reversals or predict future trends.
━━━━━━━━━━━━━━━━━━━━━━━━━━━━━━━━━━━━━━
DYNAMIC RSI EXHAUSTION MODEL
━━━━━━━━━━━━━━━━━━━━━━━━━━━━━━━━━━━━━━
A major component of the Outlook Engine is the Dynamic RSI Exhaustion Model.
Unlike traditional RSI systems, RSI alignment is NOT treated as a bullish or bearish signal.
Instead, the engine evaluates:
• Current RSI
• Daily RSI
• Distance between both values
• RSI Rate of Change
As Current RSI approaches Daily RSI, the engine measures momentum maturity and potential exhaustion risk.
Examples:
Daily RSI = 75
Current RSI = 45
→ Significant expansion capacity remains.
Current RSI = 68
→ Momentum becoming mature.
Current RSI = 73
→ Elevated exhaustion probability.
Current RSI = 76
→ Very high exhaustion probability.
The model is designed to identify momentum maturity rather than overbought/oversold trading signals.
━━━━━━━━━━━━━━━━━━━━━━━━━━━━━━━━━━━━━━
ATR EXPANSION ANALYSIS
━━━━━━━━━━━━━━━━━━━━━━━━━━━━━━━━━━━━━━
ATR is used to evaluate movement expansion.
The indicator compares:
• Current ATR
• Long-Term ATR Average
Strong ATR expansion suggests:
• Active participation
• Expanding movement
• Sustained momentum conditions
Weak ATR relative to its historical average may indicate:
• Slowing participation
• Drying liquidity
• Increasing exhaustion probability
ATR is never used as a directional indicator.
━━━━━━━━━━━━━━━━━━━━━━━━━━━━━━━━━━━━━━
VOLATILITY ENGINE
━━━━━━━━━━━━━━━━━━━━━━━━━━━━━━━━━━━━━━
The Volatility Engine combines multiple components:
• Current Symbol ATR Expansion
• Current Symbol Range Expansion
• VIX Environment
• Sigma Stability
This allows volatility conditions to adapt dynamically to the chart currently being analyzed.
Possible outputs:
• Normal Volatility
• Elevated Volatility
• High Volatility
• Extreme Volatility
Volatility measures movement intensity, not direction.
━━━━━━━━━━━━━━━━━━━━━━━━━━━━━━━━━━━━━━
OUTLOOK STATES
━━━━━━━━━━━━━━━━━━━━━━━━━━━━━━━━━━━━━━
The Outlook Engine produces five primary states:
• Momentum Building
• Momentum Active
• Momentum Watch
• Exhaustion Watch
• High Exhaustion Probability
These states represent probability-based market conditions rather than trading signals.
━━━━━━━━━━━━━━━━━━━━━━━━━━━━━━━━━━━━━━
HOW TO USE THE INDICATOR
━━━━━━━━━━━━━━━━━━━━━━━━━━━━━━━━━━━━━━
1. Start with Sigma
Determine whether broad liquidity pressure is favoring Demand or Supply.
2. Review IWM
Evaluate whether broader market participation supports the current environment.
3. Review VIX
Assess volatility conditions and risk environment.
4. Check Market Support
Determine whether the current liquidity environment is supported by broader market participation.
5. Review Outlook
Analyze momentum condition and exhaustion probability for the active chart symbol.
6. Review Volatility
Determine whether the current environment is operating under Normal, Elevated, High, or Extreme volatility conditions.
The strongest environments typically occur when liquidity pressure, market participation, and risk conditions align.
━━━━━━━━━━━━━━━━━━━━━━━━━━━━━━━━━━━━━━
IMPORTANT DISCLAIMER
━━━━━━━━━━━━━━━━━━━━━━━━━━━━━━━━━━━━━━
SPX Market Pressure is a market-reading and decision-support tool.
It is not a trading strategy.
It does not generate buy signals.
It does not generate sell signals.
It does not predict market direction.
It does not forecast future price movement.
All outputs represent market context, participation quality, volatility conditions, momentum condition, and probability-based exhaustion analysis intended to assist traders in making more informed decisions.
هو داشبورد احترافي لقراءة السوق، تم تصميمه لمساعدة المتداول على فهم ضغط السيولة، مشاركة السوق، شهية المخاطرة، حالة التذبذب، واحتمالية إرهاق الزخم من خلال إطار تحليل مترابط يجمع عدة مكونات سوقية في مكان واحد.
هذا المؤشر ليس نظام توصيات، وليس استراتيجية تداول، ولا يقدم إشارات شراء أو بيع، ولا يتنبأ بحركة السوق المستقبلية.
الهدف منه هو توفير مرجع بصري منظم يساعد المتداول على فهم البيئة الحالية للسوق واتخاذ قرارات أكثر وعياً بناءً على السياق العام للسوق.
━━━━━━━━━━━━━━━━━━━━━━━━━━━━━━━━━━━━━━
الأسواق الموصى باستخدام المؤشر عليها
━━━━━━━━━━━━━━━━━━━━━━━━━━━━━━━━━━━━━━
تم تصميم المؤشر أساساً لأسواق المؤشرات الأمريكية، ويعطي أفضل نتائجه عند استخدامه على:
• SPX
• ES Futures
• NQ Futures
• SPY
• QQQ
ويعتمد جزء كبير من منطقه التحليلي على العلاقة بين:
• SPY
• QQQ
• IWM
• VIX
لذلك يوصى باستخدامه على الأسواق الأمريكية والمؤشرات المرتبطة بها.
━━━━━━━━━━━━━━━━━━━━━━━━━━━━━━━━━━━━━━
ماذا يقيس المؤشر؟
━━━━━━━━━━━━━━━━━━━━━━━━━━━━━━━━━━━━━━
يجمع المؤشر عدة عناصر سوقية مختلفة داخل لوحة واحدة:
• ضغط السيولة (Liquidity Pressure)
• مشاركة السوق (Market Participation)
• شهية المخاطرة (Risk Appetite)
• حالة التذبذب (Volatility Conditions)
• حالة الزخم (Momentum Condition)
• احتمالية إرهاق الزخم (Momentum Exhaustion Probability)
المؤشر لا يحاول التنبؤ بالمستقبل، وإنما يقيس حالة السوق الحالية وجودة الحركة القائمة.
━━━━━━━━━━━━━━━━━━━━━━━━━━━━━━━━━━━━━━
محرك السيولة SPY و QQQ
━━━━━━━━━━━━━━━━━━━━━━━━━━━━━━━━━━━━━━
يعتمد أساس المؤشر على نموذج خاص لقياس ضغط السيولة في SPY و QQQ.
يقوم النموذج بتحليل:
• موقع الإغلاق داخل الشمعة
• قوة جسم الشمعة
• الزخم مقارنة بالـ ATR
• الفوليوم النسبي مقارنة بمتوسط الفوليوم
ثم يتم تحويل هذه البيانات إلى درجات تمثل:
• Demand
• Supply
• Neutral
وذلك بهدف قياس اتجاه السيولة الحالية داخل السوق.
━━━━━━━━━━━━━━━━━━━━━━━━━━━━━━━━━━━━━━
سيجما Σ SPY + QQQ
━━━━━━━━━━━━━━━━━━━━━━━━━━━━━━━━━━━━━━
تمثل سيجما الدمج بين قراءات SPY و QQQ داخل مؤشر واحد.
لا تعتمد سيجما على السعر فقط، بل تعتمد على ضغط السيولة الناتج من كلا السوقين.
عندما تكون سيجما قوية فهذا يشير عادة إلى مشاركة واسعة من السوق.
أما ضعف أو تضارب سيجما فقد يدل على تراجع المشاركة أو ضعف البيئة الحالية للحركة.
وتعتبر سيجما المرجع الأساسي لقراءة ضغط السوق داخل المؤشر.
━━━━━━━━━━━━━━━━━━━━━━━━━━━━━━━━━━━━━━
IWM وقياس شهية المخاطرة
━━━━━━━━━━━━━━━━━━━━━━━━━━━━━━━━━━━━━━
يستخدم IWM كمرجع لقياس شهية المخاطرة داخل السوق.
عندما يكون IWM قوياً فقد يدل ذلك على:
• مشاركة أوسع من السوق
• بيئة Risk-On
• استعداد أكبر للمخاطرة
أما عندما يكون ضعيفاً فقد يدل ذلك على:
• ضعف المشاركة
• تركيز السيولة في عدد محدود من الأسهم
• بيئة Risk-Off
ولا يستخدم IWM كإشارة تداول بل كعامل داعم لقراءة البيئة الحالية.
━━━━━━━━━━━━━━━━━━━━━━━━━━━━━━━━━━━━━━
VIX ومحرك التذبذب
━━━━━━━━━━━━━━━━━━━━━━━━━━━━━━━━━━━━━━
يقوم المؤشر بتحليل مؤشر الخوف VIX لتقييم حالة التذبذب في السوق.
ولا يعتمد فقط على قيمة VIX الخام، بل يستخدم أيضاً:
• موقع VIX بالنسبة لبولينجر باند
• توسع التذبذب
• انكماش التذبذب
• البيئة العامة للمخاطرة
ويتم تصنيف حالة التذبذب إلى:
• Normal Volatility
• Elevated Volatility
• High Volatility
• Extreme Volatility
ويجب التنبيه إلى أن التذبذب لا يعني صعوداً أو هبوطاً، وإنما يقيس قوة واتساع الحركة فقط.
━━━━━━━━━━━━━━━━━━━━━━━━━━━━━━━━━━━━━━
Market Support
━━━━━━━━━━━━━━━━━━━━━━━━━━━━━━━━━━━━━━
يقيس Market Support مدى دعم البيئة العامة للحركة الحالية.
ويعتمد على:
• Sigma
• IWM
• VIX
وتظهر النتائج على شكل:
• Strong Bull Support
• Bull Support
• Neutral
• Bear Support
• Strong Bear Support
وهو لا يتنبأ بالاتجاه القادم، بل يقيس مدى توافق البيئة الحالية مع ضغط السوق القائم.
━━━━━━━━━━━━━━━━━━━━━━━━━━━━━━━━━━━━━━
محرك Outlook للرمز الحالي
━━━━━━━━━━━━━━━━━━━━━━━━━━━━━━━━━━━━━━
يقوم Outlook بتحليل الرمز المفتوح حالياً بشكل تلقائي.
فإذا كنت تتابع:
• SPX
• ES
• NQ
• SPY
• QQQ
سيقوم المؤشر بإنشاء Outlook خاص بالرمز الحالي.
هدف Outlook هو تقييم:
• حالة الزخم الحالية
• نضج الزخم
• احتمالية إرهاق الزخم
وليس التنبؤ بالانعكاسات أو الاتجاهات المستقبلية.
━━━━━━━━━━━━━━━━━━━━━━━━━━━━━━━━━━━━━━
نموذج الإرهاق الديناميكي RSI
━━━━━━━━━━━━━━━━━━━━━━━━━━━━━━━━━━━━━━
أحد أهم أجزاء المؤشر هو نموذج الإرهاق الديناميكي المبني على RSI.
على عكس الأنظمة التقليدية، لا يتم التعامل مع تقارب RSI كإشارة صعود أو هبوط.
بدلاً من ذلك يتم قياس:
• RSI الحالي
• RSI اليومي
• المسافة بينهما
• سرعة تغير RSI
كلما اقترب RSI الحالي من RSI اليومي تبدأ احتمالية نضج الحركة وإرهاق الزخم بالارتفاع.
مثال:
إذا كان RSI اليومي = 75
وكان RSI الحالي = 45
فهذا يعني أن الحركة ما زال أمامها مساحة للتوسع.
أما إذا كان RSI الحالي = 73
فهذا يعني أن الزخم أصبح أكثر نضجاً واحتمالية الإرهاق ارتفعت.
أما إذا تجاوز RSI الحالي RSI اليومي
فقد ترتفع احتمالية الإرهاق بشكل أكبر.
هذا النموذج لا يستخدم للتنبؤ بالانعكاس، بل لقياس درجة نضج الحركة الحالية.
━━━━━━━━━━━━━━━━━━━━━━━━━━━━━━━━━━━━━━
تحليل ATR
━━━━━━━━━━━━━━━━━━━━━━━━━━━━━━━━━━━━━━
يقوم المؤشر بمقارنة:
• ATR الحالي
• متوسط ATR طويل المدى
عندما يكون ATR الحالي أعلى من متوسطه التاريخي فهذا يدل غالباً على:
• حركة نشطة
• توسع في الحركة
• استمرار الزخم
أما انخفاض ATR مقارنة بمتوسطه فقد يشير إلى:
• ضعف المشاركة
• تباطؤ الحركة
• ارتفاع احتمالية الإرهاق
ولا يستخدم ATR لتحديد الاتجاه وإنما لقياس جودة الحركة واتساعها.
━━━━━━━━━━━━━━━━━━━━━━━━━━━━━━━━━━━━━━
محرك Volatility
━━━━━━━━━━━━━━━━━━━━━━━━━━━━━━━━━━━━━━
يقيس محرك التذبذب حالة الحركة الحالية من خلال دمج عدة عناصر:
• توسع ATR للرمز الحالي
• توسع مدى الحركة للرمز الحالي
• بيئة VIX
• استقرار أو تذبذب Sigma
وبذلك تصبح قراءة التذبذب مرتبطة بالرمز المفتوح حالياً وليس بالسوق بشكل عام فقط.
وتظهر النتائج على شكل:
• Normal Volatility
• Elevated Volatility
• High Volatility
• Extreme Volatility
التذبذب يقيس قوة الحركة وليس اتجاهها.
━━━━━━━━━━━━━━━━━━━━━━━━━━━━━━━━━━━━━━
حالات Outlook
━━━━━━━━━━━━━━━━━━━━━━━━━━━━━━━━━━━━━━
يعرض Outlook خمس حالات رئيسية:
• Momentum Building
• Momentum Active
• Momentum Watch
• Exhaustion Watch
• High Exhaustion Probability
وتمثل هذه الحالات احتمالات وظروف سوقية حالية وليست إشارات تداول.
━━━━━━━━━━━━━━━━━━━━━━━━━━━━━━━━━━━━━━
طريقة استخدام المؤشر
━━━━━━━━━━━━━━━━━━━━━━━━━━━━━━━━━━━━━━
1. ابدأ بقراءة Sigma
لمعرفة ما إذا كانت السيولة الحالية تميل إلى Demand أو Supply.
2. راقب IWM
لتقييم جودة المشاركة واتساع الحركة داخل السوق.
3. راقب VIX
لفهم بيئة المخاطرة والتذبذب الحالية.
4. راجع Market Support
لمعرفة ما إذا كانت البيئة العامة تدعم الحركة الحالية أم لا.
5. راجع Outlook
لتقييم حالة الزخم واحتمالية الإرهاق على الرمز المفتوح حالياً.
6. راجع Volatility
لمعرفة ما إذا كانت الحركة الحالية طبيعية أو مرتفعة التذبذب أو شديدة التذبذب.
أقوى البيئات عادة تكون عندما تتوافق السيولة ومشاركة السوق وشهية المخاطرة مع بعضها البعض.
━━━━━━━━━━━━━━━━━━━━━━━━━━━━━━━━━━━━━━
إخلاء مسؤولية
━━━━━━━━━━━━━━━━━━━━━━━━━━━━━━━━━━━━━━
SPX Market Pressure هو أداة لقراءة السوق ومساعدة المتداول على فهم البيئة الحالية للسوق.
المؤشر ليس استراتيجية تداول.
لا يقدم إشارات شراء.
لا يقدم إشارات بيع.
لا يتنبأ باتجاه السوق.
لا يتنبأ بالسعر المستقبلي.
جميع القراءات تمثل ظروفاً واحتمالات وسياقاً سوقياً يساعد المتداول على اتخاذ قرارات أكثر وعياً، ولا تمثل أي ضمان أو توصية استثمارية. Penunjuk

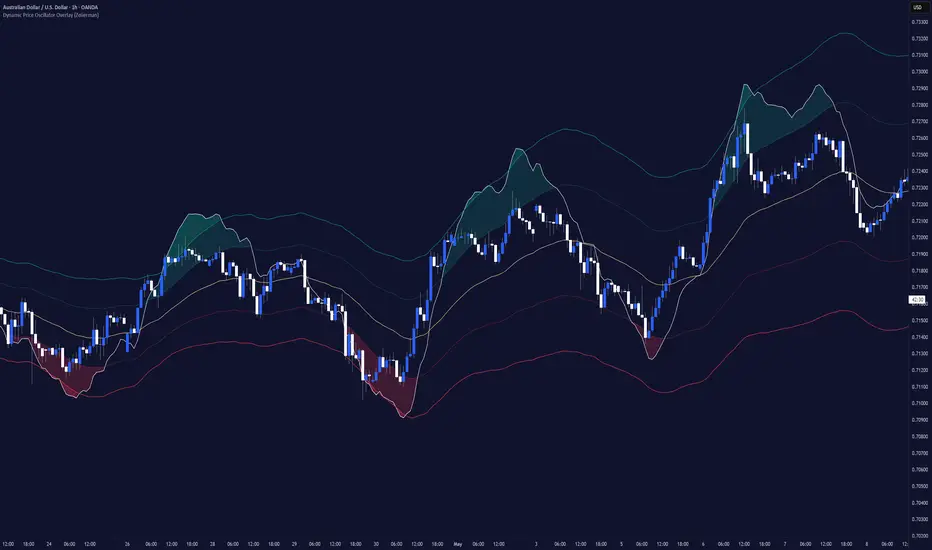
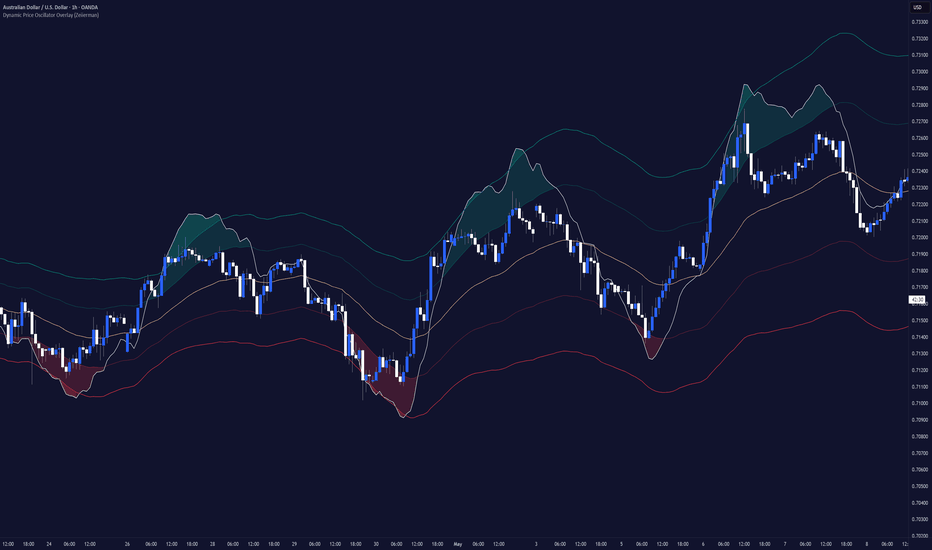
Dynamic Price Oscillator Overlay (Zeiierman)█ Overview
Dynamic Price Oscillator Overlay (Zeiierman) is a volatility-adjusted momentum overlay that transforms oscillator behavior directly onto the price chart.
Instead of displaying momentum in a separate pane, the indicator wraps a dynamic oscillator around an adaptive price anchor, allowing traders to visualize momentum expansion, contraction, and directional bias directly within price action.
The calculation combines long-term price displacement with volatility-adjusted movement and then applies Bollinger Band analysis to identify statistically stretched market conditions.
The result is a dynamic price-following structure that highlights momentum extremes, trend transitions, and overextended conditions while remaining visually integrated with the chart.
█ How It Works
⚪ Volatility-Adjusted Price Engine
The indicator begins by measuring market volatility using True Range.
volAdjPrice = ta.ema(trueRange(high, low, close), length)
This creates a dynamic volatility component that adapts to changing market conditions.
⚪ Dual Momentum Calculation
The oscillator combines two independent measurements:
• Long-term price displacement
priceChange = close - close
• Volatility-adjusted price movement
priceDelta = close - volAdjPrice
These components are blended together and smoothed.
oscillator = ta.ema(math.avg(priceDelta, priceChange), smoothFactor)
The result is a momentum engine that reacts to both directional movement and changing volatility.
⚪ Dynamic Oscillator Bands
The oscillator is surrounded by two Bollinger Band structures.
Standard bands identify elevated momentum conditions while expanded bands identify extreme momentum conditions.
= bollingerBands(oscillator, length * 5, 1)
= bollingerBands(oscillator, length * 5, 2)
These bands create adaptive thresholds that expand and contract as market behavior changes.
⚪ Dynamic Mean
The indicator calculates a central equilibrium level using the midpoint of the expanded Bollinger Bands.
mean = math.avg(bbHighExp, bbLowExp)
This serves as the oscillator's primary trend reference.
⚪ Price Overlay Projection
Rather than plotting the oscillator separately, the indicator wraps the oscillator around a moving price anchor.
priceAnchor = ta.ema(close, anchorLength)
The oscillator is projected directly onto the chart:
overlayOsc = priceAnchor + oscillator - mean
This creates a momentum structure that follows price while preserving oscillator behavior.
█ How to Use
⚪ Dynamic Price Oscillator Overlay
• When the oscillator line remains above the Dynamic Mean, momentum conditions are generally bullish.
• When the oscillator line remains below the Dynamic Mean, momentum conditions are generally bearish.
⚪ Mean Crosses
The Dynamic Mean acts as the primary trend reference.
• Bullish Cross:
The oscillator line crosses above the mean.
• Bearish Cross:
The oscillator line crosses below the mean.
These signals often represent transitions between bullish and bearish momentum regimes.
⚪ Mean Retests
The Dynamic Mean acts as the primary momentum equilibrium level.
• Bullish Retest:
The price pulls back toward the mean from above and holds.
• Bearish Retest:
The price rallies back toward the mean from below and rejects.
Successful retests suggest the current momentum regime remains intact and may continue in the prevailing direction.
⚪ Bollinger Breakouts
The standard Bollinger Bands identify strong momentum expansions.
• Bullish Breakout:
The oscillator line closes above the upper band.
• Bearish Breakout:
The oscillator line closes below the lower band.
These conditions suggest momentum is becoming unusually strong. Bullish breakouts above the upper band may indicate overbought conditions, while bearish breakouts below the lower band may indicate oversold conditions.
⚪ Expanded Bollinger Extremes
The expanded Bollinger Bands represent statistically extreme momentum conditions.
• Bullish Extreme:
The oscillator line exceeds the expanded upper band.
• Bearish Extreme:
The oscillator line exceeds the expanded lower band.
These events occur less frequently and often identify powerful directional moves or temporary exhaustion phases.
⚪ Momentum Context
The indicator should not be viewed as a simple overbought or oversold tool.
Instead, it measures how far momentum has deviated from its dynamic equilibrium while continuously adapting to current volatility conditions.
The interaction between the oscillator, mean, and adaptive bands provides a framework for identifying:
• Trend continuation
• Momentum expansion
• Momentum exhaustion
• Volatility shifts
• Regime transitions
The result is a price-integrated momentum model that provides both trend context and extreme-condition analysis within a single overlay.
█ Related Scripts
Dynamic Price Oscillator (Zeiierman)
█ Settings
Length: Controls the primary lookback period used throughout the oscillator calculations and Bollinger Band framework.
Smoothing Factor: Controls the responsiveness of the oscillator. Higher values produce smoother movement while lower values increase sensitivity.
Price Anchor Length: Determines the EMA length used to anchor the overlay structure to price.
-----------------
Disclaimer
The content provided in my scripts, indicators, ideas, algorithms, and systems is for educational and informational purposes only. It does not constitute financial advice, investment recommendations, or a solicitation to buy or sell any financial instruments. I will not accept liability for any loss or damage, including without limitation any loss of profit, which may arise directly or indirectly from the use of or reliance on such information.
All investments involve risk, and the past performance of a security, industry, sector, market, financial product, trading strategy, backtest, or individual's trading does not guarantee future results or returns. Investors are fully responsible for any investment decisions they make. Such decisions should be based solely on an evaluation of their financial circumstances, investment objectives, risk tolerance, and liquidity needs.
Penunjuk
Penunjuk

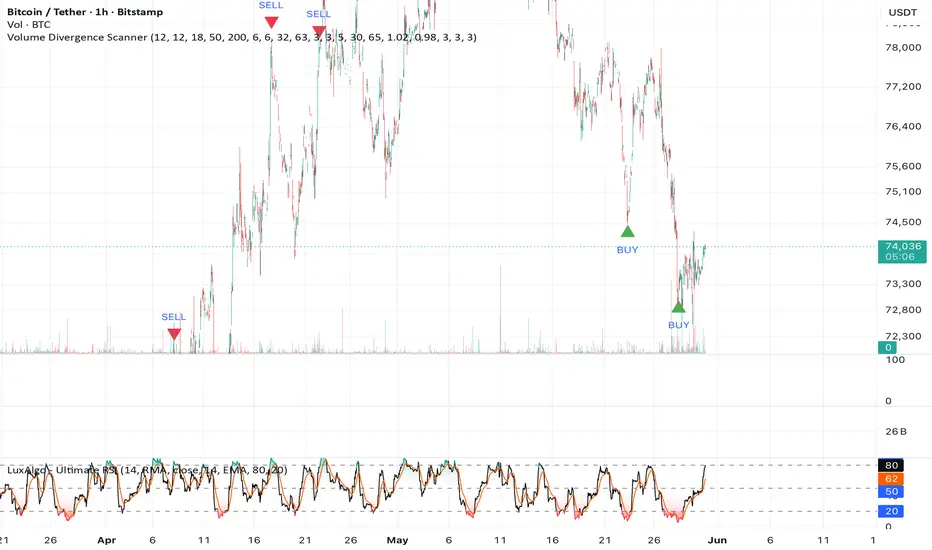
RSI Sequential Exhaustion & Divergence**RSI Sequential Exhaustion & Divergence — Multi-Factor Oscillator**
**What it is**
A single RSI-based reversal oscillator for spotting momentum exhaustion, then filtering and grading those signals so only the better-supported ones stand out. It is one integrated tool, not a pile of separate indicators sharing a pane.
**What it plots**
- The RSI line with a glow/gradient style coloured by momentum side, plus overbought/oversold/midline levels and an optional zone fill.
- Sequential Exhaustion signal arrows (▲/▼) at qualifying turns.
- Regular and hidden price–RSI divergence as lines and small labels, de-cluttered so the pane stays readable.
- A compact 5-row dashboard: Signal (direction · conviction % · age), RSI state, Confluence score, Context (trend/range + volatility state), and a Data-health read.
- An optional calibration panel and a set of hidden data-window outputs (EXP_*) for chaining into other scripts.
**Why these components are combined (and how they work together)**
Each part is here to fix a specific weakness of the part before it, so the result is one filtered, graded signal:
1. A bare RSI overbought/oversold reading whipsaws, and naive divergence over-fires. So the script uses two *structured* exhaustion cues instead: **Sequential Exhaustion** (the RSI makes three consecutive deeper pushes into an extreme zone and the fourth bar turns back out — a defined trigger, not just "RSI is low"), and a **divergence engine** that adds an independent reversal cue and is de-cluttered with a cooldown plus a minimum-gap filter.
2. Both cues are counter-trend by nature, and counter-trend entries fail in two situations: strong directional trends, and volatility cascades. To handle the first, an **HTF trend-bias filter** and an **ADX regime filter** suppress signals when a higher timeframe or strong ADX says the trend is intact. To handle the second, a **volatility-cluster filter** (a self-exciting intensity built from returns) proportionally raises the bar for new signals exactly when clustering makes mean-reversion most dangerous — and because it is price-only, it also works on volume-less symbols.
3. To tell which surviving signals are worth more, a **Confluence grade (0–5)** fuses five reasonably-independent reads of the same bar (HTF bias, ranging regime, a recent divergence, volume, and the RSI momentum turn). **Multi-timeframe agreement (3×/5×/15×)** is deliberately kept *separate* and applied as a conviction *multiplier* rather than blended into the score, because it is the one genuinely independent check — full agreement boosts conviction, contradiction damps it.
4. To stay honest about whether any of this is working on your symbol, a **calibration tracker** logs every signal and, after a fixed horizon, records whether price actually followed through (a move of at least X·ATR in the signal's direction), reporting a measured *past* hit-rate by grade tier with a Wilson 95% confidence interval. A **data-integrity read** (bar range, HTF-feed freshness, volume reliability) surfaces an OK / DEGRADED / CRITICAL status so the tool never silently scores on bad data.
**What is original here**
The individual techniques — RSI, divergence, ADX, ATR, volume reads, self-exciting intensity, Wilson intervals — are publicly documented. The original work is the integration: a structured RSI-exhaustion trigger gated by a proportional volatility-cluster filter, graded by a confluence score that is scaled by independent higher-timeframe agreement, and continuously audited by a built-in self-calibration tracker that reports honest past follow-through by tier. Components were chosen so each covers a distinct weakness; redundant filters were left out to keep one clear signal.
**How to use**
1. Add it to a chart. Defaults suit intraday index/futures; direction works on any symbol, while the volume confluence factor needs real traded volume.
2. Take signals in the direction the context filters allow. Prefer a higher conviction % and stronger higher-timeframe agreement; treat low-grade cues as noise (raise "Min confluence to allow signal" to suppress them).
3. Respect the volatility-cluster warning — it marks regimes where mean-reversion is most likely to fail.
4. Use the optional calibration panel as a sanity check on the tool's own past signals, never as a forward prediction.
5. Spot vs futures: a cash/spot index has no real volume. "Volume Mode" auto-detects this, and you can borrow a traded-volume series from a related futures contract; the "Data" row shows the active mode.
**Notes**
All signals and divergence confirm on closed pivots and do not repaint. Divergence labels appear "Pivot Right" bars after the turn, which is inherent to honest pivot detection.
**Disclaimer**
For education and information only. This is not financial, investment, or trading advice and guarantees no outcome. Signals describe current and past conditions; they do not predict the future. The calibration figures describe past behaviour only — they are not a backtest or a probability of future results. Volume-based readings depend on the data feed and are unreliable on instruments without real volume. Trading carries substantial risk of loss; you are solely responsible for your own decisions and risk management. Consider consulting a licensed professional.
Penunjuk

Lumina Adaptive Momentum Oscillator [Pineify]Lumina Adaptive Momentum Oscillator
This oscillator measures price momentum through a double-smoothed triangular moving average, then overlays a Kaufman-style Adaptive Moving Average as a signal line that accelerates in trending conditions and slows in ranging ones. The result is a histogram that stays cleaner than a simple ROC or MACD while still catching real directional shifts — buy and sell signals fire only when momentum crosses the adaptive signal while on the "wrong" side of zero, filtering out crosses that occur mid-trend.
Key Features
Triangular MA momentum — double SMA smoothing cuts through noise that a single-period momentum calculation amplifies
Kaufman Adaptive Moving Average signal line — efficiency-ratio scaling means the signal line tracks fast when price has clear direction and lags conservatively during chop
Polarity-colored histogram — bars flip between bull and bear colors on the zero line, making directional bias readable at a glance
Counter-trend signal filter — buy signals require momentum to be below zero; sell signals require it above, so the oscillator only flags reversals, not trend continuation pulses
Configurable alerts for buy and sell conditions (uncomment the alertcondition lines to enable)
How It Works
Triangular momentum : A triangular moving average is the SMA of an SMA — ta.sma(ta.sma(close, length), length) . This double pass heavily weights the middle of the lookback window, producing a line that barely reacts to individual candle spikes. Momentum is then the change in this average over length bars, equivalent to asking: "how much has the ultra-smooth baseline shifted over the period?"
Adaptive signal line (AMA) : The signal applies a Kaufman Adaptive Moving Average to the momentum values. Each bar, an Efficiency Ratio is computed as the absolute cumulative price change divided by the sum of bar-by-bar absolute changes over the window. A high ER (price moving steadily in one direction) produces a fast smoothing constant; a low ER (lots of back-and-forth) produces a slow one. The smoothing constant is squared before application — squaring compresses near-zero values toward zero and pushes higher values closer to one, amplifying the contrast between ranging and trending states.
Signals : A buy condition fires when the momentum histogram crosses above the signal line from below zero. A sell condition fires when momentum crosses below the signal line from above zero. Both plotshape and alertcondition calls are included but commented out by default, so the chart stays clean unless signals are explicitly enabled.
How the Components Work Together
The triangular MA reduces the raw momentum noise that trips up standard crossover strategies. A plain ta.change(close, length) signal line would fire constantly in sideways markets because individual candle closes swing around. By first anchoring momentum to a doubly-smoothed baseline, the histogram only moves when an actual directional shift is underway in price.
The AMA signal line then adapts to how directional that momentum itself is. When momentum is trending (e.g., steadily falling through a corrective move), the AMA tracks it closely, keeping the histogram-to-signal gap narrow and the crossover conditions quiet. When momentum flips abruptly — the scenario a reversal trader wants — the ER spikes, the smoothing constant rises, and the signal line catches up quickly enough to generate a timely cross.
The zero-side filter adds the final constraint: only counter-trend crosses matter. A bullish cross above zero would typically mean momentum is already positive and the trend is continuing, not reversing — those are excluded. This makes the signals less frequent but more aligned with actual turning points.
Trading Ideas and Insights
Use on the daily or 4H chart during confirmed trending markets. Wait for pullbacks that drive momentum negative, then watch for a histogram-crosses-signal event below zero as an early re-entry cue. Confirmation from price action (e.g., a higher low or a break of the short-term descending channel) reduces false positives.
On intraday charts, the double smoothing introduces noticeable lag — roughly 2× the period in bars. For a 14-bar setting this means signals may appear 3-5 candles after the actual reversal candle. Consider reducing length to 7-9 on lower timeframes to recover responsiveness.
The signal line (currently commented out) can be uncommented as an additional visual layer. When the histogram bars are shrinking toward zero while the signal line is still diverging, it often indicates momentum exhaustion before the actual cross occurs, giving a heads-up for limit orders.
Unique Aspects
Most MACD-style oscillators apply EMA smoothing to raw price; this one applies double-SMA smoothing before differencing, which produces a different noise profile — more immune to single-bar wicks but slower to react to sharp moves
Applying the Kaufman AMA to momentum values (rather than price) is less common. The efficiency ratio reflects momentum's own trendiness, not price's, so the adaptive behavior is tuned to the oscillator's dynamic rather than borrowed from a price-following MA
The zero-side signal filter is built in rather than left to the trader to configure — the indicator makes an explicit methodological choice that these signals represent reversals only
How to Use
Add the indicator to any chart. The default length of 14 suits daily and 4H charts; adjust lower for faster timeframes.
Watch the histogram color: sustained green bars above zero indicate positive momentum; sustained red bars below zero indicate negative momentum.
For signals: uncomment the two plotshape lines in the source to display BUY/SELL labels, or uncomment the alertcondition lines and create alerts via TradingView's alert panel.
A BUY label appears when the histogram crosses above the signal line while below zero — a potential momentum reversal from bearish territory.
A SELL label appears when the histogram crosses below the signal line while above zero — a potential momentum reversal from bullish territory.
Combine with a higher-timeframe trend filter (e.g., price above/below a 200 EMA) to take only signals aligned with the prevailing trend.
Customization
Data Length (default: 14) — Controls the period for both the triangular MA and the adaptive signal line. Higher values produce smoother output with more lag; lower values react faster but generate more noise. Typical range: 7–21.
Bullish Color (default: green) — Color of histogram bars when momentum is positive.
Bearish Color (default: red) — Color of histogram bars when momentum is negative.
Conclusion
The Lumina Adaptive Momentum Oscillator combines triangular-MA momentum with a Kaufman-adaptive signal line to surface genuine reversal pressure rather than routine oscillations. The built-in zero-side signal filter keeps the indicator focused on counter-trend setups, making it most useful as a timing tool within a larger trend-following framework. Past patterns do not guarantee future results — use alongside price structure and volume confirmation.
Penunjuk

CVD X-Ray
CVD X-Ray
See the Participation Behind the Move
Most indicators tell you what price is doing.
CVD X-Ray is designed to reveal who is participating behind the move.
Price can rally on weak participation.
Price can decline despite aggressive buying.
Price can appear strong while participation quietly deteriorates beneath the surface.
CVD X-Ray was built to expose these hidden shifts in market participation by combining cumulative volume delta pressure, momentum acceleration, participation normalization, and multi-timeframe alignment into a single visual framework.
Rather than focusing solely on market structure, CVD X-Ray focuses on participation pressure—the intensity and direction of buying and selling activity driving the current move.
What Makes CVD X-Ray Different?
Traditional volume indicators often struggle with context.
A large reading may appear important on one chart while being completely normal on another.
CVD X-Ray solves this by normalizing participation pressure and classifying it into intuitive strength categories:
Weak
Building
Moderate
Strong
Extreme
This allows traders to quickly distinguish between routine activity and meaningful participation events.
Pressure vs Trend
One of the most common mistakes traders make is confusing participation with trend.
A market can be trending lower while buyers suddenly begin participating aggressively.
Likewise, a market can be trending higher while participation quietly weakens beneath the surface.
CVD X-Ray intentionally measures participation pressure rather than market structure trend.
This distinction can help identify potential continuation opportunities, weakening moves, failed breakouts, and early signs of accumulation or distribution.
Strength and Rarity
Each reading is evaluated based on both participation strength and historical context.
The optional percentile ranking (PCT) provides additional insight into how unusual the current participation reading is relative to recent market behavior.
For example:
P80 = Stronger than 80% of recent readings
P95 = Stronger than 95% of recent readings
This helps traders quickly recognize when participation is becoming statistically significant.
Designed for Clarity
CVD X-Ray was built around a simple goal:
Reduce information overload while increasing informational value.
The interface uses a consistent strength scale, visual participation hierarchy, and clean multi-timeframe dashboard to deliver actionable context without cluttering the chart.
Whether you're analyzing breakouts, pullbacks, reversals, or trend continuation setups, CVD X-Ray provides a structured view of the participation driving price.
Because understanding what price is doing is useful.
Understanding who is participating behind the move is often more valuable.
Disclaimer
CVD X-Ray is an analytical tool designed to assist in evaluating market participation and participation pressure. It does not predict future price movements and should not be used as a standalone basis for trading decisions.
All trading involves risk, including the potential loss of capital. Past performance, historical participation readings, and indicator signals are not guarantees of future results.
This script is provided for educational and informational purposes only and does not constitute financial, investment, or trading advice. Users are solely responsible for their own risk management and trading decisions. Penunjuk

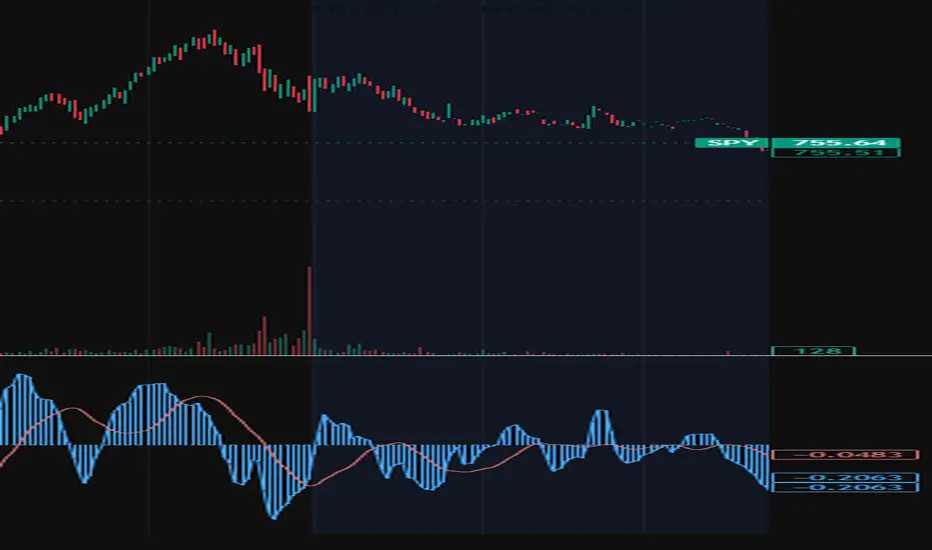
MACD Pressure Zones | Alpha S+MACD Pressure Zones
MACD Pressure Zones is a normalized MACD histogram oscillator designed to show momentum pressure on a 0 to 100 scale.
Instead of displaying the raw MACD histogram around a zero line, this script normalizes the histogram over a selected lookback period and maps it into a bounded oscillator range. This allows users to compare MACD histogram pressure across different market conditions with fixed reference zones such as 90, 85, 50, 15, and 10.
The script does not provide entry or exit recommendations. Its purpose is to help users study momentum pressure, extended momentum areas, neutral pressure, and cooling or heating behavior inside a simplified MACD-based zone structure.
────────────────────
Core Concept
────────────────────
The standard MACD histogram shows the distance between the MACD line and the signal line.
When the histogram expands, momentum pressure is increasing.
When the histogram contracts, momentum pressure is weakening.
This script takes that MACD histogram value and normalizes it into a 0 to 100 range.
The normalized structure uses five main reference levels:
• 90: Extreme upper momentum pressure
• 85: Upper pressure zone
• 50: Neutral pressure level
• 15: Lower pressure zone
• 10: Extreme lower momentum pressure
The red line is a smoothed version of the normalized MACD histogram. It helps users read the broader momentum pressure curve rather than reacting to every individual histogram bar.
────────────────────
What This Script Shows
────────────────────
The script can display:
• normalized MACD histogram columns
• smoothed MACD pressure line
• 90 and 85 upper pressure levels
• 50 neutral pressure level
• 15 and 10 lower pressure levels
• upper and lower zone background highlights
• histogram expansion or contraction state
• current pressure zone
• momentum heating or cooling state
• positive or negative pressure bias
• number of bars spent inside upper or lower pressure zones
• optional status panel
These elements are designed to help users identify whether MACD histogram pressure is extended, recovering, cooling, expanding, or returning toward neutral.
────────────────────
How It Works
────────────────────
1. The script calculates the MACD line using the selected fast and slow EMA lengths.
2. The signal line is calculated from the MACD line.
3. The MACD histogram is calculated as MACD minus signal.
4. The histogram is normalized over the selected lookback period.
5. The normalized value is mapped into a 0 to 100 oscillator range.
6. A smoothed red pressure line is calculated from the normalized oscillator.
7. The script compares the pressure line with the 90, 85, 50, 15, and 10 reference levels.
8. Zone background highlights appear when the pressure line enters upper or lower pressure areas.
9. Histogram columns become visually stronger or weaker depending on expansion or contraction.
10. The status panel summarizes current pressure, zone, momentum state, bias, zone duration, and histogram condition.
This structure converts MACD histogram behavior into a cleaner zone-based momentum pressure map.
────────────────────
Inputs And Customization
────────────────────
Users can adjust:
• MACD fast length
• MACD slow length
• MACD signal length
• source price
• normalization lookback
• red line smoothing length
• 0 to 100 clamping
• extreme upper pressure level
• upper pressure level
• neutral pressure level
• lower pressure level
• extreme lower pressure level
• zone background visibility
• histogram visibility
• red line visibility
• status panel visibility
• panel position
• panel text size
• histogram colors
• red line color
• reference level color
• panel background color
The default levels are designed around a 90 / 85 / 50 / 15 / 10 pressure-zone framework.
────────────────────
Visual Elements
────────────────────
The script includes:
• normalized histogram columns
• smoothed red pressure line
• horizontal reference levels
• upper pressure background
• lower pressure background
• status panel
The histogram columns show the normalized MACD histogram value.
The red line smooths the normalized histogram and makes the pressure cycle easier to read.
The 50 level acts as the neutral pressure reference.
The 85 and 90 levels mark upper momentum pressure zones.
The 15 and 10 levels mark lower momentum pressure zones.
The panel summarizes the current state without adding directional trade labels to the chart.
────────────────────
Reference States
────────────────────
Extreme Upper Pressure:
The smoothed pressure line is at or above the upper extreme level.
Upper Pressure:
The smoothed pressure line is inside the upper pressure zone.
Positive Pressure:
The pressure line is above the neutral level but below the upper pressure zone.
Neutral Pressure:
The pressure line is near the neutral reference level.
Negative Pressure:
The pressure line is below the neutral level but above the lower pressure zone.
Lower Pressure:
The smoothed pressure line is inside the lower pressure zone.
Extreme Lower Pressure:
The smoothed pressure line is at or below the lower extreme level.
Heating:
The smoothed pressure line is rising.
Cooling:
The smoothed pressure line is falling.
Expanding:
The normalized histogram is increasing compared with the prior bar.
Contracting:
The normalized histogram is decreasing compared with the prior bar.
These states are informational and should not be interpreted as trading instructions.
────────────────────
How To Use
────────────────────
Use this script as a MACD histogram pressure and momentum-zone viewer.
General interpretation examples:
• When the red line is above 85, MACD histogram pressure is in an upper extended area.
• When the red line is above 90, the upper pressure condition is more extreme.
• When the red line moves down from the upper pressure zone, momentum pressure may be cooling.
• When the red line is near 50, MACD histogram pressure is closer to neutral.
• When the red line is below 15, MACD histogram pressure is in a lower extended area.
• When the red line is below 10, the lower pressure condition is more extreme.
• When the red line rises from the lower pressure zone, momentum pressure may be heating.
• Zone Bars can help users see how long the pressure line has remained in an upper or lower pressure zone.
• Histogram expansion can show strengthening pressure, while contraction can show fading pressure.
This script is best reviewed together with price action, trend structure, volatility, support and resistance, and higher-timeframe context.
────────────────────
Confirmation And Repainting Notes
────────────────────
The script calculates MACD, the histogram, normalization range, and the smoothed pressure line from available chart data.
On realtime candles, values can change before the candle closes because the MACD histogram and normalization values can update intrabar.
For more conservative analysis, users should review the oscillator after candle confirmation.
The script does not use future price data to predict market direction.
────────────────────
Limitations
────────────────────
This script does not predict future price movement.
It does not provide entry or exit recommendations.
A high pressure reading does not guarantee a reversal.
A low pressure reading does not guarantee a rebound.
MACD histogram behavior can remain extended during strong trends.
Normalization depends on the selected lookback period, so readings may change when the lookback setting changes.
Different symbols and timeframes may require different settings.
This script should not be used as a standalone trading system.
────────────────────
Disclaimer
────────────────────
This publication is for educational and informational chart analysis only.
It does not constitute financial advice, investment advice, or a recommendation to trade any financial instrument.
All trading and investment decisions are the responsibility of the user.
━━━━━━━━━━━━━━━━━━━━
MACD Pressure Zones
MACD Pressure Zones는 MACD 히스토그램을 0~100 범위로 정규화하여 모멘텀 압력 구간을 보여주는 오실레이터형 지표입니다.
일반 MACD 히스토그램을 0선 중심으로 표시하는 대신, 이 스크립트는 선택한 lookback 구간 안에서 히스토그램 값을 정규화하고 이를 고정된 오실레이터 범위로 변환합니다. 이를 통해 90, 85, 50, 15, 10과 같은 기준 구간을 사용해 다양한 시장 상황의 MACD 히스토그램 압력을 비교할 수 있습니다.
이 지표는 진입 또는 청산 추천을 제공하지 않습니다. 목적은 모멘텀 압력, 확장된 모멘텀 구간, 중립 압력, cooling 또는 heating 상태를 단순한 MACD 기반 구간 구조 안에서 분석하는 것입니다.
────────────────────
핵심 개념
────────────────────
일반 MACD 히스토그램은 MACD 라인과 시그널 라인 사이의 거리를 보여줍니다.
히스토그램이 확장되면 모멘텀 압력이 증가하는 상태로 볼 수 있습니다.
히스토그램이 수축되면 모멘텀 압력이 약해지는 상태로 볼 수 있습니다.
이 스크립트는 MACD 히스토그램 값을 0~100 범위로 정규화합니다.
정규화된 구조는 다섯 개의 주요 기준선을 사용합니다.
• 90: 극단적 상단 모멘텀 압력
• 85: 상단 압력 구간
• 50: 중립 압력 기준선
• 15: 하단 압력 구간
• 10: 극단적 하단 모멘텀 압력
빨간선은 정규화된 MACD 히스토그램을 평활화한 값입니다. 개별 히스토그램 막대보다 넓은 모멘텀 압력 곡선을 읽는 데 도움을 줍니다.
────────────────────
이 스크립트가 보여주는 것
────────────────────
이 스크립트는 다음 요소를 표시할 수 있습니다.
• 정규화된 MACD 히스토그램 막대
• 평활화된 MACD 압력선
• 90 및 85 상단 압력 기준선
• 50 중립 압력 기준선
• 15 및 10 하단 압력 기준선
• 상단 및 하단 구간 배경 강조
• 히스토그램 확장 또는 수축 상태
• 현재 압력 구간
• 모멘텀 heating 또는 cooling 상태
• positive 또는 negative 압력 방향
• 상단 또는 하단 압력 구간 체류 봉 수
• 선택 가능한 상태 패널
이 요소들은 MACD 히스토그램 압력이 확장, 회복, 둔화, 확장 지속, 또는 중립 회귀 중 어디에 가까운지 확인하는 데 도움을 줍니다.
────────────────────
작동 방식
────────────────────
1. 선택한 fast EMA와 slow EMA 길이를 사용해 MACD 라인을 계산합니다.
2. MACD 라인에서 시그널 라인을 계산합니다.
3. MACD에서 시그널을 뺀 값으로 MACD 히스토그램을 계산합니다.
4. 선택한 lookback 구간에서 히스토그램을 정규화합니다.
5. 정규화된 값을 0~100 오실레이터 범위로 변환합니다.
6. 정규화 오실레이터에서 평활화된 빨간 압력선을 계산합니다.
7. 압력선을 90, 85, 50, 15, 10 기준선과 비교합니다.
8. 압력선이 상단 또는 하단 압력 구간에 진입하면 배경이 강조됩니다.
9. 히스토그램 막대는 확장 또는 수축 여부에 따라 다르게 표시됩니다.
10. 상태 패널은 현재 압력, 구간, 모멘텀 상태, 방향성, 구간 체류 시간, 히스토그램 상태를 요약합니다.
이 구조는 MACD 히스토그램 행동을 더 깔끔한 구간 기반 모멘텀 압력 맵으로 변환합니다.
────────────────────
입력값 및 설정
────────────────────
사용자는 다음 항목을 조정할 수 있습니다.
• MACD fast length
• MACD slow length
• MACD signal length
• source price
• normalization lookback
• red line smoothing length
• 0 to 100 clamping
• extreme upper pressure level
• upper pressure level
• neutral pressure level
• lower pressure level
• extreme lower pressure level
• zone background visibility
• histogram visibility
• red line visibility
• status panel visibility
• panel position
• panel text size
• histogram colors
• red line color
• reference level color
• panel background color
기본 기준선은 90 / 85 / 50 / 15 / 10 압력 구간 구조를 중심으로 설계되어 있습니다.
────────────────────
시각 요소
────────────────────
이 스크립트는 다음 시각 요소를 포함합니다.
• 정규화 히스토그램 막대
• 평활화된 빨간 압력선
• 수평 기준선
• 상단 압력 배경
• 하단 압력 배경
• 상태 패널
히스토그램 막대는 정규화된 MACD 히스토그램 값을 보여줍니다.
빨간선은 정규화된 히스토그램을 평활화하여 압력 사이클을 더 쉽게 읽게 해줍니다.
50선은 중립 압력 기준선 역할을 합니다.
85와 90은 상단 모멘텀 압력 구간을 표시합니다.
15와 10은 하단 모멘텀 압력 구간을 표시합니다.
패널은 차트에 방향성 매매 라벨을 추가하지 않고도 현재 상태를 요약합니다.
────────────────────
참고 상태
────────────────────
Extreme Upper Pressure:
평활화된 압력선이 상단 극단 기준선 이상에 있는 상태입니다.
Upper Pressure:
평활화된 압력선이 상단 압력 구간에 있는 상태입니다.
Positive Pressure:
압력선이 중립 기준선 위에 있지만 상단 압력 구간 아래에 있는 상태입니다.
Neutral Pressure:
압력선이 중립 기준선 부근에 있는 상태입니다.
Negative Pressure:
압력선이 중립 기준선 아래에 있지만 하단 압력 구간 위에 있는 상태입니다.
Lower Pressure:
평활화된 압력선이 하단 압력 구간에 있는 상태입니다.
Extreme Lower Pressure:
평활화된 압력선이 하단 극단 기준선 이하에 있는 상태입니다.
Heating:
평활화된 압력선이 상승 중인 상태입니다.
Cooling:
평활화된 압력선이 하락 중인 상태입니다.
Expanding:
정규화된 히스토그램이 직전 봉보다 증가하는 상태입니다.
Contracting:
정규화된 히스토그램이 직전 봉보다 감소하는 상태입니다.
이 상태들은 정보 제공용이며, 매매 지시로 해석해서는 안 됩니다.
────────────────────
사용 방법
────────────────────
이 스크립트는 MACD 히스토그램 압력 및 모멘텀 구간 확인 도구로 사용하는 것이 적절합니다.
일반적인 해석 예시는 다음과 같습니다.
• 빨간선이 85 위에 있으면 MACD 히스토그램 압력이 상단 확장 구간에 있는 상태로 볼 수 있습니다.
• 빨간선이 90 위에 있으면 더 극단적인 상단 압력 상태로 볼 수 있습니다.
• 빨간선이 상단 압력 구간에서 하락하면 모멘텀 압력이 cooling 되는 과정일 수 있습니다.
• 빨간선이 50 부근에 있으면 MACD 히스토그램 압력이 중립에 가까운 상태입니다.
• 빨간선이 15 아래에 있으면 MACD 히스토그램 압력이 하단 확장 구간에 있는 상태로 볼 수 있습니다.
• 빨간선이 10 아래에 있으면 더 극단적인 하단 압력 상태로 볼 수 있습니다.
• 빨간선이 하단 압력 구간에서 상승하면 모멘텀 압력이 heating 되는 과정일 수 있습니다.
• Zone Bars는 압력선이 상단 또는 하단 압력 구간에 얼마나 오래 머물렀는지 확인하는 데 사용할 수 있습니다.
• Histogram expansion은 압력 강화, contraction은 압력 둔화를 보여줄 수 있습니다.
이 스크립트는 가격 행동, 추세 구조, 변동성, 지지와 저항, 상위 시간대 컨텍스트와 함께 검토하는 것이 좋습니다.
────────────────────
확인봉 및 리페인트 안내
────────────────────
이 스크립트는 사용 가능한 차트 데이터를 기준으로 MACD, 히스토그램, 정규화 범위, 평활화된 압력선을 계산합니다.
실시간 캔들에서는 MACD 히스토그램과 정규화 값이 봉 마감 전까지 변경될 수 있으므로 값이 변할 수 있습니다.
보다 보수적인 분석을 원한다면 봉 마감 이후 오실레이터를 검토하는 것이 적절합니다.
이 스크립트는 미래 가격 데이터를 사용해 시장 방향을 예측하지 않습니다.
────────────────────
한계
────────────────────
이 스크립트는 미래 가격 움직임을 예측하지 않습니다.
진입 또는 청산 추천을 제공하지 않습니다.
높은 압력 수치가 반전을 보장하지 않습니다.
낮은 압력 수치가 반등을 보장하지 않습니다.
강한 추세에서는 MACD 히스토그램 압력이 오랜 시간 확장 구간에 머무를 수 있습니다.
정규화 값은 선택한 lookback period에 따라 달라질 수 있습니다.
종목과 시간대에 따라 적절한 설정값이 달라질 수 있습니다.
이 스크립트를 단독 매매 시스템으로 사용해서는 안 됩니다.
────────────────────
중요 고지
────────────────────
본 게시물은 교육 및 정보 제공 목적의 차트 분석 자료입니다.
투자 자문, 특정 금융상품 거래 권유, 또는 수익 보장을 의미하지 않습니다.
모든 투자 판단과 그 결과에 대한 책임은 이용자 본인에게 있습니다.
Penunjuk

Explainable Quant Scorecard [TradeDots]Explainable Quant Scorecard
Summary
This indicator computes a composite 0 to 100 evidence score by combining seven independent normalized sub-scores: Trend, Momentum, Volatility Regime, Participation, Relative Strength, Exhaustion Risk, and Multi-Timeframe Alignment. The composite is regime-dependent: when ADX indicates a trending regime, the trend and momentum weights are boosted; when ADX indicates a range regime, the exhaustion-risk weight is boosted instead. All factor weights are exposed as inputs so the model is fully auditable and tunable. A flagship dashboard panel displays every sub-score, the composite, the active regime, and a one-line interpretation.
The intent is to give traders a transparent multi-factor reading on every bar rather than another single-indicator signal. The composite is an evidence score, not a probability or prediction.
What is original here
Composite indicators that mash several oscillators together exist in the public library. This script's contributions are:
Honest factor separation. Each sub-score measures a different dimension (trend, momentum, volatility, participation, relative strength, exhaustion, multi-timeframe). Many composites silently combine correlated readings (such as two momentum oscillators) and present the result as if it were multi-factor confirmation. This script's seven factors are deliberately chosen to be diverse.
Regime-dependent weighting. The composite is not a fixed weighted average. When the market is trending, trend and momentum factors carry more weight; when ranging, exhaustion-risk carries more. This addresses the well-known problem that trend-following inputs and mean-reversion inputs should not be weighted equally in all conditions.
Sub-score divergence detection. The script tracks the maximum deviation of any sub-score from the composite. A large deviation triggers a "sub-score divergence" alert, warning the trader that the factors disagree even when the composite looks clean.
Full transparency. All weights, all thresholds, and the regime trigger levels are user inputs. No black-box.
How it works
Each bar, seven sub-scores are computed.
1. Trend score. EMA slope over a configurable lookback, normalized to 0 to 100 via min-max over a percentile window.
2. Momentum score. Rate-of-change of close over a configurable length, min-max normalized.
3. Volatility regime score. Bollinger Bandwidth percentile mapped to a discrete numeric: compressed BBW (below the lower threshold) maps to 30, expanding BBW (above the upper threshold) maps to 70, normal BBW maps to 50. A label ("Compressed", "Normal", "Expanding") is generated alongside the numeric.
4. Participation score. Volume percentile multiplied by a close-location alignment factor. For a bullish-direction reading, a close near the bar's high earns full alignment; for a bearish-direction reading, a close near the bar's low. The result is a 0 to 100 score that rewards volume and direction-consistent closes.
5. Relative strength score. The asset's return over a configurable horizon, minus the benchmark's return over the same horizon, divided by the asset's own volatility. The result is percentile-ranked over a longer lookback (default 252 bars) to produce a 0 to 100 reading. The benchmark symbol is a user input.
6. Exhaustion risk score. Distance from the trend EMA in ATR units, mapped inversely to 0 to 100 (high exhaustion gives a low exhaustion-score, which is consistent with the convention that high scores are "good" for the composite). The dashboard inverts the label so users see "Exhaustion: High" rather than "Exhaustion: 20".
7. Multi-timeframe alignment score. The trend direction (EMA-fast vs EMA-slow) is fetched at three user-configurable higher timeframes. Each HTF's agreement with the chart-timeframe direction contributes 100, 50, or 0 to the alignment score. The final factor is the average across three timeframes.
The composite is the weighted average. When regime_weighting is enabled and ADX indicates a trending regime (above the user threshold), the trend and momentum weights are multiplied by 1.5 and the exhaustion-risk weight by 0.5. When ADX indicates a range regime (below the lower threshold), the trend and momentum weights are multiplied by 0.5 and the exhaustion-risk weight by 1.5. In a "Mixed" regime, weights are unchanged.
A four-line interpretation is assigned by composite range:
75 or higher : "Constructive, multi-factor agreement"
60 to 74 : "Mixed but constructive"
40 to 59 : "Mixed — wait for alignment"
below 40 : "Bearish or unclear"
Repainting and data integrity
All sub-scores are computed on confirmed bar values. Alerts are gated by barstate.isconfirmed. The benchmark and the three multi-timeframe trend references are fetched with request.security() using prior-bar sources together with barmerge.lookahead_on — the standard non-repainting idiom that returns the last confirmed value from the requested context. These calls do not access future data.
How to read the chart
The composite is plotted as a line in the indicator pane, color-shifted on a red-to-green gradient based on the score.
Horizontal reference lines at 25, 50, and 75 demarcate bearish, midpoint, and bullish zones.
Sub-score plots are available but off by default to keep the pane clean. They can be enabled via input toggle.
The dashboard panel shows the direction in the header, then a row for each of the seven sub-scores (numeric or labelled), then a divider, then the composite score, then the interpretation line and the active regime.
Inputs
Inputs are grouped into seven sections.
Core Settings : trend EMA lengths and norm lookback, momentum ROC length, generic norm lookback, BB length and multiplier, ATR length, ADX length.
Relative Strength : benchmark symbol, RS return horizon, RS volatility length, RS percentile lookback.
Multi-Timeframe : three HTF inputs (default 60-minute, 240-minute, daily).
Factor Weights : a 0 to N weight for each of the seven sub-scores.
Regime Modulation : regime-weighting enable toggle, trend ADX threshold, range ADX threshold.
Visual Settings : dashboard toggle, panel position, panel size, panel background color, composite-plot toggle, sub-score-plot toggle.
Any Alert() function call conditions : per-alert toggles.
Alerts
Four alert conditions are provided:
Score ≥ 75 Bullish (composite at or above 75 with trend direction up)
Score ≥ 75 Bearish (composite at or above 75 with trend direction down)
Score Regime Flipped (composite crossed the 50 midpoint in either direction)
Sub-Score Divergence (any sub-score moves more than 30 points from the composite — a warning that factors disagree)
Each is declared via alertcondition() and fired programmatically through alert() when the corresponding input toggle is enabled, with alert.freq_once_per_bar_close. Alert messages include {{ticker}}, {{interval}}, and {{close}} placeholders.
How to use this script
Read this indicator as your master "is the evidence stack constructive" check, not as an entry trigger.
A composite of 75 or higher with trend direction up is the suite's highest-conviction long setup; the inverse for shorts.
Read the regime cell. In a trending regime, weight your decision toward the trend and momentum sub-scores. In a range regime, weight toward exhaustion risk and relative strength.
If the dashboard shows a high composite but the "Sub-Score Divergence" alert is firing, the agreement is shallow — investigate which factor disagrees before sizing up.
Pair with a setup-specific indicator (sweep, breakout, zone) for entry timing. This script does not give entries.
Limitations and honest caveats
The composite is a weighted heuristic combination of normalized factors, not a calibrated probability. A composite of 80 does not imply an 80% probability of any outcome.
Regime detection uses ADX, which is lagging. The regime label will not reflect a fresh regime change on the first bar.
The Relative Strength benchmark is a single symbol chosen by the user. Choosing an inappropriate benchmark (for example, comparing a small-cap stock to a crypto-currency benchmark) will produce noisy RS readings.
The three MTF references add request.security() calls. On instruments without history at those timeframes, the MTF score may be incomplete on early bars.
Composite values pin to one tail when factor weights are mis-configured. The default weights are reasonable starting values; users are expected to tune for their instrument and timeframe.
The script makes no claim about which direction price will move; it scores the evidence stack currently visible.
Disclaimer
This script is published for informational and educational purposes. It is not investment advice and is not a recommendation to buy or sell any instrument. Composite evidence scores are descriptive, not predictive. Users are solely responsible for their own trading decisions and risk management.
Penunjuk

CDC Action Zone+TrueMarket Mean (BTC Focus) By Beckte## Overview
This indicator is a macro-focused trend following and cyclical value tracking tool, specifically designed for Bitcoin (BTC) long-term investors. It combines the momentum logic of the well-known **CDC Action Zone** with a mathematical simulation of the On-Chain **Realized Price** model.
The main purpose of this script is to identify high-probability, macro-generational accumulation zones while filtering out early or false bottom signals during aggressive downtrends.
---
## Key Components
### 1. CDC Action Zone (Trend & Momentum)
Based on the classic EMA 12 and EMA 26 crossover logic, this component colors the candlesticks to reflect the market's current momentum:
- 🟢 **Bright Green:** Strong Bullish Momentum (Hold / Trend is up)
- 🔵 **Blue:** Early Bullish Sign / Potential Reversal (Watch closely or start accumulation)
- 🔴 **Bright Red:** Strong Bearish Momentum (Stay in cash / Wait)
- 🟠 **Orange:** Early Bearish Sign / Technical Rebound in Bear Market
### 2. Realized Price Proxy (The Cyclical Floor)
In on-chain analysis, the **Realized Price** represents the average cost basis of all aggregate Bitcoin supply moving on-network, without omitting lost or dormant coins.
Since native on-chain data requires external API subscriptions on TradingView, this script utilizes a specialized long-term statistical proxy (**730-day SMA with custom logarithmic offsets**) to simulate this ultimate cyclical floor. Historically, major bear market bottoms (2015, 2018, 2022) have strictly formed near or slightly below this baseline.
---
## How it Works & Entry Strategy (The Anti-Doi Mechanism)
To avoid catching falling knives during a capitulation event, this script enforces a strict double-confirmation rule:
1. **Value Zone Check:** The current market price must correct down to within **10% of the Realized Price Proxy** (the light blue line). This ensures you are buying Bitcoin at an extreme discount relative to historical network value.
2. **Momentum Trigger:** Once inside the Value Zone, the script waits for the **CDC Action Zone to flip from Red/Orange to Blue or Green**.
When both conditions are met, a **"REALIZED BUY"** label will plot beneath the candlestick, signaling a safe, low-risk entry spot with a highly compressed downside.
---
## Disclaimer & Credits
- **Credits:** The trend-following logic is inspired by the legendary "CDC Action Zone" concept popularized by Piriya Sambandaraksa. The valuation floor is based on the Realized Price on-chain metric conceptualized by the crypto-asset research community.
- **Disclaimer:** This indicator is designed for high-timeframe spot accumulation (recommended: 1D or 4H charts). It is not a financial advisory tool or a guarantee of future profits. Past performance does not indicate future results. Always practice proper risk management. Penunjuk

Penunjuk

Order Block Detector ProOrder Block Detector Pro — FVG + Volume + Breaker Blocks
━━━━━━━━━━━━━━━━━━━━
CREDIT & OPEN-SOURCE STATEMENT
━━━━━━━━━━━━━━━━━━━━
Zone detection concept inspired by "Market Structure Break & Orderblock" by EmreKb (TradingView open-source). The codebase has been fully rewritten with significant original additions: Fair Value Gap overlap detection, volume confirmation filter, Breaker Block conversion logic, anti-clustering system, unrespected zone cancellation, and FVG-tagged labels. Published open-source in compliance with TradingView reuse rules.
━━━━━━━━━━━━━━━━━━━━
WHY THESE COMPONENTS WORK TOGETHER
━━━━━━━━━━━━━━━━━━━━
Order blocks identify WHERE institutional orders were placed. Volume confirms WHETHER those orders had genuine institutional size. Fair Value Gaps identify WHETHER an imbalance exists inside the zone that price is likely to return and fill. None of these three factors alone is sufficient — an order block without volume may be retail noise; volume without structure has no location context; FVGs without a structural anchor have no directional bias. Combined, they produce a filtered, high-probability zone with multiple layers of institutional confirmation.
━━━━━━━━━━━━━━━━━━━━
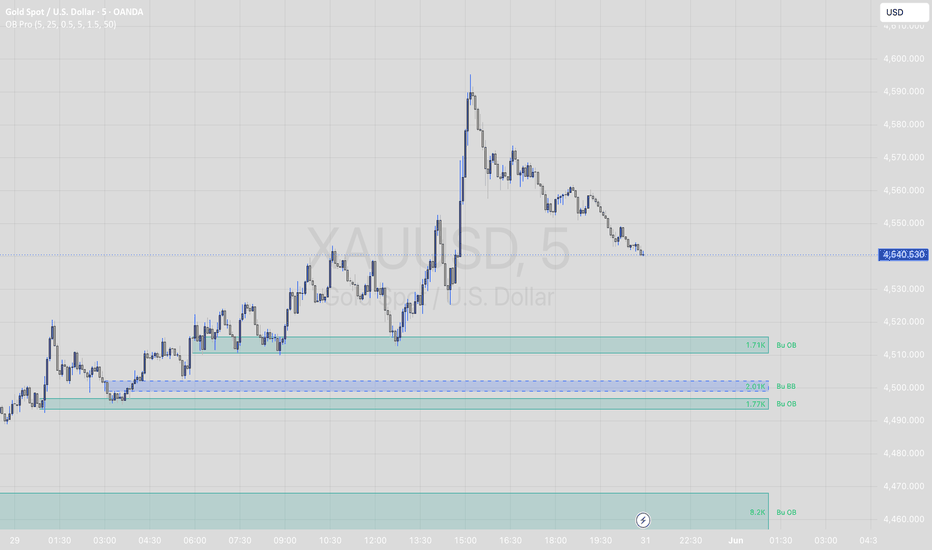
WHAT THIS INDICATOR DOES
━━━━━━━━━━━━━━━━━━━━
Detects four zone types based on market structure breaks:
- Bu OB — Bullish Order Block (demand)
- Be OB — Bearish Order Block (supply)
- Bu BB — Bullish Breaker Block (former supply flipped to demand)
- Be BB — Bearish Breaker Block (former demand flipped to supply)
Each zone is volume-confirmed, FVG-tagged when applicable, anti-clustered, and auto-mitigated when price returns.
━━━━━━━━━━━━━━━━━━━━
MARKET STRUCTURE — SWING PIVOTS + BOS
━━━━━━━━━━━━━━━━━━━━
Swing highs and lows detected using ta.pivothigh() and ta.pivotlow() with a configurable pivot length (default 5 bars each side).
Break of Structure (BOS) is confirmed when:
- BOS Up: close crosses above a previously unbroken swing high
- BOS Down: close crosses below a previously unbroken swing low
Each swing point is tracked in a typed array (Swing type: price, bar, broken flag). Once broken, the swing is marked and triggers order block search.
━━━━━━━━━━━━━━━━━━━━
ORDER BLOCK DETECTION
━━━━━━━━━━━━━━━━━━━━
On BOS Up: script searches backwards up to N bars (default 25) for the most recent bearish candle (close < open). That candle is the Bullish Order Block — the last point where sellers were active before institutional buyers took control.
On BOS Down: searches backwards for the most recent bullish candle (close > open). That candle is the Bearish Order Block.
Zone boundaries:
- Full Range mode: top = high, bottom = low of OB candle
- Body Only mode: top = max(open, close), bottom = min(open, close)
━━━━━━━━━━━━━━━━━━━━
VOLUME CONFIRMATION
━━━━━━━━━━━━━━━━━━━━
When enabled, an order block only forms if:
- volume > SMA(volume, 20) × multiplier (default 1.5×)
This filters out low-participation structural moves that are more likely to fail on retest. The volume is read at the OB candle's bar offset, not the current bar.
━━━━━━━━━━━━━━━━━━━━
FAIR VALUE GAP (FVG) DETECTION
━━━━━━━━━━━━━━━━━━━━
After an order block is identified, the script checks for a Fair Value Gap within the zone's price range.
Bullish FVG condition (within OB range):
- low > high — gap between candle m−1's low and candle m+1's high
- Both gap boundaries fall within the OB top/bottom range
Bearish FVG: inverse — high < low .
When a FVG is detected inside the zone, a ★ symbol is appended to the zone label. These zones represent compounded institutional imbalances — price is statistically more likely to react at them.
━━━━━━━━━━━━━━━━━━━━
ANTI-CLUSTERING SYSTEM
━━━━━━━━━━━━━━━━━━━━
Prevents redundant overlapping zones using two filters:
Spacing filter:
- New zone rejected if midpoint is within ATR(14) × spacing multiplier of any existing active zone of the same type
Max active cap:
- Each zone type (Bu OB, Be OB, Bu BB, Be BB) capped at N active zones (default 5)
- When exceeded, oldest zone of that type is removed first
━━━━━━━━━━━━━━━━━━━━
MITIGATION LOGIC
━━━━━━━━━━━━━━━━━━━━
Two mitigation modes:
Body Close (default):
- Bu OB mitigated when close < zone bottom
- Be OB mitigated when close > zone top
Wick Touch:
- Bu OB mitigated when low < zone bottom
- Be OB mitigated when high > zone top
━━━━━━━━━━━━━━━━━━━━
BREAKER BLOCK CONVERSION
━━━━━━━━━━━━━━━━━━━━
When a mitigated zone was previously touched (price entered the zone at least once before violation):
- Bu OB violated → converts to Be BB (Bearish Breaker Block)
- Be OB violated → converts to Bu BB (Bullish Breaker Block)
Breaker Blocks represent zones where institutional orders have been fully absorbed — price is expected to use them as opposition on return.
Unrespected zone cancellation: if a zone is violated without ever being touched (price skipped through it), it is removed entirely rather than converted. This avoids phantom breaker blocks from low-quality structural moves.
━━━━━━━━━━━━━━━━━━━━
ZONE RENDERING
━━━━━━━━━━━━━━━━━━━━
Each zone is drawn as a box extending N bars to the right (default 50, updated each bar via box.set_right). Zone type visual identifiers:
- Bu OB — teal fill, solid border
- Be OB — red fill, solid border
- Bu BB — blue fill, dashed border
- Be BB — orange fill, dashed border
Volume of the OB candle is displayed inside the box (formatted as K/M/B). Labels show zone type and FVG tag (★) when applicable.
━━━━━━━━━━━━━━━━━━━━
HOW TO USE
━━━━━━━━━━━━━━━━━━━━
1. Wait for a fresh Bu OB or Be OB to form after a BOS
2. Prioritize zones marked with ★ (FVG overlap = stronger imbalance)
3. Enter when price returns to the zone on lower timeframe confirmation
4. Bu BB and Be BB are counter-trend zones — treat as resistance/support levels after a failed OB
5. Mitigated zones auto-remove — no manual cleanup needed
Entry logic suggestion:
- Long: price enters Bu OB zone → bullish rejection candle → entry above that candle
- Short: price enters Be OB zone → bearish rejection candle → entry below that candle
Stop loss: opposite side of the zone box
Target: next opposing zone or structural high/low
━━━━━━━━━━━━━━━━━━━━
RECOMMENDED SETTINGS
━━━━━━━━━━━━━━━━━━━━
- Scalping (1m–5m): Swing Length 3, OB Search 15, Volume ON 1.5×
- Intraday (15m–1H): Swing Length 5, OB Search 25, Volume ON 1.5×
- Swing (4H–Daily): Swing Length 7, OB Search 40, Volume OFF
- Forex/Gold: Volume OFF (broker tick volume unreliable)
- Stocks/Crypto/Futures: Volume ON
━━━━━━━━━━━━━━━━━━━━
No repainting. Pivot detection is inherently offset by pivot length bars by design. All zone creation and mitigation runs on confirmed price data only. Penunjuk
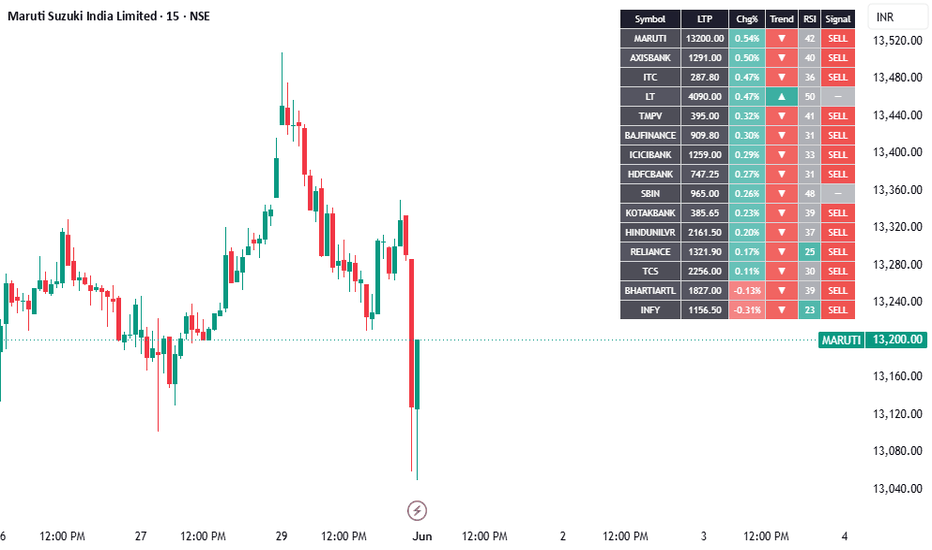
Pro Scanner Multi-Symbol Trend & Momentum Scanner
OVERVIEW
This indicator scans up to 15 user-defined symbols and presents them in a
single color-coded dashboard on your chart. Instead of flipping between charts,
you get a consolidated view of price, change, trend bias, RSI and a combined
signal for every symbol in your watchlist.
HOW IT WORKS
For each symbol, the script requests data on a timeframe you choose and computes:
- LTP: the latest close.
- Chg%: percentage change vs the previous bar of the selected timeframe
(set the Scanner Timeframe to "D" for daily change).
- Trend: bullish (up) when price is above its EMA, bearish (down) when below.
EMA length is adjustable.
- RSI: standard Relative Strength Index with adjustable length; cells are shaded
for overbought (above 70) and oversold (below 30).
- Signal: a combined read from trend direction and RSI — BUY when trend is up
and RSI is firm, SELL when trend is down and RSI is weak, neutral otherwise.
The table can be sorted by percentage change so the strongest movers rise to the top.
HOW TO USE
1. Add the indicator to any chart.
2. In settings, enter your symbols in EXCHANGE:TICKER form (e.g. NSE:RELIANCE).
3. Set the scanner timeframe, EMA length and RSI length to match your style.
4. Use the dashboard to see which symbols share the same trend and momentum bias.
It is meant as a quick filter to shortlist symbols for closer analysis on
their own charts.
SETTINGS
- Scanner Timeframe, Trend EMA Length, RSI Length
- Sort by % change (on/off)
- Table position and text size
- 15 editable symbols
NOTES
This tool is for analysis and education only. It does not predict future prices
and is not financial advice. Reliable results require a valid data feed for each
symbol. Always do your own research and manage risk. Penunjuk
Penunjuk
Smart Stochastic Prosmart stochastic pro is a momentum oscillator built to read stochastic structure, buying and selling pressure, and multi-timeframe bias in one clean panel.
the script is designed for traders who want a visual way to track when the market is stretched, when pressure starts to shift, and when a reversal setup becomes more interesting. it does not predict price and it should not be used alone. it is meant to support analysis together with price action, market structure, support and resistance, volume, and risk management.
what the script does
smart stochastic pro uses a smoothed stochastic engine to create rounded %k and %d curves. the goal is to reduce visual noise while keeping the oscillator responsive enough for intraday and swing analysis.
the script includes:
* a smoothed stochastic %k and %d
* extreme overbought and oversold zones
* buying and selling pressure based on candle position and volume
* optional mtf calculation modes
* reversal detection after extreme zones
* optional candle coloring
* a compact dashboard
* visual pressure zones and signal labels
how to use it
add the script to a normal candlestick chart. for the clearest reading, start with the default settings and use a liquid market such as major crypto pairs, forex pairs, indices, or large-cap stocks.
the oscillator moves between 0 and 100.
basic reading:
* above 80 means price is in an overbought area
* below 20 means price is in an oversold area
* above 90 means extreme overbought
* below 10 means extreme oversold
* the 50 line is the neutral zone
* %k above %d shows bullish momentum
* %k below %d shows bearish momentum
the script works best when you do not take every cross. the main idea is to wait for a strong area first, then look for a confirmed shift.
beginner workflow
1. start on the chart mode
use:
calculation / visual mode: chart
this uses the current chart timeframe and is the easiest mode to understand.
2. wait for an extreme zone
for bullish setups, watch for %k to move into the extreme oversold area.
for bearish setups, watch for %k to move into the extreme overbought area.
this arms the setup. it does not mean enter immediately.
3. wait for confirmation
a bullish reversal becomes more interesting when:
* %k crosses above %d
* the oscillator starts rising
* buying pressure improves
* the signal appears after an oversold expansion
a bearish reversal becomes more interesting when:
* %k crosses below %d
* the oscillator starts falling
* selling pressure improves
* the signal appears after an overbought expansion
4. check the pressure
the pressure background and ribbons help show whether buyers or sellers are gaining control.
green pressure means buying is stronger.
red pressure means selling is stronger.
neutral pressure means the market may still be undecided.
5. use the dashboard
the dashboard summarizes:
* active mode
* current bias
* mtf bias
* slope
* oscillator zone
* buying or selling pressure
* %k and %d values
* signal strength
* armed state
for beginners, the most useful dashboard rows are state, zone, pressure, and armed.
recommended settings
for beginners:
* calculation / visual mode: chart
* require explosion first: true
* minimum confluence strength: 2
* hide mid-range noise: true
* show pressure: true
* show dashboard: true
* candle color: off at first
for cleaner signals:
* require explosion first: true
* minimum confluence strength: 3
* hide mid-range noise: true
* mtf bias filters signals: true
for faster signals:
* require explosion first: false
* minimum confluence strength: 2
* hide mid-range noise: true
for multi-timeframe use:
mtf strict shows the oscillator calculated directly from the selected higher timeframe.
mtf bias keeps the chart oscillator smoother while using the higher timeframe as a directional filter.
a simple setup is:
* chart timeframe: 5m or 15m
* mtf timeframe: 1h
* mtf bias filters signals: true
where to use it
the script can be used on:
* crypto
* forex
* indices
* stocks
* futures
it is usually cleaner on markets with good liquidity and enough volume. low-volume markets can create noisy pressure readings and weaker signal quality.
timeframes
for scalping, try 1m to 5m, but expect more noise.
for intraday trading, 5m to 30m is usually easier to read.
for swing trading, 1h to 4h gives slower but cleaner signals.
how not to use it
do not buy only because the oscillator is oversold.
do not sell only because the oscillator is overbought.
do not use one signal without checking market structure.
do not use it as a guaranteed entry system.
do not ignore risk management.
best practice
use the script as a timing and confirmation tool.
a stronger bullish setup usually has:
* price near support or after a liquidity sweep
* %k coming from oversold or extreme oversold
* buying pressure improving
* bullish signal strength at least 2 or 3
* mtf bias not fighting the trade
a stronger bearish setup usually has:
* price near resistance or after a failed breakout
* %k coming from overbought or extreme overbought
* selling pressure improving
* bearish signal strength at least 2 or 3
* mtf bias not fighting the trade
alerts
alerts are available for:
* bullish reversal after extreme oversold
* bearish reversal after extreme overbought
* extreme oversold
* extreme overbought
* pressure flip bullish
* pressure flip bearish
use alerts as reminders to check the chart, not as automatic trade entries.
notes
this script is an analysis tool. it does not guarantee results. all signals should be reviewed with price action, trend context, volatility, and personal risk rules before making a trade decision.
Penunjuk

Supply Demand Pro - VWAP + Liquidity ConfluenceSupply Demand Pro — Liquidity + VWAP Confluence
by ApexFlow
━━━━━━━━━━━━━━━━━━━━
INSPIRATION & CREDIT
━━━━━━━━━━━━━━━━━━━━
Credit: Zone base detection concept inspired by "Market Structure Break & Orderblock" by EmreKb (TradingView open-source). All code has been rewritten with significant original additions: quantitative grading system (A+/A/B/C), VWAP confluence scoring, liquidity sweep detection, multi-timeframe overlay, and live backtest panel.
━━━━━━━━━━━━━━━━━━━━
WHAT THIS INDICATOR DOES
━━━━━━━━━━━━━━━━━━━━
Detects institutional supply and demand zones using a three-layer confluence model:
1. Zone formation: explosive impulsive move + consolidation base
2. Zone scoring: quantitative grade based on move strength, volume, VWAP proximity, HTF overlap
3. Signal generation: price returns to zone with rejection confirmation + sweep detection
The combination of these three layers separates this from standard S&D indicators that draw zones without qualification.
━━━━━━━━━━━━━━━━━━━━
ZONE DETECTION METHODOLOGY
━━━━━━━━━━━━━━━━━━━━
A zone forms when a confirmed bar (barstate.isconfirmed) meets all of:
- Bar range > ATR(14) × Move Multiplier — confirms volatility expansion
- Candle body > 55% of total range — filters wicky, indecisive bars
- Optional: Volume > SMA(20) × multiplier — confirms participation
ATR uses ta.atr(14). Body percentage = |close − open| / (high − low).
The base of the zone is built from preceding candle(s) where:
- |close − open| < ATR × 0.5 (small-bodied consolidation)
- Bar is not itself explosive
Base high and low define the zone boundaries:
- Supply zone: base candle(s) before bearish explosive move
→ Top = base high, Bottom = min(base low, explosive open)
- Demand zone: base candle(s) before bullish explosive move
→ Top = max(base high, explosive open), Bottom = base low
All detection references bar and bar on confirmed bars only. No repainting, no lookahead.
━━━━━━━━━━━━━━━━━━━━
ZONE GRADING SYSTEM (A+ / A / B / C)
━━━━━━━━━━━━━━━━━━━━
Each zone receives a score from 0–100 at creation using four measurable factors:
Move strength (max 30 pts):
- score += min((range / ATR ) × 18, 30)
Volume strength (max 20 pts):
- score += min((volume / volAvg ) × 13, 20)
- If volume confirmation disabled: default 10 pts
VWAP confluence (25 pts):
- +25 if session VWAP falls within zone ± (ATR × tolerance)
- Uses ta.vwap (session-anchored)
HTF zone overlap (20 pts):
- +20 if zone price range overlaps a detected higher-timeframe zone
- HTF data pulled via request.security() with lookahead=barmerge.lookahead_off
Freshness bonus (5 pts):
- +5 at creation
Grade thresholds:
- A+ ≥ 80 | A ≥ 65 | B ≥ 50 | C < 50
Grade displayed as badge inside each zone. Signals filterable by minimum grade.
━━━━━━━━━━━━━━━━━━━━
VWAP CONFLUENCE
━━━━━━━━━━━━━━━━━━━━
Session VWAP (ta.vwap) compared to each new zone at creation:
vwapInZone = VWAP ≥ (zoneBottom − ATR × tolerance)
AND VWAP ≤ (zoneTop + ATR × tolerance)
When true, zone receives +25 score and ⊕V tag on label.
━━━━━━━━━━━━━━━━━━━━
MULTI-TIMEFRAME ZONE OVERLAY
━━━━━━━━━━━━━━━━━━━━
Same detection logic runs on a higher timeframe via:
request.security(syminfo.tickerid, htfRes, f_htfDetect(), lookahead=barmerge.lookahead_off)
HTF zones drawn with dashed blue borders. When LTF zone overlaps active HTF zone it receives +20 confluence bonus and ⊕H label tag. HTF zones auto-mitigated when price closes through them.
━━━━━━━━━━━━━━━━━━━━
LIQUIDITY SWEEP DETECTION
━━━━━━━━━━━━━━━━━━━━
A liquidity sweep is defined as:
For demand zones (⚡BUY):
- bar low < zone bottom — wick pierced below
- bar close > zone bottom — body reclaimed inside zone
- Sweep depth = (zoneBottom − low ) / close ≥ minimum threshold
- Current bar confirms bullish (close > open)
For supply zones (⚡SELL): inverse conditions apply.
This represents institutional stop hunting — retail stops below a structural low are triggered, price immediately reverses. These are marked as ⚡BUY / ⚡SELL, visually distinct from regular signals.
━━━━━━━━━━━━━━━━━━━━
SIGNAL LOGIC
━━━━━━━━━━━━━━━━━━━━
Regular BUY signal fires when all confirmed on closed bar:
- Price taps active demand zone (low ≤ zone top)
- Close back above zone top — bullish body
- Lower wick ≥ 50% of candle range — rejection confirmation
- Trend filter: close > EMA(50) — directional bias
- Zone grade meets minimum requirement
- Zone not yet used (one-signal-per-zone mode)
- Cooldown bars passed since last signal
Inverse for SELL at supply zones.
━━━━━━━━━━━━━━━━━━━━
ZONE MITIGATION
━━━━━━━━━━━━━━━━━━━━
Two modes:
- Body Close: zone removed when candle body closes through zone boundary
- Wick Touch: zone removed when any wick touches zone boundary
Mitigated zones are deleted from chart automatically. All related labels and badges deleted simultaneously via parallel array management.
━━━━━━━━━━━━━━━━━━━━
LIVE BACKTEST PANEL
━━━━━━━━━━━━━━━━━━━━
Every fired signal is logged with: entry price, ATR at entry, direction, bar index. On subsequent bars the script evaluates:
- Win: price reaches entry ± (ATR × targetMultiplier) in signal direction
- Loss: price reaches entry ∓ (ATR × stopMultiplier) against signal direction
First level hit determines outcome. Panel displays:
- Total signals tracked (configurable max, default 50)
- Wins / Losses / Open
- Win rate %
- Average R-multiple = (wins × targetMult − losses × stopMult) / closed signals
This is a logic-level simulation using OHLC data. Not slippage or fee adjusted.
━━━━━━━━━━━━━━━━━━━━
WHAT IS ORIGINAL
━━━━━━━━━━━━━━━━━━━━
- Quantitative zone grading (0–100 score → A+/A/B/C) based on four measurable confluences
- Liquidity sweep detection as a separate premium signal class
- VWAP proximity as a scored confluence factor (not just an overlay)
- HTF zone overlap as a scored confluence factor
- Live backtest panel tracking actual signal outcomes with R-multiple
- Adaptive zone extension — boxes track current bar instead of extending infinitely
- All filters stackable independently: grade, trend, wick size, cooldown, session, freshness
━━━━━━━━━━━━━━━━━━━━
HOW TO USE
━━━━━━━━━━━━━━━━━━━━
- Green boxes = demand zones | Red boxes = supply zones
- Dashed blue boxes = higher timeframe zones
- Grade badge inside each zone: A+ (yellow) / A (orange) / B (gray) / C (faded)
- ⊕V = VWAP confluence | ⊕H = HTF confluence
- Triangle up = BUY signal | Triangle down = SELL signal
- ⚡BUY / ⚡SELL = liquidity sweep signals (highest probability)
Recommended workflow:
1. Identify A or A+ graded zones with ⊕V or ⊕H tags
2. Wait for price to return to zone
3. Enter on BUY/SELL signal — wick rejection + bullish/bearish close
4. Prioritize ⚡ sweep signals when available
5. Monitor backtest panel to confirm positive expectancy on your asset
━━━━━━━━━━━━━━━━━━━━
RECOMMENDED SETTINGS
━━━━━━━━━━━━━━━━━━━━
- Forex / Gold (XAUUSD): Volume confirmation OFF
- Stocks / Crypto / Futures: Volume confirmation ON
- Scalping: 5m–15m chart, HTF = 1H
- Intraday: 15m–1H chart, HTF = 4H
- Conservative: Min Grade = A, Cooldown = 10
- Aggressive: Min Grade = B, Cooldown = 5
━━━━━━━━━━━━━━━━━━━━
No repainting. No lookahead bias. All signals fire on barstate.isconfirmed only.
Detection uses bar and bar historical references exclusively.
WHY THESE COMPONENTS WORK TOGETHER
Supply and demand zones identify WHERE price is likely to react. VWAP identifies WHERE fair value sits. Neither alone confirms institutional intent. When a zone aligns with VWAP and a higher-timeframe zone simultaneously, the probability of a genuine institutional reaction increases measurably. The liquidity sweep signal adds a third layer — detecting when stops are hunted before reversal. These three components cannot produce the same edge independently; the confluence scoring model is what ties them into one system. Penunjuk

Relative Volume (RVOL) Surge Dashboard Overview
The **Relative Volume (RVOL) Surge Dashboard** is a utility script designed to visually isolate institutional activity and anomalies in volume. In financial markets, sudden volume spikes that double the recent average often signal institutional presence, news-driven breakouts, or potential trend exhaustion points.
This indicator keeps your main chart clean while feeding you live volume metrics via an on-chart HUD (Heads-Up Display).
Key Features
* **Live Relative Volume Multiplier: ** Instantly displays exactly how many times the current bar's volume is exceeding its standard historical moving average (e.g., 1.54x, 3.10x).
* **Smart UI Dashboard: ** A customizable, clean panel that switches colors (Green/Red) immediately depending on whether a 2x volume surge is active or normal.
* **On-Chart Signals: ** Draws a clean yellow cross at the bottom of the price bar whenever a volume anomaly occurs.
* **Built-in Alert Engine: ** Supports native Trading View alert conditions so you can receive push notifications, email, or webhook alerts the exact second a volume anomaly prints.
How to Use It
1. **Trend Breakout Confirmation: ** Look for the dashboard to trigger a green "2x ALERT: ACTIVE" during a consolidation breakout. High volume confirms validity.
2. **Climactic Reversals: ** If a stock has been in an extended downtrend/uptrend and suddenly prints a massive 2x+ volume spike without making significant price progress, look for a potential reversal.
3. **Customization: ** Use the settings panel to change the lookback period (default is 20 bars) or move the dashboard to any corner of your screen to prevent overlapping other indicators.
DISCLAIMER:
This script is created for educational, informational, and utility purposes only. It does not constitute financial, investment, or trading advice. Past performance of any volume metrics or technical signals is not indicative of future results. Financial markets involve substantial risk of loss, and individual traders are entirely responsible for their own capital allocation and risk management. Always perform your own due diligence before entering any trade. Penunjuk

Strategi
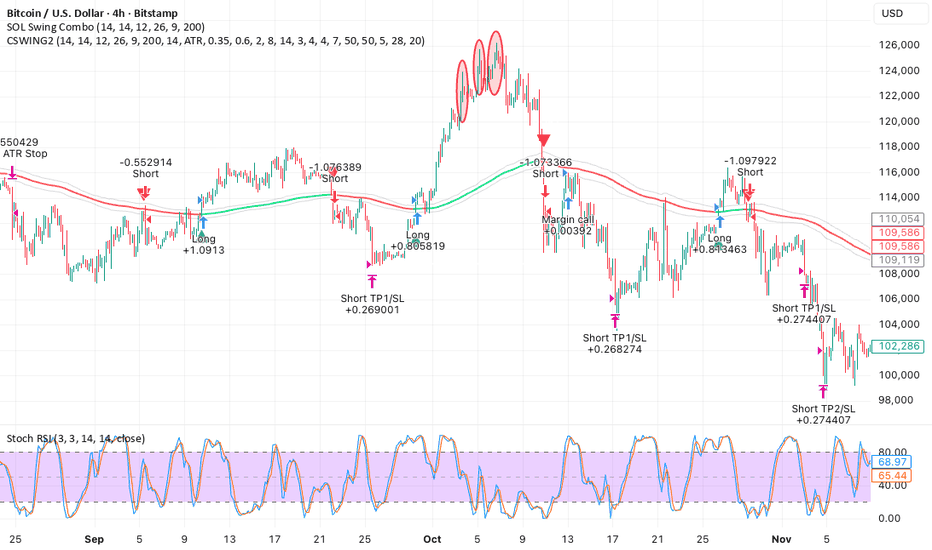
Crypto Swing buy and sell indicatorCrypto Swing Buy and Sell Indicator is a trend-following swing indicator designed for crypto markets. It combines a 200-period EMA trend filter with MACD histogram momentum shifts, RSI recovery/cooling zones, and MFI volume-flow confirmation to highlight potential buy and sell opportunities.
The indicator plots a dynamic EMA 200 line that changes colour depending on whether price is trading above or below the trend filter. A BUY signal appears when price is above the EMA 200, MACD momentum turns bullish, RSI is recovering from lower levels, and MFI confirms that the move is not yet overextended. A SELL signal appears when price is below the EMA 200, MACD momentum turns bearish, RSI is cooling from higher levels, and MFI confirms weakening buying pressure.
This indicator is intended for swing trading and trend confirmation, especially on higher timeframes such as 4H or daily charts. It can be used to identify possible long and short setups, but should be combined with risk management, support/resistance analysis, and broader market context.
Signals:
BUY: Price above EMA 200 + MACD bullish flip + RSI recovering + MFI below 50.
SELL: Price below EMA 200 + MACD bearish flip + RSI cooling + MFI above 50.
Recommended use: crypto swing trading, trend confirmation, momentum-based entries, and alert-based trade monitoring. Penunjuk

Strategi

Penunjuk
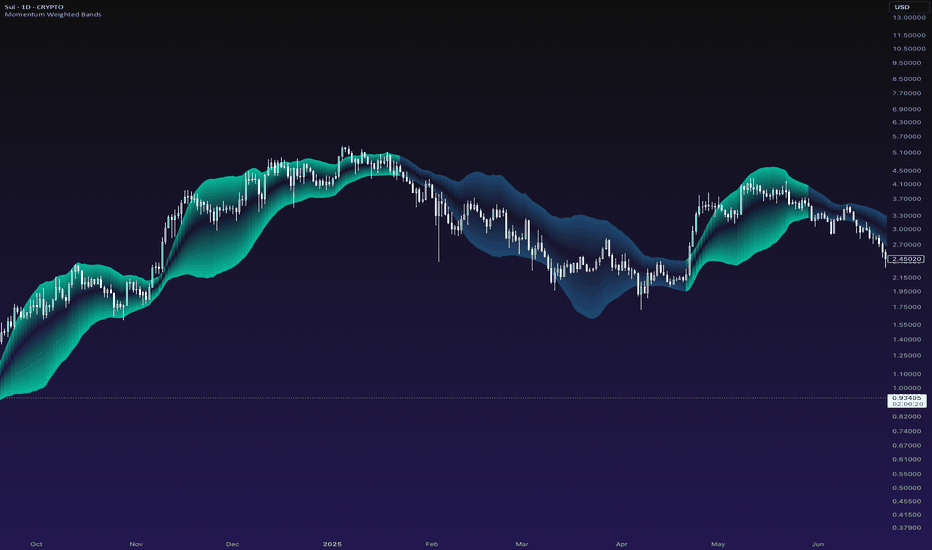
Artemis Squeeze Momentum🟦 Artemis Squeeze Momentum collapses an entire momentum-and-volatility workflow into a single oscillator pane. Eight analytical layers — Squeeze Momentum core, Directional Flux, three-tier compression detection with a release tracker, dual confluence gauges, dual anchor Regular + Hidden divergence with a Smart AI Filter, a composite Trend Strength Score (0–100), a four-timeframe MTF Confluence panel with alignment / divergence detection, and a theme-adaptive PRO dashboard — operate as one integrated system, all driven by a single theme dropdown across 12 cohesive palettes.
Most squeeze indicators ship as a strip of black-and-red dots with a lone momentum histogram, then require a separate ADX, a separate divergence tool and a separate confluence gauge to complete the read. Artemis Squeeze Momentum closes that gap: every compression tier, every directional cross, every divergence, every higher-timeframe bias reads from the same pane in the same colour language — no inline colour pickers, no palette drift, no pane-hopping. The result is a complete momentum workbench where compressions, breakouts, regime flips, divergences and multi-TF bias are all readable at a glance.
🟦 HOW THE CORE ENGINE WORKS
**Squeeze Momentum Engine**
Each bar, the engine builds three anchors over the Momentum Length window:
1. **Channel midpoint** — `(highest(high, len) + lowest(low, len)) / 2`
2. **Smoothed midline** — `SMA(HL2, len)`
3. **Channel ATR** — channel range plus the gap-to-prior-close component (matches Pine v5 `tr(true)` on the synthetic channel bar)
The raw momentum is then computed as:
mom_raw = (close − avg(channelMid, smaMid)) / channelATR × 100
This produces a channel-aware, ATR-normalized residual scaled to roughly the ±100 range. The result is then passed through `ta.linreg(mom_raw, len, 0)` to produce the visible momentum line — a linear-regression smoothing that gives the curve its characteristic forward-leaning shape. An SMA of length Signal Length builds the trigger line. Crossovers between momentum and signal mark momentum regime changes — the same convention used by classical MACD.
**Directional Flux**
A custom ADX-style oscillator running in parallel. Each bar, the engine measures positive high-changes vs. negative low-changes, each RMA-smoothed and ATR-normalized:
up = RMA(max(change(high), 0), len) / ATR(len)
dn = RMA(max(−change(low), 0), len) / ATR(len)
ratio = (up − dn) / (up + dn)
flux = RMA(ratio, len / 2) × 100
The result is a directional bias oscillator bounded to ±100. An overflow branch (values past ±25 — where the directional pressure becomes structurally significant) renders as a separate, brighter fill so traders read both raw direction and acceleration in one glance.
**Heiken Ashi Bias (Optional)**
When `Use Heiken Ashi Bias` is enabled, the Flux engine reads from a Heiken Ashi bar stream instead of raw OHLC. HA bars smooth body / wick noise and emphasise trend continuation — useful on lower timeframes where raw OHLC is noisy.
🟦 SQUEEZE DETECTION
A three-tier Bollinger-vs-ATR compression detector running on the same Length as the Momentum Core (so compression and momentum stay perfectly aligned):
| Tier | Condition | Visual |
|---|---|---|
| Tight | stdev < ATR × 0.5 | Deepest, most saturated theme tone |
| Mid | stdev < ATR × 0.75 | Middle-intensity theme tone |
| Loose | stdev < ATR × 1.0 | Lightest tier — broadest detection |
Tiers nest — tight implies mid implies loose. The bottom-of-pane squeeze column lights up whenever any tier is active and the colour escalates as compression tightens, using a theme-native ramp drawn from each palette's own colour family (so the column reads as part of the theme rather than an imported generic warning).
The standard deviation is computed via a single-pass Welford algorithm — numerically stable on long histories where naive sum-of-squares accumulators drift.
**♦ Squeeze Release Marker**
The signature feature of the engine. The bar after the loosest active tier (stdev < ATR × 1.0) finally drops off, a tiny ♦ diamond paints at the midline in the theme's vivid release accent — one step brighter and more saturated than the tight tier so the climax moment reads as the most luminous point in the squeeze cycle.
This is the canonical "spring uncoiled" moment: compression has fully ended, volatility expansion begins, breakout direction is about to reveal itself. Historically the highest-conviction breakout setup the squeeze model produces. Hovering on the marker surfaces:
- Current bar state (compression ended this bar)
- Meaning (volatility expansion incoming)
- Next steps (watch the next 1–5 bars, confirm with Momentum slope, cross-check Flux, prioritise MTF-aligned setups)
🟦 CONFLUENCE GAUGES
Two horizontal strips render at the top (Bull side, +70 to +75) and bottom (Bear side, −70 to −75) of the pane. Each strip lights up when momentum and flux agree on direction, with brightness reflecting the confluence tier:
| State | Condition | Opacity |
|---|---|---|
| Strong Bull | mom > 0 AND flux > 0 | Full |
| Weak Bull | mom > 0 OR flux > 0 | Half |
| Strong Bear | mom < 0 AND flux < 0 | Full |
| Weak Bear | mom < 0 OR flux < 0 | Half |
| Neutral | Neither side dominates | Transparent |
The display mode (Both / Bull / Bear / None) lets traders mute one half if they only trade one direction.
**Confluence Buy / Sell Triangles**
A separate signal layer rides outside the gauges. The detector fires only when momentum crosses its signal line WHILE in the opposite zone past the Signal Threshold AND with flux in the opposite direction (classic mean-reversion logic):
- **Buy ▲** (below bear gauge at −90) — `xMomUp AND momVal < −threshold AND fluxVal < 0`
- **Sell ▼** (above bull gauge at +85) — `xMomDn AND momVal > +threshold AND fluxVal > 0`
Each triangle pairs with an invisible label carrying a tooltip that lists current mom, signal, flux, the active threshold, and a one-line interpretation of the trigger. The Signal Threshold (default 40) is independent of the Divergence Sensitivity setting — the two engines need different thresholds (divergence wants permissive at 25 for pivot detection, confluence wants strict at 40 for deep mean-reversion triggers).
🟦 DIVERGENCE DETECTION
A cross-confirmed, dual-anchor detector that fires on signal-line crossovers (NOT on Pine pivots). Regular divergences signal exhaustion reversals, Hidden divergences signal trend continuation.
**Four divergence types:**
| Type | Price | Momentum | Signal |
|---|---|---|---|
| Regular Bull (D▲) | Lower Low | Higher Low | Potential reversal up |
| Regular Bear (D▼) | Higher High | Lower High | Potential reversal down |
| Hidden Bull (H▲) | Higher Low | Lower Low | Uptrend continuation |
| Hidden Bear (H▼) | Lower High | Higher High | Downtrend continuation |
Regular divergence uses solid lines; Hidden uses dashed lines — visually quieter to match the continuation signal's lower conviction tier. Labels (D▲ / D▼ / H▲ / H▼) each carry a tooltip-rich hover with price + momentum + meaning context.
**Dual-Anchor Logic**
The key engineering choice. Regular and Hidden divergences each maintain their own separate anchor pair:
- **Regular anchors** — stored only at extreme-zone crosses (|mom| > Sensitivity). Catches classical exhaustion reversals at deep extremes.
- **Hidden anchors** — stored at ANY signal-line cross, regardless of zone. Shallow pullbacks inside an established trend rarely push momentum past ±Sensitivity, so the Hidden detector must accept every cross to capture the classical "price HL + mom LL" / "price LH + mom HH" continuation pattern.
A detected divergence consumes its anchor (resets to na) so the next setup starts fresh.
**Smart Divergence Filter (AI)**
Optional pre-filter that rejects low-quality divergences before they render. Three independent gates:
1. **Min Momentum Swing** — minimum |momentum| difference between the two pivot momentum values (default: 10 units). Drops noise-level differences.
2. **Min Price Swing (%)** — minimum price swing between pivots as a percentage of the recent `Momentum Length × 4` high-low range (default: 0.3%). Drops divergences where price barely moved relative to recent volatility.
3. **Require Flux Confirmation** — Flux must agree with the divergence direction at the moment of detection (Bull div needs Flux > 0, Bear div needs Flux < 0). Filters out divergences that fire counter to the broader directional bias.
When the master toggle is OFF (default), all detected divergences render. When ON, only divergences that clear all three gates survive. The filter applies identically to chart rendering and alert conditions — no mismatch between visual and alert signals.
🟦 COMPOSITE TS SCORE (0–100)
A weighted blend of every analytical layer into a single RSI-style 0–100 reading. 50 is neutral, > 50 leans bull, < 50 leans bear.
| Component | Weight | Mapping |
|---|---|---|
| Momentum | 30% | mom value mapped from −100..+100 → 0..100 |
| Flux | 30% | flux value mapped the same way |
| Mom × Signal | 15% | 70 if mom > sig, else 30 (slope direction confirmation) |
| Confluence | 25% | 90 strong-bull / 65 weak-bull / 50 neutral / 35 weak-bear / 10 strong-bear |
The score is rounded to the nearest integer and labelled into five tiers in the dashboard: STRONG BULL (≥75) / BULL (≥60) / NEUTRAL (40–59) / BEAR (≥25) / STRONG BEAR (<25), each prefixed with a directional glyph (▲ ▼ ■). The tier label gives traders an executive summary at a glance — one row in the dashboard tells you what every other row collectively says.
🟦 MULTI-TIMEFRAME CONFLUENCE
A separate PRO panel that runs the full Momentum + Flux + Confluence stack on four higher timeframes simultaneously via `request.security()` and surfaces the overall alignment state. All MTF calls use `lookahead = barmerge.lookahead_off` — fully repaint-safe on every closed bar.
**Six Presets**
Pre-tuned four-timeframe packs matched to common trader profiles:
| Preset | TF 1 | TF 2 | TF 3 | TF 4 | Use case |
|---|---|---|---|---|---|
| Scalp | 1m | 5m | 15m | 1h | Fast scalper |
| Intraday | 5m | 15m | 1h | 4h | Day trader |
| Swing | 15m | 1h | 4h | 1D | Default — swing trader |
| Position | 1h | 4h | 1D | 1W | Position trader |
| Crypto | 5m | 15m | 1h | 4h | 24/7 markets |
| Forex | 15m | 1h | 4h | 1D | Session-based markets |
**Alignment Detection**
Each TF returns a bias tag (▲ STRONG / ▲ WEAK / ▼ STRONG / ▼ WEAK / ◈ NEUTRAL) and a direction code (+1 / 0 / −1). The header rolls up the four codes into one of three states:
- **▲▲▲▲ ALIGNED** — all four TFs bullish (highest-conviction long setup)
- **▼▼▼▼ ALIGNED** — all four TFs bearish (highest-conviction short setup)
- **◈ MIXED** — TFs disagree (no clean direction)
**Divergence Detection**
When the current chart's bias contradicts ≥ 3 of the 4 HTF biases (e.g., chart bullish but 3+ HTFs bearish), an MTF Divergence flag fires — a contrarian / counter-trend warning. Treat as a "current move may be a bull / bear trap" signal.
**Panel Style**
Direction is conveyed purely by the ▲ / ▼ glyphs in each row's tag — never by cell colour. Every cell uses a uniform `thBull` text colour matching the main Dashboard, so the two panels feel like one product across all twelve themes, light and dark alike.
🟦 BAR COLORING
Five mutually exclusive modes apply an oscillator-driven colour to every price bar on the chart:
| Mode | Behavior |
|---|---|
| None | Leave bars untouched (default) |
| Momentum | Bull when mom > 0, bear when mom < 0 |
| Flux | Bull when flux > 0, bear when flux < 0 |
| Squeeze | Theme-native ramp when compressed, neutral otherwise |
| Confluence | Strong / Weak / Neutral tiers via mom + flux agreement |
| Slope | Bull when mom > signal, bear when mom < signal |
Colours are pulled from the active theme — no per-mode color picker needed.
🟦 DASHBOARD
A compact 2-column, 8-row data panel renders on the last bar when enabled. Every value derives from variables already computed upstream, so the dashboard adds zero overhead until the final bar.
| Row | Left | Right |
|---|---|---|
| Header | Artemis Squeeze | ▲ STRONG BULL / ▲ WEAK BULL / ■ NEUTRAL / ▼ WEAK BEAR / ▼ STRONG BEAR |
| TS Score | TS Score | 0–100 composite + tier label (STRONG BULL / BULL / NEUTRAL / BEAR / STRONG BEAR) |
| Momentum | Momentum | Current value + trend arrow (▲ ▼ ■) |
| Flux | Flux | Current value + trend arrow (▲ ▼ ■) |
| Squeeze | Squeeze | TIGHT / MID / LOOSE / — |
| Confluence | Confluence | STRONG BULL / WEAK BULL / NONE / WEAK BEAR / STRONG BEAR |
| Div | Div | Most recent divergence within last 50 bars (▲ REG / ▼ REG / ▲ HID / ▼ HID / —) |
| Slope | Slope | ▲ UP / ▼ DOWN / ■ FLAT |
**Theme-Adaptive Chrome**
The dashboard auto-inverts its layout based on the active theme:
- **Dark themes** (Tropic, Amber, Pastel, Cyber, Helios, Electric, Candy, Bloomberg, Solar, Royal): header and footer use a faint `thBull` tint, middle rows stay solid dark, text uses full-saturation `thBull`. Border uses `thBull` at 20% transparency for strong theme presence.
- **Light themes** (Midnight, Graphite): backgrounds flip to white, text stays `thBull` (which is itself dark on these themes), border uses `thBull` at 40% transparency.
This guarantees text legibility against every palette without per-theme manual tuning. The MTF Confluence panel uses identical chrome rules so the two panels feel like one product.
**Position & Size**
Six anchor slots (Top / Middle / Bottom × Left / Right) and four text sizes (Tiny / Small / Normal / Large). The Dashboard defaults to Bottom Right and the MTF panel to Top Right — vertically opposite so the two never overlap.
🟦 COLOR THEMES
Twelve cohesive palettes, each resolving to four axis colours plus a four-step squeeze ramp:
| Theme | Character | Bull | Bear |
|---|---|---|---|
| Tropic | Cyan steel + deep orange | #00bcd4 | #ff6d00 |
| Amber | Warm amber + ember red | #ff9800 | #e53935 |
| Pastel | Sky blue + soft lavender | #4fc3f7 | #9575cd |
| Cyber | Neon lime + hot crimson | #00e676 | #ff1744 |
| Helios | Bright gold + scarlet | #ffd600 | #ef5350 |
| Electric | Electric aqua + magenta | #00e5ff | #e040fb |
| Candy | Neon green + hot pink | #69F0AE | #FF4081 |
| Bloomberg | Terminal orange + cyan | #ff8c00 | #00b0ff |
| Solar | Solarized olive + crimson | #859900 | #dc322f |
| Royal | Imperial gold + deep purple | #ffd700 | #6a0dad |
| Midnight | Deep navy + dark crimson | #0d47a1 | #b71c1c |
| Graphite | Near-black + silver grey | #1a1a1a | #757575 |
Beyond the four axis colours (bull / bear / neutral / signal), each theme also defines its own four-step squeeze ramp (tight / mid / loose / release) drawn from its own colour family — so the squeeze column and the ♦ release marker harmonise with the active theme rather than imposing a generic warning hue. Nothing below the theme resolver block references a raw hex literal, so a single dropdown selection drives every plot, fill, gauge, divergence line, dashboard cell, MTF panel and bar colour.
🟦 ALERT SYSTEM
Twenty-two alert conditions, all using `alert.freq_once_per_bar_close`. Each alert is gated by its own toggle in the Alerts group — hiding a feature on the chart silences its alerts automatically.
| Alert | Condition |
|---|---|
| Confluence Buy | Mom crossed UP through signal while below −Threshold AND Flux bearish |
| Confluence Sell | Mom crossed DOWN through signal while above +Threshold AND Flux bullish |
| Momentum Cross Up | Mom crossed above zero |
| Momentum Cross Down | Mom crossed below zero |
| Flux Cross Up | Flux crossed above zero |
| Flux Cross Down | Flux crossed below zero |
| Bullish Swing | Mom × signal upward cross (any zone) |
| Bearish Swing | Mom × signal downward cross (any zone) |
| Strong Bull Confluence | Mom AND flux both turned bullish |
| Strong Bear Confluence | Mom AND flux both turned bearish |
| Weak Bull Confluence | Mom OR flux turned bullish |
| Weak Bear Confluence | Mom OR flux turned bearish |
| Tight Squeeze | stdev < ATR × 0.5 |
| Mid Squeeze | stdev < ATR × 0.75 |
| Loose Squeeze | stdev < ATR × 1.0 |
| Regular Divergence | D▲ or D▼ detected (respects Smart Filter) |
| Hidden Divergence | H▲ or H▼ detected (respects Smart Filter) |
| Squeeze Release ♦ | stdev re-expanded above ATR × 1.0 |
| MTF Aligned | All four MTF timeframes agree on direction |
| MTF Divergence | Current chart bias contradicts ≥ 3 of 4 HTF biases |
Each alert fires through `alert()` so the message body carries live context — direction, current values, the trigger condition, and a one-line interpretation. Divergence alerts respect the Smart Filter — if the filter is ON and a divergence is rejected visually, the alert will also not fire.
🟦 SETTINGS REFERENCE
**Visual**
- Theme — 12 cohesive palettes. Default: Tropic
**Bar Coloring**
- Bar Color Mode — None / Momentum / Flux / Squeeze / Confluence / Slope. Default: None
**Momentum Core**
- Length — Lookback for both the Momentum engine and the Squeeze window. Range 7–50. Default: 20
- Signal Length — SMA smoothing for the signal line. Range 2–7. Default: 3
- Show Momentum — Toggle. Default: ON
**Directional Flux**
- Length — Lookback for the Flux engine. Range 7–50. Default: 30
- Use Heiken Ashi Bias — Toggle. Default: OFF
- Show Flux — Toggle. Default: ON
**Squeeze Engine**
- Show Squeeze — Toggle. Default: ON
- Show Squeeze Release — Toggle for the ♦ marker. Default: ON
**Confluence Gauges**
- Display Mode — Both / Bull / Bear / None. Default: Both
- Signal Threshold — |momentum| floor for Buy ▲ / Sell ▼ arrows. Range 10–80. Default: 40
**Divergence**
- Sensitivity — |momentum| floor for Regular div detection. Range 10–50. Default: 25
- Regular Divergence — Toggle. Default: ON
- Hidden Divergence — Toggle. Default: ON
- Show Divergence Lines — Toggle. Default: ON
- Show Divergence Labels — Toggle. Default: ON
- Label Size — Tiny / Small / Normal / Large. Default: Tiny
- Smart Divergence Filter (AI) — Master toggle. Default: OFF
- Min Momentum Swing — Default: 10.0
- Min Price Swing (%) — Default: 0.3%
- Require Flux Confirmation — Default: ON
**Multi-Timeframe**
- Show MTF Panel — Toggle. Default: ON
- Timeframe Preset — Scalp / Intraday / Swing / Position / Crypto / Forex. Default: Swing
- Panel Position — 6 anchor slots. Default: Top Right
- Panel Text Size — Tiny / Small / Normal / Large. Default: Small
**Dashboard**
- Show Dashboard — Toggle. Default: ON
- Panel Position — 6 anchor slots. Default: Bottom Right
- Panel Text Size — Tiny / Small / Normal / Large. Default: Small
**Alerts**
- 20 toggles covering all 22 alert conditions (Regular and Hidden divergence each drive two alerts — bull + bear — from one toggle).
- Defaults ON: Confluence Buy/Sell, Mom Cross Up/Dn, Flux Cross Up/Dn, Strong Bull/Bear Confluence, Tight Squeeze, Regular Divergence, Squeeze Release, MTF Aligned.
- Defaults OFF: Swings, Weak Confluences, Mid/Loose Squeeze, Hidden Divergence, MTF Divergence.
🟦 COMPATIBILITY
Works on all asset classes and all timeframes in TradingView Pine Script v6.
- Crypto: Spot, futures, perpetual contracts
- Forex: All pairs
- Equities: Stocks, ETFs, indices
- Commodities: Metals, energy, agriculture
- Timeframes: 1m through Monthly
The channel-aware ATR normalization in the Momentum engine, the ATR-normalized Flux ratio, and the stdev / ATR squeeze tests make every layer volatility-agnostic. The same default settings work on a 1m BTC chart and a weekly index chart without retuning. The MTF presets cover the common scalp / intraday / swing / position profiles plus dedicated Crypto and Forex packs.
🟦 DISCLAIMER
This indicator is provided for educational and informational purposes only. It does not constitute financial advice. Past performance does not guarantee future results. Always conduct your own analysis and apply proper risk management. Penunjuk

Penunjuk

Penunjuk