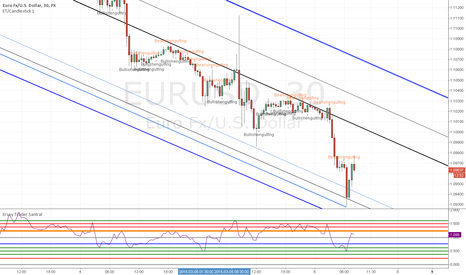
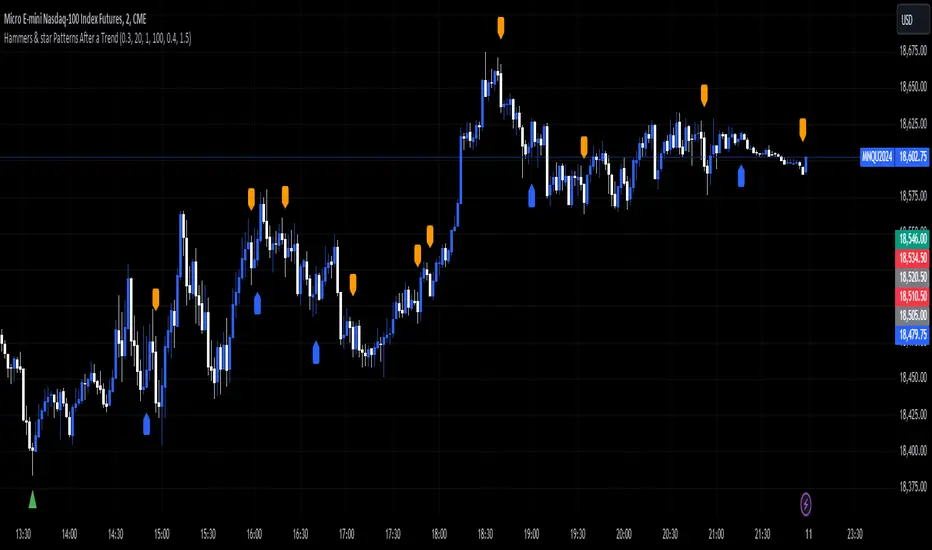
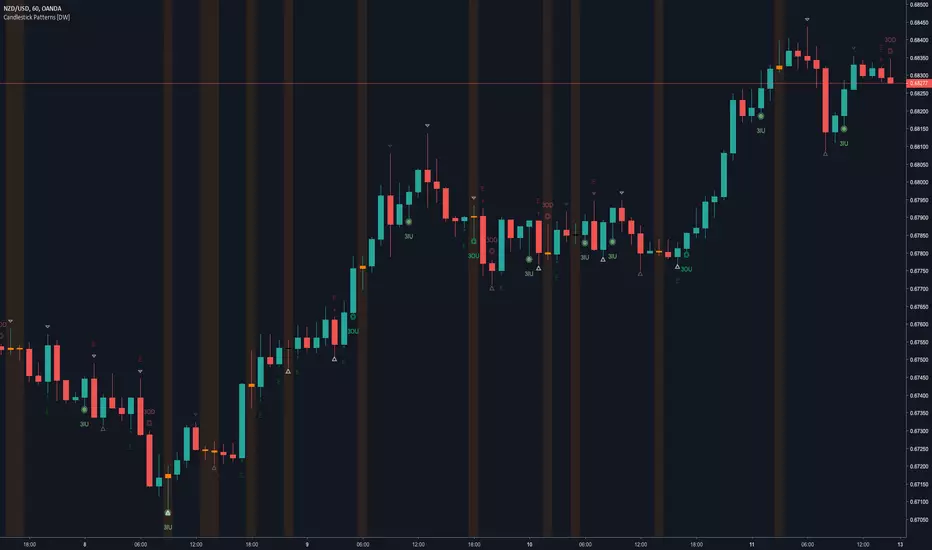
Morning & Evening Star Detector [SSFX]Morning & Evening Star Detector is an open-source candlestick pattern indicator designed to identify two classic 3-candle reversal formations: the Morning Star and the Evening Star.
The Morning Star is a bullish reversal pattern that typically appears after bearish pressure. The indicator identifies it using a 3-candle structure:
A strong bearish first candle
A small-bodied middle candle, representing hesitation or loss of momentum
A strong bullish third candle that closes back into the body of the first candle
The Evening Star is the opposite bearish reversal pattern. It is detected when the market forms:
A strong bullish first candle
A small-bodied middle candle
A strong bearish third candle that closes back into the body of the first candle
To make the patterns easier to read on the chart, the script automatically draws a box around the full 3-candle formation:
Green box = Morning Star
Red box = Evening Star
The box covers the full high-to-low range of the entire pattern, helping traders visually study where the reversal structure formed.
Main features:
Detects Morning Star bullish reversal patterns
Detects Evening Star bearish reversal patterns
Draws visual boxes around valid 3-candle patterns
Green highlight for Morning Star formations
Red highlight for Evening Star formations
Optional labels for detected patterns
Optional background highlighting
Adjustable candle body percentage filters
Adjustable middle candle size filter
Adjustable third candle close requirement
Optional gap requirement for more traditional pattern detection
Built-in alert conditions for both pattern types
The pattern logic is fully customizable. Users can adjust the required body size of the first candle, the maximum body size of the star candle, the minimum body size of the confirmation candle, and how deeply the third candle must close into the first candle’s body.
The optional gap setting is included for traders who prefer a more classical definition of Morning Star and Evening Star patterns. Since many markets such as forex, gold, crypto, and index CFDs often do not produce clean session gaps, the gap requirement can be turned off for more flexible detection.
This indicator is intended for educational and analytical use. It does not predict future price movement and should not be used as a standalone trading system. Morning Star and Evening Star patterns are best interpreted together with market structure, support and resistance, trend context, volume, and proper risk management.
Penunjuk

Smooths Trend BreakerSmooths Trend Breaker
Overview
Smooths Trend Breaker is a trend identification and entry timing tool that combines an adaptive ATR-based supertrend, a higher timeframe EMA trend filter, volume confirmation, an RSI gate, a price compression range detector, and FVG-gated star candlestick pattern recognition. Each component was chosen to address a specific weakness in standalone supertrend systems — noise in choppy markets, late entries, and signals that contradict the larger trend — and all components work together as a single decision framework rather than as separate overlapping indicators.
Component Methodology
Adaptive Supertrend Engine
The core engine uses an ATR-based supertrend calculation. True Range is computed on each bar as the maximum of the current high-low range, the absolute distance from the prior close to the current high, and the absolute distance from the prior close to the current low. ATR is then derived using Wilder's smoothing method — a modified exponential moving average with a smoothing factor of 1/N — rather than a simple average, which gives more weight to recent volatility while maintaining memory of past conditions.
The upper and lower bands are calculated as the midpoint of the bar's high-low range plus or minus the ATR multiplied by a user-defined multiplier. Bands are then locked directionally — the lower band can only move upward and the upper band can only move downward — preventing the line from retreating when price moves against the trend. The trend direction flips only when a closing price crosses the opposite band, not on intrabar wicks, ensuring signals are close-confirmed.
Rather than using fixed ATR settings across all timeframes, the indicator auto-selects ATR length and multiplier based on the chart's timeframe in seconds. Shorter timeframes receive a shorter ATR period and higher multiplier to account for proportionally larger noise relative to signal. Longer timeframes receive a longer period and lower multiplier to avoid over-sensitivity on slower-moving instruments. This eliminates the need to manually adjust parameters when switching timeframes.
Higher Timeframe EMA Filter
When enabled, the indicator uses `request.security()` to retrieve a 50-period EMA from a higher timeframe selected automatically based on the chart timeframe — for example a 15-minute EMA is referenced when viewing a 5-minute chart, and a 4-hour EMA is referenced when viewing a 1-hour chart. A Buy label is only confirmed when price closes above this EMA and a Sell label is only confirmed when price closes below it, aligning entries with the larger structural trend.
Volume Confirmation
The volume filter computes a 20-bar simple moving average of volume. A signal is confirmed only when the flip bar's volume exceeds this average by a user-defined threshold, defaulting to 1.2 times the average. This filters out supertrend flips that occur on low-participation bars, which have historically higher failure rates.
RSI Gate
A 14-period RSI using Wilder's smoothing is computed on each bar. Buy signals are blocked when RSI exceeds a user-defined overbought level (default 70) and Sell signals are blocked when RSI falls below a user-defined oversold level (default 30). This prevents chasing exhausted moves at extremes.
Range Breaker
The Range Breaker compares the current N-bar rolling range (highest high minus lowest low) against the prior N-bar rolling range from the equivalent lookback window shifted N bars back. When the current range is less than a defined ratio of the prior range — meaning price has compressed significantly relative to its recent volatility — a consolidation zone is declared. Horizontal lines are drawn at the highest high and lowest low of the active zone and extend forward with the current bar. When a closing price breaks outside either level the zone is sealed and a breakout marker fires.
Star Pattern Detection with FVG Gate
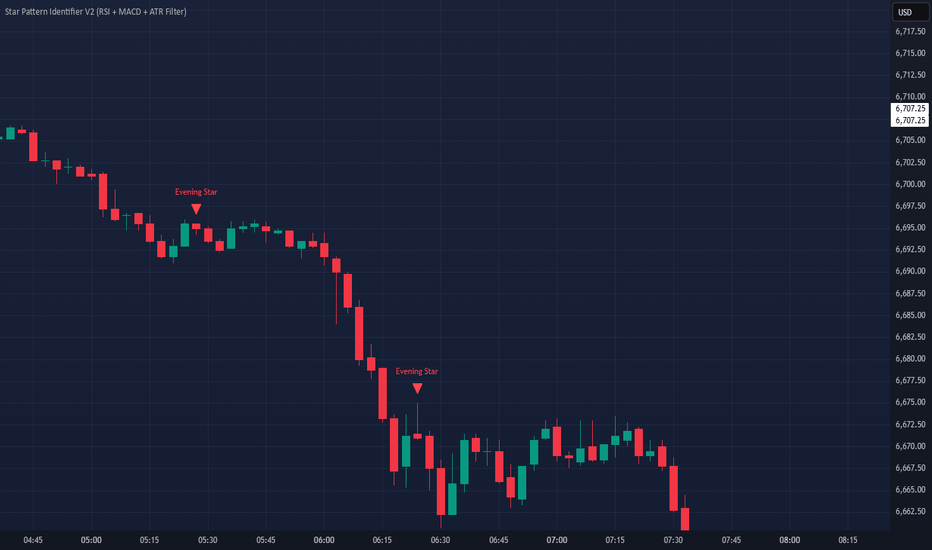
Morning Star, Morning Doji Star, Evening Star, and Evening Doji Star patterns are detected using strict 3-candle criteria. The first candle must be a strong directional bar with a body filling at least 50% of its range. The middle candle — the star — must have a body of 25% or less of its range and a total range smaller than 80% of the first candle's body. The confirmation candle must be directionally opposite to the first candle with a body filling at least 40% of its range, closing past the midpoint of the first candle's body.
Additionally, a Fair Value Gap check is applied to the candle immediately before the star. A bearish FVG exists when the high of bar N is below the low of bar N+2, creating a downward price gap. A bullish FVG exists when the low of bar N is above the high of bar N+2, creating an upward price gap. An Inverse FVG check scans back 45 bars for a prior FVG zone whose price range overlaps with the pre-star candle, indicating price has returned to fill an old imbalance. If neither an FVG nor an IFVG is present on the candle before the star, the pattern does not fire regardless of candle structure. This ensures every star signal is anchored to a real price imbalance.
How to Use It
The highest probability setups occur when the supertrend line has already established direction, the range detector is not showing an active chop zone, and a signal fires with volume and HTF agreement. The Range Breaker lines are a caution flag — while they are active and unbroken, the supertrend will produce lower quality signals due to market compression. The star patterns provide a precision entry trigger that can be used to time entries at reversal points, particularly when a star fires near an active Range High or Range Low level.
Trend continuation
Wait for a pullback toward the supertrend line, then enter when the next Buy or Sell label prints in the direction of the established trend.
Breakout entries
When a range zone has been active for several bars and the supertrend is already pointing in one direction, a range breakout marker firing in that same direction is a high-quality entry trigger.
Star entries
A star pattern firing at or near a Range High or Range Low, with the supertrend already in agreement, represents the highest confluence setup available in the indicator.
What to avoid
Do not enter trend signals while a range zone is active with no breakout. Do not take signals that contradict the HTF EMA. Do not enter late into an extended trend where price is far from the supertrend line.
Settings
ATR Length and Multiplier auto-scale by timeframe but can be manually overridden. Volume threshold multiplier defaults to 1.2× the 20-bar average. RSI overbought and oversold levels default to 70 and 30. Range sensitivity has three modes controlling lookback period, compression ratio, and minimum bar count. Past zones to display defaults to 5, maximum 20.
Penunjuk

Penunjuk
Penunjuk

Morning & Evening Star [TradingFinder] Stock Indices Gap Candle🔵 Introduction
In "technical analysis", there are certain reversal patterns that alert us to a potential reversal of a stock's previous trajectory.
Two significant patterns in this regard are the "Morning Star" pattern and the "Evening Star" pattern, which are formed by a combination of three different candlesticks and are considered as reversal patterns.
Here, we will examine how to identify these patterns and how to respond to them.
🟣 Morning Star Pattern
This pattern forms at the end of a downtrend and indicates the beginning of an uptrend.
The pattern consists of three candlesticks in the following order :
1.A large bearish candlestick
2.A candlestick with a short body
3.A bullish candlestick
With the formation of the morning star pattern, it is expected that the stock price will change direction and continue to rise. Therefore, in such situations, it is advisable to enter a long position and follow the uptrend.
Signs of the morning star pattern :
•The first sign of this pattern is the presence of a small-bodied candlestick at the end of the trend, accompanied by a gap from the previous candlestick (a bearish candlestick with a large body). Therefore, the bodies of the first and second candlesticks do not overlap.
•The second candlestick indicates market confusion and uncertainty. The color of the middle candlestick is not significant.
•The third candlestick must be positive and have a higher price than the previous candlestick (i.e., the small-bodied candlestick).
•The closing price of the third candlestick must be higher than half of the first candlestick.
🟣 Evening Star Pattern
This pattern forms at the end of an uptrend and indicates the beginning of a downtrend.
The pattern consists of three candlesticks in the following order :
1.A large bullish candlestick
2.A candlestick with a short body
3.A bearish candlestick
With the formation of the evening star pattern, it is expected that the stock price will change direction and continue to fall. Therefore, in such situations where this pattern is identified, it is advisable to refrain from entering a long position.
If the stock is traded in a two-way market, it is possible to profit by taking a short position after the formation of the evening star pattern.
Signs of the evening star pattern :
•The first sign of this pattern is the presence of a small-bodied candlestick at the end of the trend, accompanied by a gap from the previous candlestick (a bullish candlestick with a large body). Therefore, the bodies of the first and second candlesticks do not overlap.
•The second candlestick indicates market confusion and uncertainty. The color of the middle candlestick is not significant.
•The third candlestick must be negative and have a lower price than the previous candlestick (i.e., the small-bodied candlestick).
•The closing price of the third candlestick must be lower than half of the first candlestick.
🔵 How to Use
The "Filter" and "Market" features are available in the settings section, allowing you to customize the output of the indicator according to your needs.
With the "Filter" feature, you can filter the "Morning Star" and "Evening Star" patterns as "strong" or "weak." The difference between strong and weak patterns lies in their "Candle Body."
In strong patterns, the candle bodies account for more than 80% of the total candle range, while in weak patterns, the bodies comprise between 60% to 80% of the candle range.
If the "Filter" feature is set to "On," only strong patterns will be displayed. If it's set to "Off," all patterns will be displayed. By default, it's set to "Off."
The "Market" feature allows you to include "gaps" in your pattern identification calculations. You can choose between "Forex" and "Stock" modes. In the Forex pattern, calculations are performed without considering gaps since there are fewer gaps in the Forex market.
If gap calculations were to be part of the pattern identification conditions, only a very small number of patterns would be identified. However, in the "Stock" mode, gaps are considered as part of the identification conditions.
Penunjuk

Penunjuk

Penunjuk

Penunjuk
Penunjuk

Penunjuk
Penunjuk