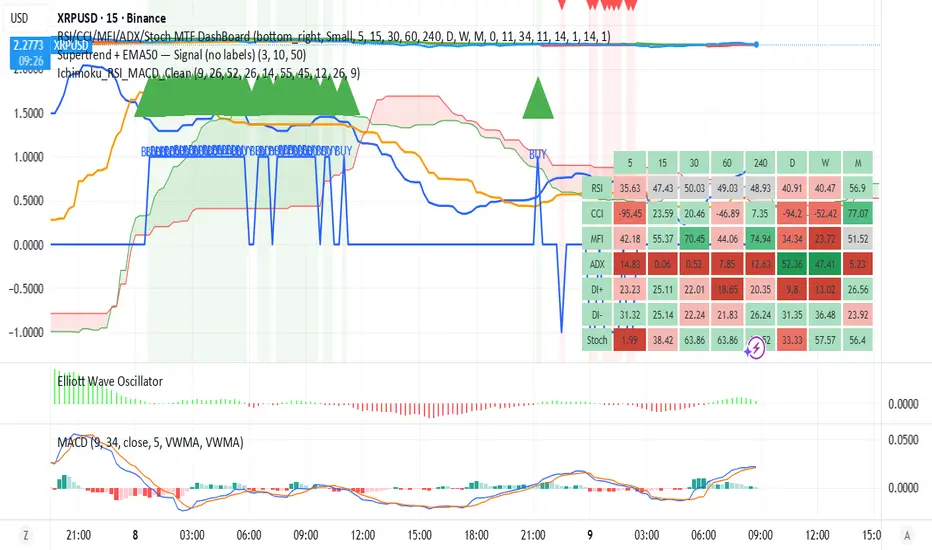
Ichimoku_RSI_MACD_CleanIchimoku + RSI + MACD indicator. It combines these three indicators. It tells whether the trend is bullish or bearish. Multi-timeframe.Penunjukoleh chpol15
Pulse RSI | Lyro RSPulse RSI | Lyro RS The Pulse RSI is a momentum oscillator that enhances the traditional RSI by incorporating volume-weighted price and linear regression. It generates multiple trading signals, including trend shifts, overbought/oversold conditions, and custom threshold levels. By integrating both price and volume into its calculation, Pulse RSI is more robust and responsive than the standard RSI. This helps you identify trends faster, spot potential reversals sooner, and set up custom alerts Penunjukoleh LyroRS2415
RSI(Min-Max)RSI (Min-Max) is an enhanced version of Welles Wilder's Relative Strength Index, designed to offer greater analytical precision and dynamic insight into the behavior of the RSI within each candlestick.In addition to displaying the traditional RSI value, this script calculates the possible extreme values — the minimum and maximum RSI — based on the low and high prices of the current candle. This allows you to estimate how the RSI would react if the price moved to the extremes of the bar, providinPenunjukoleh btdqdqwstrc11
ADX Trend Strength Filter + TRAMA [DotGain]Summary Are you tired of trading trend signals, only to get stopped out in volatile, sideways chop? The ADX Trend Strength Filter (ADX TSF) is designed to solve this exact problem. It is a comprehensive trend-following system that only generates signals when a trend not only has the right direction and momentum, but also sufficient strength. This indicator filters out weak or indecisive market phases (the "chop") and will only color the bars Green or Red when all conditions for a strong, confPenunjukoleh DotGain1182
RSI + MACD Multi-Timeframe StrategyThis strategy combines the Relative Strength Index (RSI) from the daily timeframe with the Moving Average Convergence Divergence (MACD) from the 4-hour timeframe to generate precise long entry and exit signals. The system uses a multi-timeframe approach to align longer-term trend conditions with shorter-term momentum shifts — allowing traders to catch dips with confirmation and exit before reversals. 🧠 Strategy Logic ✅ Long Entry Condition: - RSI on the daily (1D) timeframe is oversold (belStrategioleh RWCS_LTD2632
SamRSIIts multiple timeframe RSI indicator Second RSI indicator can be enabled or disabled up on the necessity Second RSI indicator has the ability to set to a different timeframe Perfect for all types of trade (Intraday, Positional, Short term and Long term) Penunjukoleh midivelliTelah dikemas kini 13
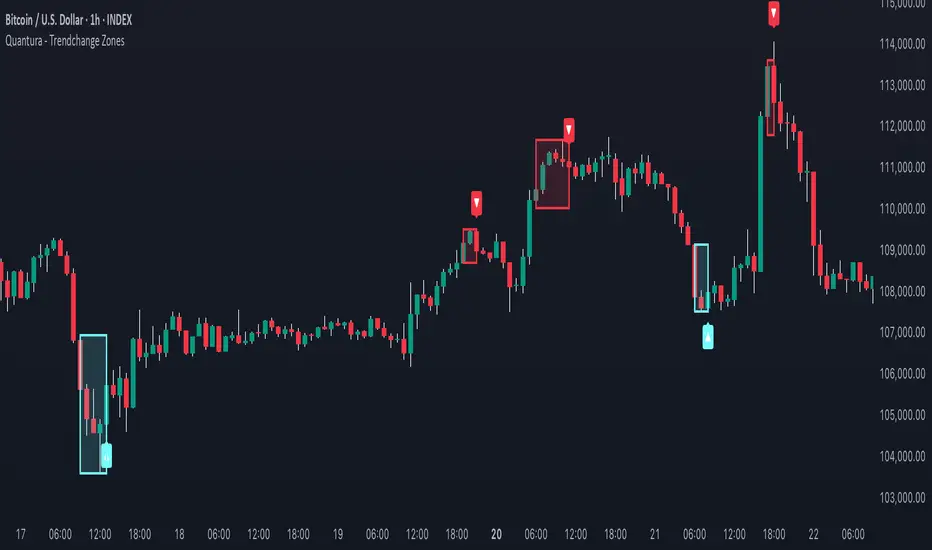
Quantura - Trendchange ZonesIntroduction “Quantura – Trendchange Zones” is an advanced technical indicator that identifies and visualizes potential market reversal zones using dynamic RSI-based logic. It highlights areas of overbought and oversold conditions, marking them as visual zones directly on the price chart, and generates corresponding bullish and bearish signals when the RSI exits these extremes. The tool helps traders anticipate possible trend change regions and confirm momentum shifts in a clean, intuitive way.Penunjukoleh Quantura3920
RSI - Ostinato TradingRSI indicator for Ostinato Trading scalping strategy. The classic RSI with special color fills for extremum detection.Penunjukoleh Ostinato_trader17
KD-NewAutoTrade for Future Trading - Heikin Ashi candles The KD-NewAutoTrade strategy is a dynamic trend-following indicator designed for scalping and swing trading across crypto, forex, and index futures. It combines the precision of EMA crossovers, RSI momentum, and ADX trend strength to deliver clear Buy/Sell signals with high reliability. 🔹 Core Logic EMA Fast & Slow Crossover – Identifies short-term and long-term trend shifts. RSI Confirmation – Filters out false signals by requiring RSI to cross custom Buy/Sell thresholds. ADX Filter – EnsurPenunjukoleh krish16887124
Liquidity & Momentum Master (LMM)💎 Liquidity & Momentum Master (LMM) A professional dual-system indicator that combines: 📦 High-Volume Support/Resistance Zones and 📊 RSI + Bollinger Band Combo Signals — to visualize both smart money footprints and momentum reversals in one clean tool. 🧱 1. High-Volume Liquidity Zones (Support/Resistance Boxes) Conditions Visible only on 1H and higher timeframes (1H, 4H, 1D, etc.) Detects candles with abnormally high volume and strong ATR-based range Separates bullish (support) and bearishPenunjukoleh HSeungpyo110
Tristan's Tri-band StrategyTristan's Tri-band Strategy - Confluence Trading System Strategy Overview: This strategy combines three powerful technical indicators - RSI, Williams %R, and Bollinger Bands - into a single visual trading system. Instead of cluttering your chart with separate indicator panels, all signals are displayed directly on the price chart using color-coded gradient overlays, making it easy to spot high-probability trade setups at a glance. How It Works: The strategy identifies trading opportunitiStrategioleh OhRayOhRay59
RSI Exit + BB-RSI Combo📊 RSI Exit + BB-RSI Combo Indicator This indicator combines RSI overbought/oversold exit signals with Bollinger Band re-entry conditions to highlight potential reversal or retracement zones. 1️⃣ RSI Exit Signal - When RSI drops below 70 after being overbought → 🔴 "RSI" label - When RSI rises above 30 after being oversold → 🟢 "RSI" label - Works on 15m / 30m / 1h / 4h / 1D timeframes 2️⃣ BB-RSI Combo Signal - When an RSI divergence forms and - The candle body re-entePenunjukoleh HSeungpyo99
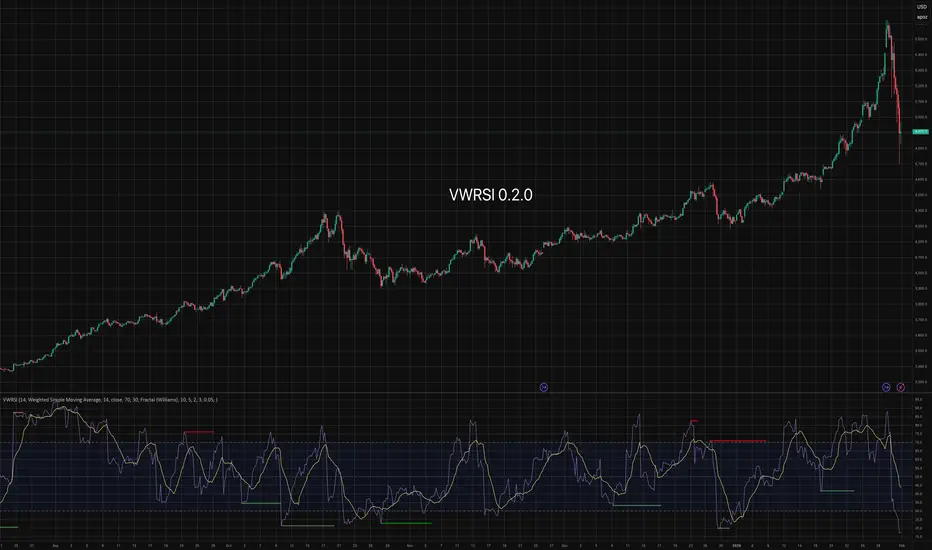
Volume Weighted Relative Strength IndexThis indicator calculates the Relative Strength Index (RSI) and enhances it with optional volume weighting (VWRSI). It also includes a customizable signal line and a built-in divergence detection engine. Key Features: Volume-Weighted Calculation: An option (Volume weighted) allows for volume to be incorporated into the calculation of both the RSI itself and its moving average signal line, making the oscillator more sensitive to high-volume price changes. Customizable Signal Line: Includes an Penunjukoleh AustrianTradingMachineTelah dikemas kini 60
v2.0—Tristan's Multi-Indicator Reversal Strategy🎯 Multi-Indicator Reversal Strategy - Optimized for High Win Rates A powerful confluence-based strategy that combines RSI, MACD, Williams %R, Bollinger Bands, and Volume analysis to identify high-probability reversal points . Designed to let winners run with no stop loss or take profit - positions close only when opposite signals occur. Also, the 3 hour timeframe works VERY well—just a lot less trades. 📈 Proven Performance This strategy has been backtested and optimized on multiple blue-chiStrategioleh OhRayOhRayTelah dikemas kini 4914
GTI BGTI: RSI Suite (Standard • Stochastic • Smoothed) A three-layer momentum and trend toolkit that combines Standard RSI, Stochastic RSI, and a Smoothed/“Macro” RSI to help you read intraday swings, trend transitions, and high-probability reversal/continuation spots. All in one pane with intuitive coloring and optional divergence markers and alerts. Why this works * Stochastic RSI (K/D) visualizes fast momentum swings and timing. * Standard RSI moves more gradually, helping confirm trend transitiPenunjukoleh theValleyMan5260
RSI + MFIRSI and MFI combined, width gradient fields if OS or OB, shows divergences separate for wicks and bodies, shows dots when mfi and rsi oversold at the same time. Penunjukoleh wilinskilukasz88
RSI + Elder Bull-Bear pressure RSI + Bull/Bear (Elder-Ray enhanced RSI) What it is An extended RSI that overlays Elder-Ray Bull/Bear Power on the same, zero-centered scale. You get classic RSI regime cues plus a live read of buy/sell pressure, with optional smoothing, bands, and right-edge value labels. Key features RSI with bands – default bands 30 / 50 / 70 (editable). Bull/Bear Power (Elder) – ATR-normalized; optional EMA/SMA/RMA/HMA smoothing. One-pane overlay – RSI and Bull/Bear share a common midline (RSI-50 ↔ Penunjukoleh PDK197748
RSI Trendline Pro - Multi Confirmation Overview RSI Trendline Pro is an advanced Pine Script indicator that automatically draws trendlines on the RSI (Relative Strength Index) to detect support and resistance breakouts. It generates high-quality trading signals through a multi-confirmation system. Key Features Auto Trendlines: Detects pivot points on RSI to create intelligent support and resistance lines Multi-Confirmation System: Combines Volume, Stochastic RSI, ADX, and Divergence filters to reduce false signals RSI DivergenPenunjukoleh last_satoshi49
Mean Reversion Trading V1Overview This is a simple mean reversion strategy that combines RSI, Keltner Channels, and MACD Histograms to predict reversals. Current parameters were optimized for NASDAQ 15M and performance varies depending on asset. The strategy can be optimized for specific asset and timeframe. How it works Long Entry (All must be true): 1. RSI < Lower Threshold 2. Close < Lower KC Band 3. MACD Histogram > 0 and rising 4. No open trades Short Entry (All must be true): 1. RSI > Upper ThresholdStrategioleh Sivchay102
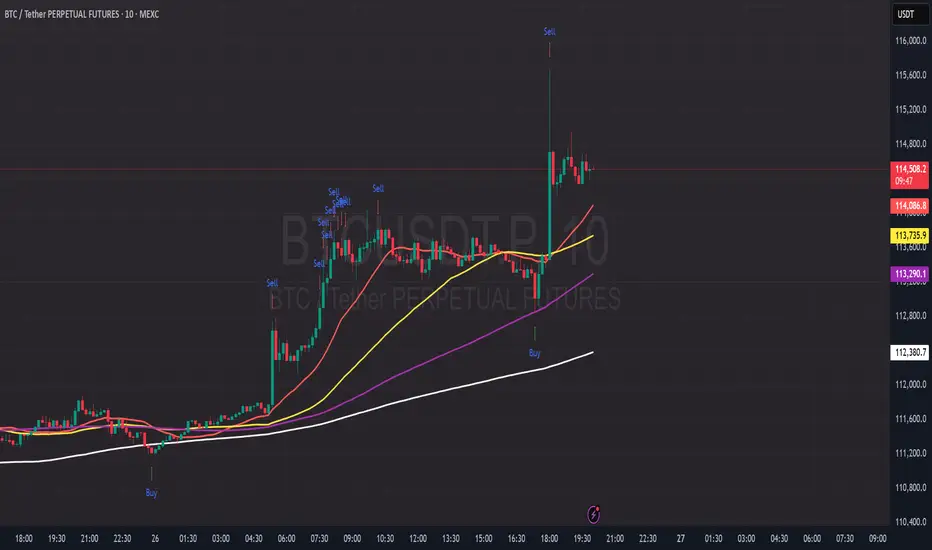
PDB - RSI Based Buy/Sell signals with 4 MARSI Based Buy/Sell Signals on Price chart + 4 MA System This indicator plots RSI-based Buy & Sell signals directly on the price chart , combined with a 4-Moving-Average trend filter (20/50/100/200) for higher accuracy and cleaner trade timing. The signal triggers when RSI reaches user-defined overbought/oversold levels, but unlike a standard RSI, this version plots the signals **on the chart**, not in the RSI window — making entries and exits easier to see in real time. RSI Levels Are FullPenunjukoleh PrintDemBandz145
Liquidity Grab + RSI Divergence═══════════════════════════════════════════════════════════════ LIQUIDITY GRAB + RSI DIVERGENCE INDICATOR ═══════════════════════════════════════════════════════════════ 📌 OVERVIEW This indicator identifies high-probability reversals by combining: • Liquidity sweeps (stop hunts) • RSI divergence confirmation • Filters false breakouts automatically ═══════════════════════════════════════════════════════════════ 🟢 BUY SIGNAL (Green Triangle Up) REQUIRES BOTH CONDITIONS: 1. Liquidity GraPenunjukoleh hassanejaz1132
Reverse RSI LevelsSimple reverse RSI calculation As default RSI values 30-50-70 are calculated into price. This can be used similar to a bollinger band, but has also multiple other uses. 70 RSI works as overbought/resistance level. 50 RSI works as both support and resistance depending on the trend. 30 RSI works as oversold/support level. Keep in mind that RSI levels can go extreme, specially in Crypto. I haven't made it possible to adjust the default levels, but I've added 4 more calculations where you can ploPenunjukoleh GizmoTheInvestor232
Dual Table Dashboard - Correct V3add RSI Data## 📈 Trading Applications ### 1. Trend Following Strategy ``` 1. Check TABLE 1 for trend direction (AnEMA29 + PDMDR) 2. If both green → Look for longs 3. If both red → Look for shorts 4. Use TABLE 2 for entry levels ``` ### 2. Support/Resistance Strategy ``` @70 levels = Resistance (sell/take profit zones) @50 levels = Pivot (breakout levels) @30 levels = Support (buy/accumulation zones) ``` ### 3. Multi-Timeframe Alignment ``` W_RSI → Weekly bias (long-term) D_RSI → Daily bias (mPenunjukoleh insomniac_vampireTelah dikemas kini 135
RSI FlipIndicator Description: RSI Flip (30/70 Threshold) This indicator uses a 7-period Relative Strength Index (RSI) to detect potential market reversals based on classic momentum thresholds: - RSI < 30 → triggers a Long Deal Signal (1) indicating potential bullish reversal. - RSI > 70 → triggers a Short Deal Signal (2) indicating potential bearish reversal. 🔧 Features: - Backtest-compatible output: Hidden plots emit 1 for long and 2 for short, enabling seamless integration with strategy scripts. - BPenunjukoleh mnmedipa9