Penunjuk

Zone Moving Average Color Direction Detection This indicator generates a zone for a moving average by means of the high and low source of the same average, the moving average should be worked as zones not as a line, by default a simple average of 200 periods is configured, the indicator has direction detection and represents it by the green and red colors, it also has padding with the same characteristic, it is possible to configure the following:
- Type: SMA, EMA, WMA, VWMA, SMMA, DEMA, THEME, HULLMA, ZEMA, TMA, SSMA
- Period / Length
- Source
- Color Direction Detection
Release Notes: Add a field to change the reaction in the change of color and direction of the Media, set to 1 is the fastest, a larger number filters the address better but is slower, 3 is set by default. Penunjuk

Penunjuk

Penunjuk

Penunjuk
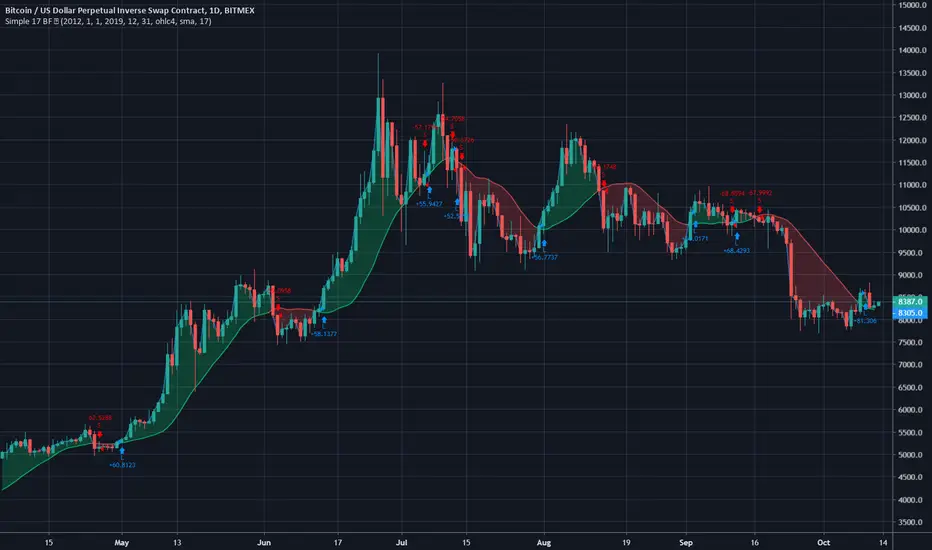
Scripting Tutorial A - TManyMA - StopsThis script is for a triple moving average strategy where the user can select from different types of moving averages, price sources, lookback periods and resolutions.
Features:
- 3 Moving Averages with variable MA types, periods, price sources, resolutions and the ability to disable each individually.
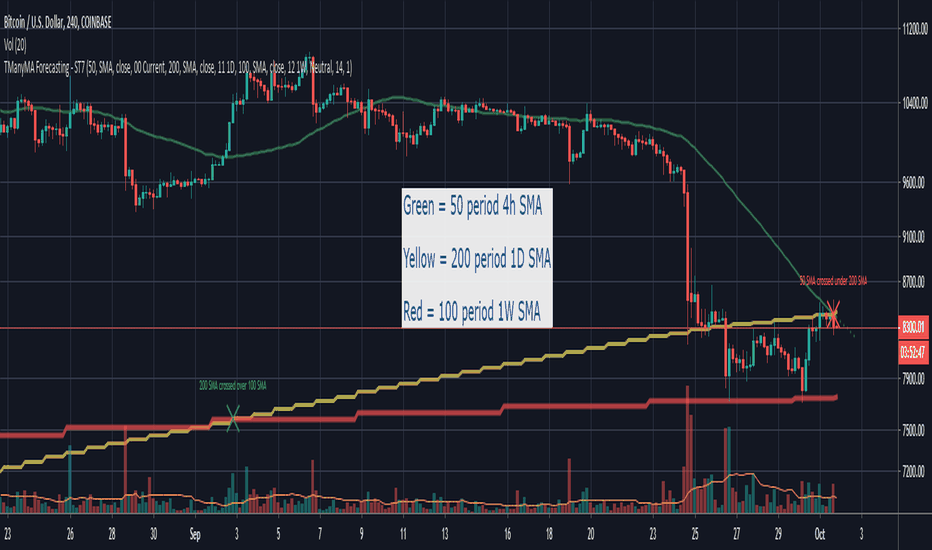
- Crossovers are plotted on the chart with detailed information regarding the crossover (Ex: 50 SMA crossed over 200 SMA )
- Forecasting available for all three MAs. MA values are forecasted 5 values out and plotted as if a continuation to the MA.
- Forecast bias also applies to all forecasting. Bias means we can forecast based on an anticipated bullish, bearish or neutral direction in the market.
- To understand bias, please read the source code, or if you can't read the code just send me a message on here or Twitter. Twitter should be linked to my profile.
- Ribbons added and on by default. Optional setting to disable the ribbons. 5 ribbons between MA1 and MA2 and another 5 between MA2 and MA3.
- Ribbons are alpha-color coded based on their relation to their default MAs.
- Ribbons are only visible between MAs if the MAs being compared share the same Type, Resolution, and Source because there is no way to consolidate those three in a simple manner.
- Ribbon values are calculated based on calculated MA Periods between the MAs.
- Converted the existing study into a strategy.
- Strategy only enters long positions with a market order when MA crossovers occur.
- Strategy exits positions when crossunders occur.
- Trades 100% of the equity with one order/position by default.
- Ability to disable trading certain crosses with input checks.
- Ability to exit trades with a take profit or stop loss.
- User input to allow quick changes to the take profit or stop loss percentages.
This script is meant as an educational script with well-formatted styling, and references for specific functions.
*** PLEASE NOTE - THIS STRATEGY IS MEANT FOR LEARNING PURPOSES. DEPENDING ON IT'S CONFIGURATION IT MAY OR MAY NOT BE USEFUL FOR ACTUAL TRADING. THE STRATEGY IS NOT FINANCIAL ADVICE *** Strategi

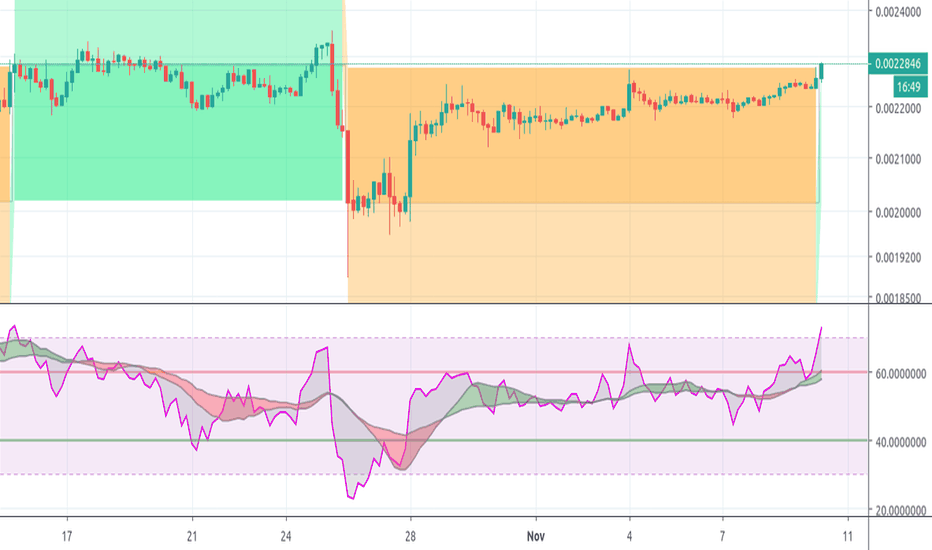
VRSI-MARSI StrategyI wanted to create an indicator which resembles price movement, aside to volume movement.
The "yellow-blue" line is the MA(5) of the RSI (9) of closing price.
The "orange" line is the MA(5) of the RSI (9) of Volume .
(Default plot of RSI and VRSI is not visible but can be made visible ("Settings" > "Style" > set "Opacity" of "RSI & VRSI"))
The Long (Buy) condition is triggered when the MA(5) of the RSI (9, close) goes up.
The Short (Sell) condition is triggered when the MA(5) of the RSI (9, close) goes down.
Comparing the price movement with the "orange" Volume line helps to spot a possible trend change,
for example when price goes up and an ascending Volume line starts to flatten or starts descending,
this could be a sign that the Bullish trend is weakening, predicting a possible trend change.
Or, when for example a downwards price movement is accompanied with a rising Volume line, this can be a sign of large Bearish power.
Because it still is a RSI indicator, the midline (50), and Oversold/Overbought area's (20-30 & 70-80) are important to watch, especially the MARSI!
A second strategy is made (VRSI-MARSI Strategy 2) where the Long/Short condition is triggered when "MA RSI (close) - MA RSI ( Volume )" crosses.
-------------------------------------------------------------------------------------------------------------------------------------------------------------------------
The Long & Short entries, as well as the Entry Close are visible 1 bar after the trigger.
When the blue line changes in a yellow line (and vice versa) it will show a candle earlier (see yellow dashed lines = (1)).
Also, the condition is fulfilled when the candle closes (2), but the order doesn't take place in the same bar, but the next (3).
Because this is a strategy the "actual Order" will not take place at the "Close" of the candle (2), but at the "Open" at the NEXT candle (3).
I also have this strategy as a study (A+B), where the "Buy" & "Sell" shows a candle earlier.
-------------------------------------------------------------------------------------------------------------------------------------------------------------------------
The entries are default 5% of equity, without pyramiding, which already gives large profits.
A large part of the profit is because of the Entry Close of the Long & Short entries.
You can easily turn these off (Settings > Inputs) to see what profit the strategy gives without Entry Close.
Here they are disabled:
-------------------------------------------------------------------------------------------------------------------------------------------------------------------------
More information available in the script ;-)
Strategi

Penunjuk

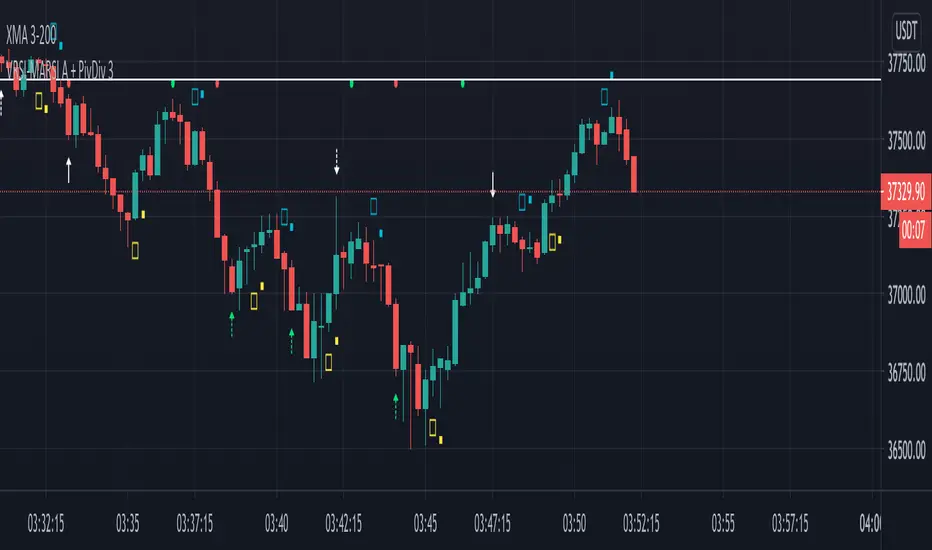
VRSI-MARSI AI wanted to create an indicator which resembles price movement, aside to volume movement.
MARSI (= MA RSI(close)) = "yellow-blue" line which is the MA(5) of the RSI (9) of closing price.
VRSI (= MA RSI(Volume)) = "orange" line which is the MA(5) of the RSI (9) of Volume .
(Default plot of RSI and VRSI is not visible but can be made visible ("Settings" > "Style" > set "Opacity" of "RSI & VRSI"))
Because it still is a RSI indicator, the midline (50), and Oversold/Overbought area's (20-30 & 70-80) are important to watch, especially the MARSI!
Comparing the price movement with the "orange" Volume VRSI line helps to spot a possible trend change,
for example when price goes up and an ascending Volume VRSI line starts to flatten or starts descending,
this could be a sign that the Bullish trend is weakening, predicting a possible trend change.
Or, when for example a downwards price movement is accompanied with a rising Volume VRSI line, this can be a sign of large Bearish power.
This study comes with Bollinger Bands as an assisting tool, it is default made not visible but can be made visible
("settings" > "style" > Set "Opacity" of "basis, upper & lower")
You can see where the MARSI ("yellow-blue" line) crosses the "basis", or bounces off the bands, ...
All this is seen in "VRSI-MARSI B"
"VRSI-MARSI A" contains the alerts:
1) Long/Short = "Triangle UP/DOWN", color: lime/red
Condition: Movement of MA(5) of RSI (9) of price (close )
2) Long2/Short2 = ">", color: lime/red
Condition: Long/Short condition is true for 2 or more bars (= continuation)
3) Long3/Short3 = "•", color: lime/red
Condition: MA RSI (Close) crosses MA RSI ( Volume )
1 or more alerts can easily be disabled if desired (settings > inputs)
Thanks!
-------------------------------------------------------------------------------------------------------------------------------------------------------------------------
More information available in the script ;-) Penunjuk
VRSI-MARSI BI wanted to create an indicator which resembles price movement, aside to volume movement.
MARSI (= MA RSI(close)) = "yellow-blue" line which is the MA(5) of the RSI (9) of closing price.
VRSI (= MA RSI(Volume)) = "orange" line which is the MA(5) of the RSI (9) of Volume .
(Default plot of RSI and VRSI is not visible but can be made visible ("Settings" > "Style" > set "Opacity" of "RSI & VRSI"))
Because it still is a RSI indicator, the midline (50), and Oversold/Overbought area's (20-30 & 70-80) are important to watch, especially the MARSI!
Comparing the price movement with the "orange" Volume VRSI line helps to spot a possible trend change,
for example when price goes up and an ascending Volume VRSI line starts to flatten or starts descending,
this could be a sign that the Bullish trend is weakening, predicting a possible trend change.
Or, when for example a downwards price movement is accompanied with a rising Volume VRSI line, this can be a sign of large Bearish power.
This study comes with Bollinger Bands as an assisting tool, it is default made not visible but can be made visible
("settings" > "style" > Set "Opacity" of "basis, upper & lower")
You can see where the MARSI ("yellow-blue" line) crosses the "basis", or bounces off the bands, ...
All this is seen in "VRSI-MARSI B"
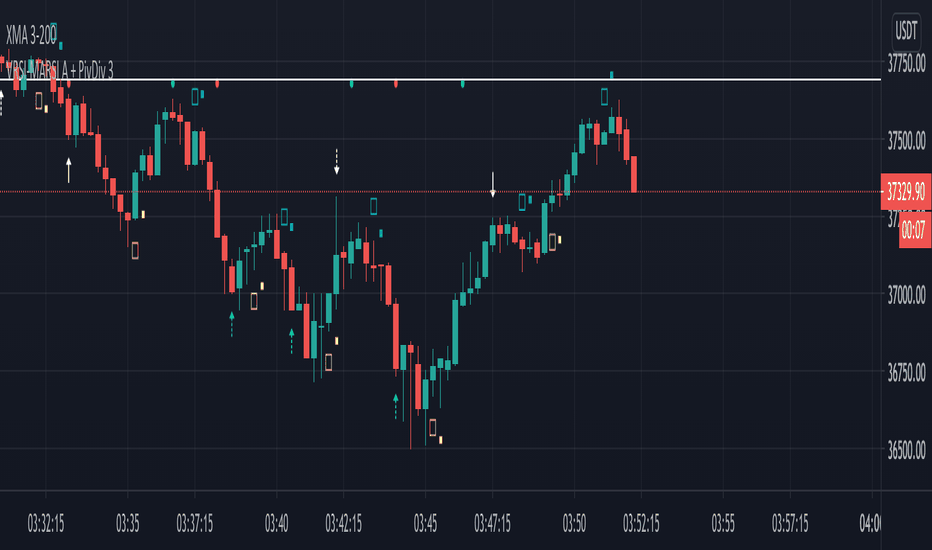
"VRSI-MARSI A" contains the alerts:
1) Long/Short = "Triangle UP/DOWN", color: lime/red
Condition: Movement of MA(5) of RSI (9) of price (close )
2) Long2/Short2 = ">", color: lime/red
Condition: Long/Short condition is true for 2 or more bars (= continuation)
3) Long3/Short3 = "•", color: lime/red
Condition: MA RSI (Close) crosses MA RSI ( Volume )
1 or more alerts can easily be disabled if desired (settings > inputs)
Thanks!
-------------------------------------------------------------------------------------------------------------------------------------------------------------------------
More information available in the script ;-) Penunjuk

Penunjuk
Penunjuk

Strategi

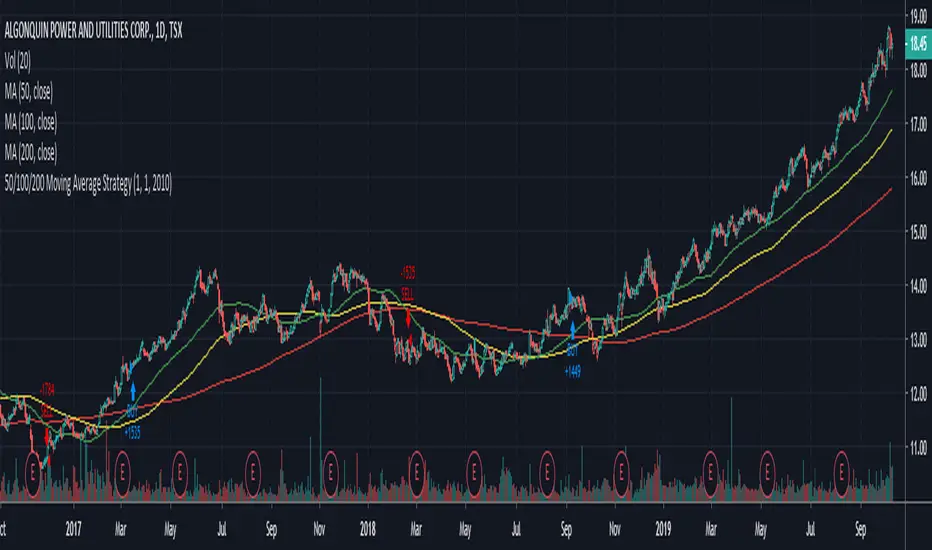
Scripting Tutorial 9 - TManyMA Strategy - Long Market Order OnlyThis script is for a triple moving average strategy where the user can select from different types of moving averages, price sources, lookback periods and resolutions.
Features:
- 3 Moving Averages with variable MA types, periods, price sources, resolutions and the ability to disable each individually
- Crossovers are plotted on the chart with detailed information regarding the crossover (Ex: 50 SMA crossed over 200 SMA )
- Forecasting available for all three MAs. MA values are forecasted 5 values out and plotted as if a continuation to the MA.
- Forecast bias also applies to all forecasting. Bias means we can forecast based on an anticipated bullish, bearish or neutral direction in the market.
- To understand bias, please read the source code, or if you can't read the code just send me a message on here or Twitter. Twitter should be linked to my profile.
- Ribbons added and on by default. Optional setting to disable the ribbons. 5 ribbons between MA1 and MA2 and another 5 between MA2 and MA3.
- Ribbons are alpha-color coded based on their relation to their default MAs.
- Ribbons are only visible between MAs if the MAs being compared share the same Type, Resolution, and Source because there is no way to consolidate those three in a simple manner.
- Ribbon values are calculated based on calculated MA Periods between the MAs.
- Converted the existing study into a strategy
- Strategy only enters long positions with a market order when MA crossovers occur
- Strategy exits positions when crossunders occur
- Trades 100% of the equity with one order/position by default
- Ability to disable trading certain crosses with input checks
This script is meant as an educational script with well-formatted styling, and references for specific functions.
*** PLEASE NOTE - THIS STRATEGY IS MEANT FOR LEARNING PURPOSES. DEPENDING ON IT'S CONFIGURATION IT MAY OR MAY NOT BE USEFUL FOR ACTUAL TRADING. THE STRATEGY IS NOT FINANCIAL ADVICE *** Strategi

Penunjuk

Scripting Tutorial 8 - Triple Many Moving Averages RibbonsThis script is for a triple moving average indicator where the user can select from different types of moving averages, price sources, lookback periods and resolutions.
Features:
- 3 Moving Averages with variable MA types, periods, price sources, resolutions and the ability to disable each individually
- Crossovers are plotted on the chart with detailed information regarding the crossover (Ex: 50 SMA crossed over 200 SMA )
- Forecasting available for all three MAs. MA values are forecasted 5 values out and plotted as if a continuation to the MA.
- Forecast bias also applies to all forecasting. Bias means we can forecast based on an anticipated bullish, bearish or neutral direction in the market.
- To understand bias, please read the source code, or if you can't read the code just send me a message on here or Twitter. Twitter should be linked to my profile.
- Ribbons added and on by default. Optional setting to disable the ribbons. 5 ribbons between MA1 and MA2 and another 5 between MA2 and MA3.
- Ribbons are alpha-color coded based on their relation to their default MAs.
- Ribbons are only visible between MAs if the MAs being compared share the same Type, Resolution, and Source because there is no way to consolidate those three in a simple manner.
- Ribbon values are calculated based on calculated MA Periods between the MAs.
This script is meant as an educational script with well-formatted styling, and references for specific functions. Penunjuk

Strategi

Strategi

Penunjuk
Penunjuk
Strategi

Penunjuk
Penunjuk