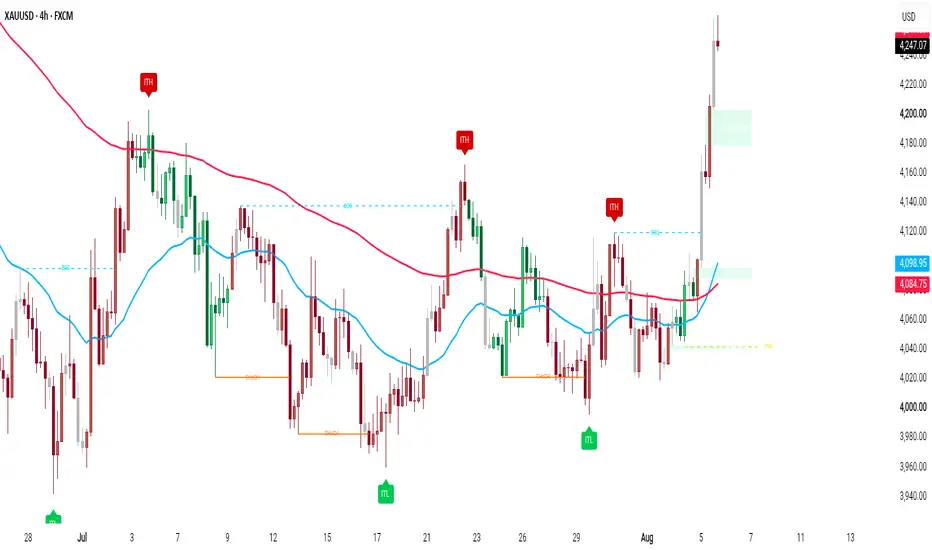
Williams %R Ribbon
Williams %R Ribbon
Most traders know Williams %R as a classic overbought/oversold oscillator. Unfortunately, many stop there.
The Williams %R Ribbon reimagines this well-known indicator into a modern visualization designed to make momentum, trend transitions, and market extension easier to read at a glance. Instead of focusing solely on fixed overbought and oversold levels, this indicator emphasizes the relationship between Williams %R and its signal line, transforming that relationship into an intuitive gradient ribbon that helps reveal changes in market structure before they become obvious.
Features
Momentum Ribbon
The traditional Williams %R line is transformed into a dynamic ribbon that expands, contracts, and changes color based on the relationship between Williams %R and its signal line.
Bullish momentum is displayed with a green ribbon.
Bearish momentum is displayed with a red ribbon.
Neutral conditions automatically fade to gray when momentum becomes indecisive.
The ribbon allows traders to recognize momentum shifts without constantly watching for line crossovers.
Multi-Timeframe Analysis
Analyze higher timeframe Williams %R values directly on lower timeframe charts.
Choose from:
Chart Timeframe
2× Chart Timeframe
4× Chart Timeframe
Manual Timeframe Selection
This makes it possible to monitor higher-timeframe momentum while executing trades on lower timeframes without adding multiple indicators to the chart.
Optional Display Smoothing
The ribbon includes display-only smoothing designed to reduce visual stair-stepping that naturally occurs when displaying higher timeframe calculations on lower timeframe charts.
Importantly:
Indicator calculations remain unchanged.
Signal generation remains unchanged.
Alerts continue using the original data.
Only the visual appearance of the ribbon is smoothed.
Extension Grade
Instead of simply identifying whether Williams %R is overbought or oversold, the indicator continuously classifies the current level into extension categories such as:
Moderately Extended
Extended
Very Extended
Extremely Extended
This provides additional context regarding how far price has stretched relative to its recent trading range.
Flexible Display Modes
Choose the visualization that best fits your trading style.
Available display modes include:
Ribbon
Signal Line Only
Solid Signal Line Only
Ribbon + Signal Line
Whether you prefer a clean minimalist chart or a full ribbon visualization, the indicator adapts to your workflow.
Dynamic Coloring
The ribbon automatically adjusts its colors based on current market conditions.
Strong bullish momentum receives brighter bullish colors.
Strong bearish momentum receives brighter bearish colors.
Neutral conditions fade naturally, helping reduce visual noise during consolidation.
Built-In Alerts
Alerts are included for:
Bullish ribbon crosses
Bearish ribbon crosses
Oversold exits
Overbought exits
All Extension Grade thresholds
Because alerts use the original unsmoothed Williams %R values, visual smoothing never delays signal generation.
Designed for Clarity
Many oscillators overwhelm traders with unnecessary visual clutter.
The goal of this indicator is the opposite.
Every design decision was made with one objective:
Help traders understand what the oscillator is communicating as quickly as possible.
The gradient ribbon allows momentum, trend direction, and market extension to be interpreted almost instantly while maintaining the familiar foundation of the classic Williams %R.
Best Used For
Trend confirmation
Multi-timeframe analysis
Momentum analysis
Mean reversion strategies
Swing trading
Identifying overextended markets
Building rule-based trading systems
Disclaimer
This indicator is provided for educational and informational purposes only. It does not constitute financial, investment, legal, or tax advice and should not be considered a recommendation to buy or sell any financial instrument.
No indicator can predict future market movements or guarantee profitable results. Market conditions change continuously, and all trading involves risk, including the potential loss of all invested capital.
Past performance does not guarantee future results. Always perform your own analysis, practice sound risk management, and consult a qualified financial professional if you require investment advice. Penunjuk

ICT Dynamic Entry Model & Structure Matrix PROICT Dynamic Entry Model & Structure Matrix PRO
ICT Dynamic Entry Model & Structure Matrix PRO is a clean, professional institutional charting script designed for traders following ICT mentorship principles and Smart Money Concepts. It delivers precise swing anchored market structure lines, dynamic trend candle themes, auto disappearing key levels, and gold highlighted expansion candles.
Key Features Overview
1. Precision Anchored BOS and CHoCH Structure
Market structure lines start exactly from the precise swing high or swing low origin price point. Text labels are positioned cleanly in the middle center of structure lines to avoid overlap with candlesticks.
2. Smart Trend Candle Engine
Driven by Intermediate Term High and Low levels. Once a red ITH prints, subsequent price candles dynamically adopt a solid bearish color scheme. When a green ITL prints, candles automatically convert to a bullish color scheme.
3. Gold Glowing FVG Expansion Candle Highlight
Identifies high momentum Fair Value Gap expansion candles, coloring the specific impulse candle in a distinct glowing gold yellow shade for instant institutional displacement detection.
4. Major ITH and ITL Level Badges
Features solid red Intermediate Term High badges and solid green Intermediate Term Low badges strictly at macro structural extremes.
5. Auto Disappearing Previous Day Boundaries
Tracks active Previous Day High and Previous Day Low boundaries. Daily lines automatically clean up and vanish as soon as price breaks or mitigates the level.
How to Use
Step 1: Identify Macro Shift
Look for green ITL badges for bullish bias or red ITH badges for bearish bias, which automatically adapts your overall candle colors.
Step 2: Monitor Centered Structure Signals
Observe precise dashed Break of Structure lines and solid Change of Character lines anchored directly from swing points with center aligned text.
Step 3: Spot Institutional Displacement
Identify gold glowing expansion candles that signal high volume displacement creating active Fair Value Gaps.
Settings Overview
Moving Average Settings
- Show Dual Moving Averages: Toggle visibility of EMAs.
- Period and Thickness Settings: Customize fast/slow periods and line width.
Market Structure Settings
- Show Precision BOS & CHoCH: Toggle centered structural lines.
- Sensitivity Period: Adjust pivot lookback calculations.
Smart Candle Settings
- Enable Smart Trend & Gold FVG Candles: Toggle dynamic trend colors and gold FVG expansion highlights.
Previous Day High and Low Settings
- Show Active PDH / PDL: Toggle display of auto disappearing daily key levels.
Entry Zone Settings
- Show Active Entry Zones: Toggle entry model rectangles and customize zone display text, text color, and fill opacity.
Disclaimer
This script is created strictly for educational, analytical, and charting enhancement purposes. It does not provide financial advice, trade recommendations, or guaranteed results. Always practice proper risk management.
Penunjuk

Hunter OCI All SessionHunter OCI All Session
Overview
Hunter OCI All Session is an intraday technical analysis indicator designed to organize session-based price action within a unified analytical framework.
The indicator uses the Opening Range (OR) as the primary structural reference for the trading session. From this common foundation, it derives directional analysis, dynamic projection levels, adaptive support and resistance, analytical states, and session information.
Rather than generating automated trading decisions, the indicator is intended to assist discretionary technical analysis by presenting session data in a structured and consistent manner.
What's New
This version introduces a redesigned analytical framework centered on configurable trading sessions.
Instead of relying on predefined market sessions, users can define the Opening Range according to the instrument being analyzed while preserving the same analytical methodology.
All major analytical components now reference the same Opening Range throughout the trading session, providing a more consistent analytical structure.
Methodology
The analytical workflow begins with the Opening Range established at the start of the selected trading session.
From this common reference, the indicator:
• Builds the session structure.
• Evaluates directional conditions.
• Calculates dynamic projection levels.
• Updates adaptive support and resistance.
• Organizes the current analytical state.
Every major calculation originates from the same Opening Range foundation, allowing all components to operate within a unified analytical framework.
Main Components
The indicator includes:
• Opening Range structure
• Dynamic projection levels
• Radar directional analysis
• Adaptive support and resistance
• Analytical state classification
• Information panel
• Configurable alerts
• Visual customization options
Each component contributes to the same analytical workflow rather than functioning as an independent indicator.
Customization
Users can configure trading sessions, visual appearance, labels, colors, drawing styles, alerts, and information panel settings to adapt the indicator to different financial markets and personal chart preferences.
Recommended Usage
Hunter OCI All Session is designed primarily for intraday analysis where Opening Range methodology forms part of the trading process.
It is intended to complement discretionary technical analysis and should be used together with price action, market context, and appropriate risk management.
Limitations
The analytical output depends on the selected trading session configuration. Different session definitions may produce different analytical structures.
Like any technical analysis tool, the indicator should be interpreted within the broader context of market conditions rather than in isolation.
Disclaimer
This indicator is provided for analytical and educational purposes.
It is intended to assist users in studying session structure and intraday market behavior and should not be interpreted as financial advice, investment advice, or a guarantee of future market performance.
Trading decisions remain the sole responsibility of the user.
-------------------------------------------------------------------------
Hunter OCI All Session
نبذة عن المؤشر
هو مؤشر للتحليل الفني على الفريمات اللحظية، صُمم لتنظيم حركة السعر أثناء جلسة التداول ضمن إطار تحليلي موحد.
يعتمد المؤشر على نطاق افتتاح الجلسة (Opening Range) باعتباره المرجع الأساسي الذي تُبنى عليه جميع مكوناته، بما في ذلك التحليل الاتجاهي، ومستويات الأهداف الديناميكية، ومستويات الدعم والمقاومة المتغيرة، والحالات التحليلية، ومعلومات الجلسة.
ولا يهدف المؤشر إلى إصدار قرارات تداول آلية، وإنما صُمم لدعم التحليل الفني التقديري من خلال عرض معلومات الجلسة بصورة منظمة ومتسقة.
ما الجديد في هذا الإصدار؟
يقدم هذا الإصدار إطارًا تحليليًا مُعاد تصميمه يعتمد على جلسات تداول قابلة للتخصيص.
وبدلاً من الاعتماد على جلسات ثابتة، يمكن للمستخدم تحديد جلسة التداول المناسبة للأداة المالية محل التحليل مع الحفاظ على نفس المنهجية التحليلية.
كما أصبحت جميع المكونات الرئيسية تعتمد على نفس نطاق افتتاح الجلسة طوال فترة التداول، مما يوفر إطارًا تحليليًا أكثر اتساقًا.
المنهجية
تبدأ جميع الحسابات من نطاق افتتاح الجلسة الذي يتم تحديده عند بداية جلسة التداول المختارة.
وانطلاقًا من هذا المرجع يقوم المؤشر بما يلي:
• بناء الهيكل السعري للجلسة.
• تقييم الحالة الاتجاهية.
• حساب مستويات الأهداف الديناميكية.
• تحديث مستويات الدعم والمقاومة المتغيرة.
• تنظيم الحالة التحليلية الحالية.
وتعتمد جميع المكونات الرئيسية على نفس المرجع البنيوي لضمان عملها ضمن إطار تحليلي موحد.
المكونات الرئيسية
يتضمن المؤشر:
• نطاق افتتاح الجلسة.
• مستويات الأهداف الديناميكية.
• مكون Radar للتحليل الاتجاهي.
• مستويات الدعم والمقاومة المتغيرة.
• الحالات التحليلية.
• لوحة المعلومات.
• التنبيهات القابلة للتخصيص.
• خيارات العرض والإعدادات.
وتعمل جميع هذه المكونات ضمن إطار تحليلي واحد بدلاً من كونها أدوات مستقلة.
خيارات التخصيص
يمكن تخصيص جلسات التداول، والألوان، وأنماط الرسم، والتسميات، والتنبيهات، ولوحة المعلومات، والعناصر المرئية بما يتناسب مع مختلف الأسواق وأساليب العرض.
الاستخدام المقترح
صُمم Hunter OCI All Session أساسًا للتحليل الفني على الفريمات اللحظية التي يعتمد فيها المتداول على منهجية نطاق افتتاح الجلسة.
ويهدف إلى دعم التحليل الفني التقديري، وينبغي استخدامه جنبًا إلى جنب مع حركة السعر، وسياق السوق، وإدارة المخاطر.
ملاحظات
تعتمد نتائج المؤشر على إعدادات جلسة التداول التي يختارها المستخدم، ولذلك قد تختلف البنية التحليلية باختلاف الجلسة المحددة.
وكغيره من أدوات التحليل الفني، ينبغي تفسير مخرجات المؤشر ضمن السياق العام لحركة السوق، وليس بصورة مستقلة.
إخلاء المسؤولية
هذا المؤشر مقدم لأغراض التحليل والتعليم.
وقد صُمم للمساعدة في دراسة هيكل جلسات التداول وسلوك السوق أثناء التداول اللحظي، ولا يُعد نصيحة مالية أو استثمارية، ولا يمثل ضمانًا لأي نتائج مستقبلية.
وتبقى جميع قرارات التداول مسؤولية المستخدم وحده.
Penunjuk

Trend Integrity Oscillator [MQLSoftware]Trend Integrity Oscillator answers one question in a measurable way: is the current pullback a pause inside an intact trend, or the start of a reversal? Instead of pairing two generic oscillators and eyeballing their relationship, it separates the two things that actually diverge in a pullback — trend efficiency and structural integrity — and then measures the outcome of that divergence on the chart's own history.
This is a visual analytical tool for chart study. It does not execute trades and does not provide financial advice.
Key Features
Outcome signals on the price chart: when a pullback resumes, the ▲/▼ marker prints this chart's measured resume rate for that direction; when the structure is closed through, ✕ BREAK prints at the violated anchor
Pullback Survival Zone on the price chart: while a pullback is armed, the pullback territory is shaded and the survival line marks the P75 depth of all pullbacks on this chart that eventually resumed — between that line and the anchor is territory most survivors never visited
Anchor line — the structural pivot whose confirmed close-through turns a pullback into a reversal (frozen at arm time for the live episode)
Trend Efficiency line 0–100 — multiscale signed efficiency computed on three horizons (chart window plus two senior windows equal in wall-clock time to auto-selected higher timeframes), weighted toward the seniors
Structure Integrity area 0–100 — a composite of three confirmed-pivot facts: anchor hold, pivot-chain consistency, and retracement depth ranked against this chart's own resumed pullbacks
Pullback state machine — aligned → pullback armed → resumed / broken, confirmed bars only
Measured base rates in the panel: how often armed pullbacks actually resumed on this chart, per direction, with sample sizes; live pullback depth percentile
Phase lane, pane event marks, optional armed bar-paint and pane tint, five alerts + one dynamic alert
Core Concept — what is original here
1. Multiscale signed efficiency. sER(n) = (close − close ) / path(n): a Kaufman-style efficiency ratio kept with its sign. +1 means the last n bars traveled their entire path upward, −1 downward, ~0 churn. Three horizons are blended 0.5/0.3/0.2 with the seniors heaviest, and everything is computed straight on chart bars — the script contains zero request.security calls, so the higher-timeframe re-resolution bug class is structurally impossible.
2. Structure Integrity 0–100. Not a second oscillator but a composite of three confirmed-pivot facts: (a) anchor hold — how firmly price holds the structural anchor pivot, ATR-scaled; (b) pivot-chain consistency — the share of recent pivot steps that agree with the structural direction; (c) retracement depth — the live pullback ranked as a percentile against the depths of pullbacks on this chart that eventually resumed. Self-calibrating; no fixed depth settings.
3. The pullback state machine. ARMED = trend efficiency flips against the trend while the structure holds. RESUMED = efficiency recovers, or price prints a confirmed close beyond the pre-pullback extreme. BROKEN = a confirmed close beyond the anchor pivot as it stood when the pullback started — a reversal, not a pullback. A structural direction flip during an armed episode counts as a failed pullback; nothing is silently dropped.
4. Measured base rates. The panel reports observed frequencies with sample sizes — measured per chart, per direction, not asserted. Below 10 completed episodes the panel says "collecting" instead of quoting noise.
Anatomy of the Display
On the price chart (the overlay layer):
Survival Zone while a pullback is armed: neutral slate = ordinary pullback territory, amber band = deeper than 75% of this chart's resumed pullbacks, dotted amber = the survival line, solid line = the frozen anchor
▲/▼ resume markers with the measured per-direction resume rate printed on them (tooltip: bars in pullback, max depth, base rate with n)
✕ BREAK marker at the anchor price on the confirmed close-through
Optional amber bar tint while armed (off by default)
In the oscillator pane:
Trend Efficiency line — teal above the bull threshold, ember below the bear threshold; brighter when |efficiency| is high; soft glow
Structure Integrity — quiet slate area (3-bar display smoothing; the engine reads the raw series); turns amber while a pullback is armed
Midline 50 and dotted 60/40 guides — the guides sit exactly on the direction-flip hysteresis thresholds
Phase lane (top strip): trend color = aligned, amber = pullback armed, grey = no established state
Pane event marks: • pullback armed, ▲/▼ trend resumed, ✕ structure broken; optional pane tint while armed
Panel: Trend, Structure (tooltip shows the three components), State, base rates per direction, live pullback depth percentile
Notes on Repainting
All state transitions, signal markers, base-rate counters and alerts fire on confirmed bars only and never move once printed
The oscillator lines, the live zone's right edge, the anchor line and the panel's live rows update intrabar — visual context, not signals
The survival line and the episode anchor are frozen at arm time — they do not follow price during the episode
Pivots confirm with the standard pivot lag (Pivot Length bars each side) and never move once confirmed
No request.security anywhere in the script
Typical Analysis Workflow
Read the State row: ALIGNED means efficiency and structure agree; NO ALIGNMENT means stand aside or dig deeper
When PULLBACK ARMED appears, check the live depth percentile — a pullback deeper than most that ever resumed deserves more suspicion
Use the base rates as context: a market where pullbacks resume 50% of the time is a coin flip and the panel will say so honestly
Treat ✕ structure broken as the line between "pullback" and "reversal" — the anchor pivot was closed through
Configuration
Response: Fast / Balanced / Strict — measured smoothing presets, not guesses
Auto Senior Horizons on by default; two manual timeframe inputs when disabled
Pivot Length, Min Integrity to Arm
Chart Overlay group: signals on price, survival zone, completed episodes to keep, anchor line mode (During pullbacks / Always / Off), bar paint, pane tint
All identity colors are inputs (dark-theme defaults; pick deeper tones on light charts)
Markets and Timeframes
Any symbol and timeframe. The engine is percentile- and ATR-based, so it self-calibrates per instrument. On low-history charts the panel reports "collecting" until the sample is real.
Alerts
Pullback armed · Trend resumed · Structure broken · Alignment started · Deep pullback (live depth crossed P75 of resumed history, once per episode) · plus one dynamic alert() with direction and integrity context. Penunjuk

Liquidity Reaper [JOAT]Tracks resting liquidity at swing extremes and signals the reversal when that liquidity is raided and rejected.
◆ WHAT IT IS
Price frequently pushes just beyond an obvious swing high or low — running the stops resting there — and then snaps back. Liquidity Reaper is built to detect that specific sequence: a sweep of a liquidity pool followed by a confirmed rejection , with volume backing the move. Each confirmed raid produces a reversal signal and a complete trade framework.
This is 100% original code, written from scratch. It does not copy or repackage any other author's work.
◆ HOW IT WORKS
1. Liquidity pools. Confirmed swing highs and lows (using your chosen strength) are stored as live liquidity rails — the price levels where stop orders tend to cluster. Unswept rails stay drawn on the chart; the oldest are recycled so the chart never clutters.
2. The raid. When price trades through a pool intrabar, a pending sweep opens on that side and the rail is terminated at the raid bar.
3. Confirmation. The raid only becomes a signal if, within a set confirmation window, price closes back inside the level in the opposite direction. Two extra filters keep the signal honest:
• Rejection wick — the sweep must reject with a wick of at least a configurable percentage of the candle's range, filtering shallow pokes
• Volume expansion — the raid must occur on above-average volume, so passive drifts are ignored
4. The zone. Each confirmed raid paints a swept zone across the raided range (pool level to wick extreme) — a reference area price often reacts to again.
◆ WHAT YOU SEE
• Liquidity rails at unswept swing highs (upside liquidity) and lows (downside liquidity)
• RAID BUY / RAID SELL labels showing the relative volume of the raid
• Painted swept zones on every confirmed raid
• A full TP/SL framework — entry, stop, TP1–TP3, risk/reward fills — that self-closes on a stop or final target
• A resizable dashboard reporting live pool counts each side, the nearest pool above and below with its ATR distance, pending-sweep status, raid history, and open position
◆ HOW TO USE IT
• The rails show where liquidity rests — natural draw-on-liquidity targets and reaction levels even before any signal.
• A RAID signal marks a completed sweep-and-reject; treat it as a potential reversal from that extreme.
• Swept zones are useful for re-entries and for placing stops beyond the wick.
• Works on all symbols and timeframes. Increase swing strength and the wick filter for major structure only; loosen them for active intraday sweeps.
◆ NOTES & LIMITATIONS
Use on standard candlestick charts . Sweep detection needs a genuine volume feed for the volume filter to be meaningful (disable it on symbols without volume). Signals are decision-support only — they are not financial advice and cannot guarantee a reversal will follow. Always apply your own risk management.
— made with passion by officialjackofalltrade
Penunjuk

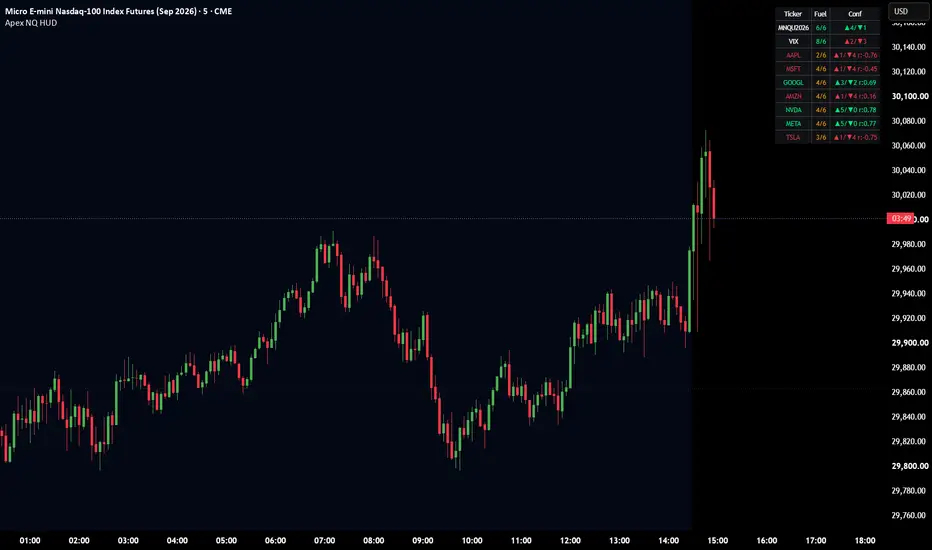
Apex Edge - NQ Correlation HUDApex Edge — NQ Correlation HUD
Note: This script is the HUD only. Screenshots may also show separate Supply & Demand zone and key-level tools running alongside it for extra confluence — those are independent indicators, not part of this script, and aren't required for the HUD to function.
What it does
Apex Edge — NQ Correlation HUD is a compact on-chart dashboard built for trading Nasdaq-100 index products (NQ, MNQ, and similar). Rather than manually flicking between the VIX and individual Mega-Cap Tech charts to gauge whether the broader market agrees with a setup, this indicator brings that context onto your current chart in one glance.
It scores your current instrument's own momentum and structure, then does the same for the VIX and seven Magnificent-7 stocks — live, every bar — and tells you visually which of those names are actually confirming your bias right now versus which aren't.
The HUD: Ticker / Fuel / Confluence
The dashboard is a simple 3-column table:
Ticker — the symbol for that row. Row 1 always reflects whatever chart you're currently on (so it updates automatically if you switch between NQ and MNQ, or any other symbol). Below that: VIX, then the 7 Mag7 names.
Fuel — a 0–10 momentum score for that symbol (see scoring below), shown as a fraction against your configured minimum threshold, e.g. 6/6.
Confluence — a directional vote out of 5, shown as ▲x/▼y, indicating how many of 5 independent components currently lean bullish versus bearish for that symbol.
What it monitors, and why
VIX — the market's fear gauge. It typically moves inversely to equities, so a VIX reading that's rising while your chart is bearish (or falling while your chart is bullish) is a classic confirmation signal. The HUD surfaces VIX's own Fuel and Confluence so you don't have to switch charts to check it.
The 7 Mag7 stocks (defaults: AAPL, MSFT, GOOGL, AMZN, NVDA, META, TSLA — all fully customizable in settings) — these carry substantial weight in the Nasdaq-100 and tend to drive a large share of its movement. When several of them are genuinely moving with your NQ/MNQ chart, that's real confirmation your setup isn't just noise on one instrument; when they're diverging, it's a reason for caution even if your chart alone looks clean.
How each pair offers confluence
A single chart can give a false signal — a stop run, a low-liquidity spike, an isolated headline. Checking whether the broader Nasdaq complex agrees filters a lot of that out. If your NQ/MNQ setup is bearish and the majority of Mag7 names are also showing bearish confluence while correlating with your chart's actual price action, and VIX is leaning bullish (its typical inverse relationship holding up), that's three independent confirmations lining up rather than one chart in isolation.
How the columns are scored
Fuel Score (0–10) is a multi-factor momentum read, built from:
Volume Z-score relative to a rolling average
Candle body dominance within its own range
Where the close sits within the bar's high-low range
ATR expansion versus its own rolling average
Confluence Score (out of 5) is a 5-component directional vote:
LTF trend (Hull moving average)
HTF trend (Hull moving average on a higher timeframe)
LTF RSI position
HTF RSI position
Price structure vs. a rolling range midpoint
Each component casts one bullish or bearish vote; the tally is shown as ▲bullish/▼bearish.
The correlation layer
This is what separates the Mag7 rows from a static watchlist. Each Mag7 ticker's title is colour-coded in real time:
Green — that symbol is BOTH rolling-correlated to your current chart above a threshold you set, AND its own Confluence is currently agreeing with your chart's direction.
Red — either condition fails: it's not correlating closely enough right now, or it's correlating but currently pointing the other way.
This means the HUD isn't just showing you 7 static numbers — it's telling you, live, which of the 7 are actually confirming your bias in this moment versus which are just along for the ride historically. Correlation lookback, the green/red threshold, and the correlation-guide tooltip (with standard statistical strength bands) are all configurable.
Built-in alerts
Two included alert conditions ("HUD Setup: Long Bias" / "HUD Setup: Short Bias") fire when your chart's Confluence bias is shared by a configurable number of the 7 Mag7 symbols AND VIX Confluence is leaning the opposite way. These are deliberately price-agnostic — they tell you when the broader HUD context has aligned, not when to enter. Pair them with your own key-level or zone tools to time actual entries once the alert fires.
Settings
Fuel/Confluence Dashboard toggle, dashboard position, minimum Fuel threshold
Hull MA period and HTF resolution
Multi-Pair HUD toggle, monitor timeframe for the 7 Mag7 rows
VIX symbol, all 7 Mag7 symbols (freely swappable)
Correlation lookback length, correlation threshold, min Mag7 aligned count for alerts
Align it with other confluence indicators to time your entry. Below is an example of the HUD running alongside 2 indicators (Key levels & Supply & Demand zones).
A NOTE ON USE:
Market hours affect the correlation rows. NQ/MNQ trade nearly 24 hours; the Mag7 equities only trade actively during NASDAQ hours (with an extended pre/post-market window beyond that). Outside those hours, correlation can legitimately read n/a for some or all Mag7 rows — that's expected behaviour, not a fault, since a closed/flat equity price has no variance to correlate against. Correlation readings are most meaningful during and immediately around the NASDAQ session; Fuel and Confluence continue working normally at all hours since they don't depend on cross-symbol variance.
This tool is designed to support discretionary trading decisions around Nasdaq-100 index products — it doesn't generate entries or exits on its own, and none of its readings guarantee a particular outcome. Fuel, Confluence, and correlation are all descriptive of current and historical price behaviour, not predictions. As with any tool, backtest and forward-test on a demo account before relying on it in a live or funded environment. Nothing in this script or its description constitutes financial advice. Penunjuk

Penunjuk

TJR US Open Macro Marker LinesTJR US Open Macro Marker Lines
Version 1.0.0
Marks the US-open macro time windows from TJR's methodology on the US500 and USTEC indices, so you can see at a glance where each window starts and ends as the New York open plays out. It draws vertical boundary lines and a small top-pinned label for each window, and nothing else, keeping the chart clean.
WHAT IT DRAWS
• Five vertical boundary lines, running the full height of the chart, at the four macro-window edges: 08:30, 09:30, 09:50, 10:10 and 10:30 New York time.
• Four top-pinned labels, one centred over each window: Pre., Man., Ent. and L.Ent.
• Nothing else. There is no background shading and no on-chart clutter.
THE FOUR WINDOWS (New York time)
• Pre: 08:30-09:30
• Manipulation: 09:30-09:50
• Entry: 09:50-10:10
• Late Entry: 10:10-10:30
HOW IT WORKS
• The 08:30 line sits on the candle that opens the Pre window. The 09:30, 09:50, 10:10 and 10:30 lines are pulled back one candle so the marked candle is the one that CLOSES at that boundary time, which is where each window actually ends.
• The windows are US-anchored via the "UK-US Time Difference" input. Leave it at 5 normally, and set it to 4 for the weeks each year when the UK and US daylight-saving changeovers are out of step, which keeps every line tracking the true New York clock.
• The correct clock time is used whatever timezone your chart is set to; only where the candles fall on the time axis changes.
• Show History draws prior days as well as today. History Range limits that to the last 5 trading days (weekends are not counted, which is lighter and faster on scroll) or the full loaded history.
WHAT IT RUNS ON
• US500 and USTEC only. On any other symbol it draws nothing.
• The 1m and 5m timeframes only. TJR's macros are read on those timeframes, and the one-candle pull-back lands cleanly only on those grids. Nothing draws on any other timeframe.
HOW TO USE
• Add it to a 1m or 5m US500 or USTEC chart. The lines and labels mark out the Pre, Manipulation, Entry and Late Entry windows across the New York open.
• Each boundary line has its own colour; line width, style and opacity are shared across all five. Each label has its own colour; label opacity is shared across all four. Set them to suit your chart.
• During the DST-mismatch weeks, switch the UK-US Time Difference input to 4 so the windows stay on the New York clock.
INITIAL RELEASE
Version 1.0.0. First public release. Marks the TJR US-open macro windows (Pre, Manipulation, Entry, Late Entry) on US500 and USTEC, 1m and 5m only, with per-line and per-label colours, shared line width/style/opacity and label opacity, a 5/4 US-anchoring input for the DST-mismatch weeks, and a Show History toggle with a 5-trading-day or full-history range.
FEEDBACK
Please let me know if you experience any issues, or have feedback for improvements or additions in the comments below. Thank you, Tom Penunjuk

Smart Money Toolkit Pro [JPT]🔷 OVERVIEW
Smart Money Toolkit Pro is an original Pine Script® v6 indicator that combines multiple Smart Money Concepts (SMC) into one clean and powerful trading tool. It automatically detects market structure, Break of Structure (BOS), Change of Character (CHoCH), liquidity levels, liquidity sweeps, and dynamic support/resistance to help traders analyze price action with confidence.
Designed for Forex, Gold (XAUUSD), Crypto, Stocks, Indices, and Futures, the indicator provides a clear visual representation of institutional market behavior without requiring manual chart drawing.
🔷 HOW IT WORKS
The indicator continuously scans price using confirmed pivot highs and lows.
Market Structure
The script automatically identifies:
• Higher High (HH)
• Higher Low (HL)
• Lower High (LH)
• Lower Low (LL)
These labels help traders understand whether the market is trending, ranging, or reversing.
Break of Structure (BOS)
A BOS is generated when price closes beyond a previous confirmed swing in the direction of the current trend.
Bullish BOS
Price breaks above a previous Swing High.
Bearish BOS
Price breaks below a previous Swing Low.
Change of Character (CHoCH)
A CHoCH signals a potential shift in market direction.
Bullish CHoCH
Price breaks above the previous Lower High.
Bearish CHoCH
Price breaks below the previous Higher Low.
This helps traders recognize possible trend reversals early.
Liquidity Engine
The built-in liquidity engine automatically plots:
• Buy-Side Liquidity (BSL)
• Sell-Side Liquidity (SSL)
• Equal Highs (EQH)
• Equal Lows (EQL)
The indicator monitors these areas for liquidity grabs and sweep events commonly associated with institutional trading activity.
Liquidity Sweeps
The script detects:
• Buy-Side Liquidity Sweeps
• Sell-Side Liquidity Sweeps
When a sweep occurs, the indicator marks the event directly on the chart, allowing traders to identify potential reversal opportunities.
🔷 VISUAL FEATURES
• Automatic Market Structure Labels (HH, HL, LH, LL)
• Break of Structure (BOS)
• Change of Character (CHoCH)
• Buy-Side Liquidity (BSL)
• Sell-Side Liquidity (SSL)
• Equal High Detection
• Equal Low Detection
• Liquidity Sweep Detection
• Dynamic Swing High & Low Levels
• Trend Background Coloring
• Liquidity Dashboard
• Trend Dashboard
• Professional Chart Layout
• Customizable Colors
🔷 DASHBOARD
The built-in dashboard displays:
• Current Trend
• Last Confirmed High
• Last Confirmed Low
• Active Buy-Side Liquidity
• Active Sell-Side Liquidity
• Latest Liquidity Event
This provides a quick overview of current market conditions.
🔷 INPUTS
Available settings include:
• Pivot Strength
• Show Structure Labels
• Show Swing Levels
• Extend Swing Levels
• Show BOS
• Show CHoCH
• Show Liquidity
• Show Liquidity Sweeps
• Show Equal High / Low
• ATR Tolerance
• Maximum Historical Liquidity Levels
• Bullish Color
• Bearish Color
• Liquidity Colors
🔷 ALERTS
Built-in alerts are available for:
• Bullish BOS
• Bearish BOS
• Bullish CHoCH
• Bearish CHoCH
• Buy-Side Liquidity Sweep
• Sell-Side Liquidity Sweep
Alerts can be connected directly to TradingView's notification system.
🔷 COMMON WORKFLOW
A typical workflow is:
Wait for confirmed market structure (HH, HL, LH, LL).
Observe BOS or CHoCH confirmation.
Monitor Buy-Side and Sell-Side Liquidity levels.
Watch for liquidity sweeps around key swing points.
Combine confirmations with your preferred entry strategy and risk management.
🔷 MARKETS
Smart Money Toolkit Pro can be used on:
• Forex
• Gold (XAUUSD)
• Silver (XAGUSD)
• Cryptocurrency
• Stocks
• Indices
• Futures
• Commodities
Compatible with all TradingView-supported timeframes.
🔷 BEST PRACTICES
For additional confirmation, many traders combine this indicator with:
• Support & Resistance
• Supply & Demand Zones
• Order Blocks
• Fair Value Gaps (FVG)
• Fibonacci Retracement
• EMA 50 / EMA 200 Trend Filter
• Volume Analysis
• Higher Timeframe Confirmation
These concepts are optional but can enhance decision-making when used alongside market structure.
🔷 UPCOMING FEATURES
Future updates may include:
• Institutional Order Blocks
• Fair Value Gap (FVG) Detection
• Premium & Discount Zones
• Auto Fibonacci Retracement
• Multi-Timeframe Market Structure
• Entry & Exit Signals
• TP1, TP2, TP3 Auto Targets
• Stop Loss Calculation
• Risk/Reward Visualization
• Advanced Smart Money Dashboard
• Session Analysis
• Volume Confirmation
🔷 DISCLAIMER
This indicator is provided for educational and informational purposes only. It highlights market structure and liquidity concepts based on historical price action and does not predict future market movements or guarantee trading performance. Always conduct your own analysis, use proper risk management, and consider additional market factors before making trading decisions. Penunjuk

Navyraid FVANavyraid FVA (Fair Value Area)
Description:
Overview
The Navyraid Fair Value Area (FVA) is a specialized analytical tool built upon the principles of Auction Market Theory (AMT). According to AMT, financial markets exist to facilitate trade, constantly moving between states of balance and imbalance. The market tends to travel from one established Value Area to another.
This indicator maps out these crucial areas by analyzing where the market spends the most time and how frequently specific price levels are visited throughout the trading day. By identifying these zones of high historical acceptance, the indicator projects key levels from previous sessions that act as strong magnets and significant support/resistance zones for current and future market action.
How It Works (Core Logic)
The indicator evaluates price action by breaking down the high-to-low range of each candle into specific discrete price bins (ticks). It then tallies how often the price trades through each bin over a defined period (daily basis).
Value Area Calculation: It accumulates these price interactions to find the area where a specified percentage of trading activity occurred (default is 68%, representing one standard deviation of the mean).
Key Level Extraction: It isolates the single price levels with the highest concentration of activity for both the Mayor and Minor FVA.
Main Features
Mayor FVA: This represents the Point of Control (POC) or the price level with the highest time accumulation strictly within the 68% Value Area. This zone acts as the primary focal point of market balance and a high-probability price magnet.
Minor FVA: This marks the most significant high-time node located strictly outside the established Value Area. These peripheral nodes frequently serve as crucial turning points, rejection zones, or targets when the market breaks out of its primary balance.
Smart Mitigation (Freeze Logic): To keep the chart clean and relevant, FVA zones are projected forward as boxes. By default, once the current price touches or "mitigates" an extended box, the box stops extending (freezes).
Force Extend: A toggle that overrides the mitigation logic, forcing the FVA boxes to continuously project forward regardless of price interaction, useful for long-term level tracking.
Auto Tick Size: The script automatically scales the bin sizes based on the asset's specific price range and minimum tick, making it universally applicable across Forex, Indices, Crypto, and Equities without manual adjustment.
How to Use in Trading
Traders can utilize the Navyraid FVA to understand the broader market context based on AMT.
Targets: If the price is moving directionally, previous Mayor FVAs serve as logical take-profit zones, as the market seeks historical balance.
Reactions: Minor FVAs can be observed for potential pullbacks or continuation setups when the market tests extreme areas outside of the previous day's accepted value.
Disclaimer: This indicator is designed for educational and analytical purposes to visualize Auction Market Theory concepts. It does not constitute financial advice. Penunjuk

EMA/SMA Classics V1.0 by SRTEMA/SMA Classics V1.0 by SRT
The EMA/SMA Classics indicator was designed to answer one simple question:
"Which side of the market currently has the structural advantage?"
Instead of flooding the chart with buy and sell arrows, this indicator focuses on market structure, trend alignment, and high-quality price action, allowing traders to make their own execution decisions with greater confidence.
Whether you trade Forex, Indices, Commodities or Crypto, this indicator combines multiple market concepts into a clean workflow while remaining highly configurable through both EMA and SMA combinations.
What This Indicator Includes
• Flexible EMA / SMA Engine
Unlike traditional moving average indicators that are locked to one MA type, every moving average in this indicator can independently be configured as either:
EMA
SMA
Default settings:
MA 1 : 7
MA 2 : 40
MA 3 : 150
MA 4 : 200
You may use the default configuration or customise the periods to fit your own trading methodology.
• Dynamic Moving Average Stack Detection
The indicator continuously evaluates whether the visible moving averages are properly stacked.
Bullish Stack
Fast MA > Medium MA > Slow MA
Bearish Stack
Fast MA < Medium MA < Slow MA
When the moving averages lose their proper order, the market is treated as neutral instead of forcing a directional bias.
This helps reduce many false trend signals that occur during consolidations.
• ATR-Based MA Spacing Filter
One common problem with MA strategies is entering when all moving averages have already compressed together.
This indicator measures the spacing between moving averages using ATR.
When the moving averages become too compressed, trend quality deteriorates.
The spacing filter helps identify these lower-quality environments before momentum fully develops.
• Ladder Structure
One of the core concepts inside this indicator is the Ladder System.
Instead of only observing moving averages, the indicator also evaluates the market using multiple dynamic support and resistance structures.
Resistance
R9
R40
R70
R100
R150
Support
S9
S40
S70
S100
S150
These levels automatically update with market structure and are used to generate an additional Ladder Bias.
When both the moving averages and Ladder Bias agree, market structure is generally stronger than relying on moving averages alone.
• Flush Dot System
The indicator displays visual Flush Dots beneath or above candles whenever trend alignment exists.
Small Green Dot
Bullish MA alignment.
Small Red Dot
Bearish MA alignment.
Large Green Dot
Moving Average alignment + Bullish Ladder confirmation.
Large Red Dot
Moving Average alignment + Bearish Ladder confirmation.
The larger dots represent stronger structural agreement across multiple components.
• KeyBar Detection
The indicator automatically identifies two important price action patterns.
Engulfing Bars
Bullish Engulfing (EBull)
Bearish Engulfing (EBear)
These are filtered using ATR and minimum body size to avoid insignificant candles.
Long Tail Bars (LTB)
Bullish Long Tail Bars
Bearish Long Tail Bars
These identify strong rejection candles with defined tail proportions and body positioning.
An optional body-size filter is also available for traders wanting stricter candle selection.
Daily Pivot (DP)
Automatically plots the previous day's pivot.
Useful as:
Dynamic support
Dynamic resistance
Intraday reaction level
Weekly Pivot (WP)
Automatically plots the previous week's pivot.
Many swing traders use weekly pivots as major reaction zones throughout the trading week.
RSI Momentum Alerts
The indicator includes two independent RSI event types.
RSI Breakout
Signals when RSI breaks into extreme momentum territory.
Bullish breakout
Bearish breakout
RSI Retracement
Designed to identify momentum continuation after RSI exits an extreme condition while confirming with the RSI Moving Average.
These alerts can be useful for traders looking to participate after momentum has begun to recover instead of chasing extremes.
Information Panel
A compact table summarises the current market condition.
Displays:
Moving Average Bias
Ladder Bias
Long Tail Bar presence
This provides a quick snapshot without needing to inspect every component individually.
How To Use This Indicator
This indicator is not designed to generate automatic Buy or Sell signals.
Instead, it acts as a Market Context Indicator.
A typical workflow may look like this:
Step 1
Observe whether the moving averages are properly stacked.
A clean stack generally indicates directional order.
Step 2
Check whether the Ladder Bias agrees with the moving averages.
When both align, the market structure is generally stronger.
Step 3
Watch for KeyBars.
Examples include:
Bullish Engulfing
Bearish Engulfing
Bullish Long Tail Bar
Bearish Long Tail Bar
These often represent meaningful reactions within the prevailing structure.
Step 4
Use Daily Pivot and Weekly Pivot as areas where price may react.
These levels should be considered areas of interest rather than guaranteed reversal zones.
Step 5
Monitor RSI alerts for momentum shifts.
Momentum signals are generally more useful when they occur in the same direction as the prevailing market structure.
Suitable Timeframes
Although the indicator can be applied to multiple chart intervals, it generally performs best on:
M15
M30
H1
H4
Daily
The moving averages, Ladder System, and KeyBar detection adapt naturally across different timeframes.
Difference Between EMA/SMA Classics & H1 EMA/SMA + Higher Timeframe Analysis (Classic)
Although both indicators belong to the same ecosystem, they serve different purposes.
EMA/SMA Classics
Designed as a general-purpose structural trend indicator.
Features include:
Flexible EMA/SMA stacking
Ladder System
Flush Dots
Engulfing Bars
Long Tail Bars
Daily Pivot
Weekly Pivot
RSI Alerts
It can be used on virtually any timeframe and is ideal for traders who prefer to analyse the chart directly.
H1 EMA/SMA + Higher Timeframe Analysis (Classic)
The H1 version is a significantly more advanced market context engine.
In addition to everything above, it introduces:
Dedicated H1 Bias Engine
H4 Trend Analysis
Daily Trend Analysis
Higher Timeframe Bias Aggregation
H1TF Composite Bias
Overall Market Verdict Engine
Multi-layer Bias Table
Higher Timeframe Confirmation Workflow
Rather than focusing solely on the current chart, the H1 version continuously evaluates whether multiple timeframes are aligned before presenting an overall market verdict.
If the EMA/SMA Classics indicator answers:
"What is my current chart doing?"
Then the H1 version answers:
"What is the broader market structure telling me across multiple timeframes?"
The two indicators are complementary and can be used together depending on your preferred trading workflow.
Disclaimer
This indicator is designed to assist with market structure analysis and decision-making. It does not provide financial advice or guarantee profitable trades. Always combine indicator signals with sound risk management, personal analysis, and appropriate position sizing. Penunjuk

Tyson Uppercut Compression Spring Breakout (Viprasol)Tyson Uppercut — Compression Spring Breakout 🥊
(The name is an affectionate combat-sports homage — this is an educational pattern tool, not affiliated with or endorsed by any athlete or organization.)
CONCEPT
A spring loaded by VOLATILITY, not by swings. The tool measures the recent bar-range and requires it to be compressed — noticeably tighter than the window before it (energy coiling). Then the uppercut: one wide-range bar that bursts up out of the compression on the close = the release. Distinct from swing-decay coils; this reads raw range contraction directly from the bars.
HOW IT DETECTS
- Compression is measured on CLOSED bars only: the highest high and lowest low over a window (default 10 bars, offset by one bar).
- That compression range must be tight versus the prior, wider window (default: <= 60% of the range over twice the lookback) AND not larger than a set ATR cap.
- Release: the current bar closes above the compression high, its full bar range is at least a set ATR multiple (default 1.3x ATR), and it closes up (close > open).
- All logic runs on bar close (barstate.isconfirmed). An optional dotted live box previews an active compression before any break.
ENTRY / STOP / TARGET
- Entry: on the confirmed release close (long only).
- Stop: below the compression low, minus an ATR buffer.
- Target: entry + R multiple of risk (default 2R, adjustable).
- Drawn as a solid compression box plus an entry line and filled TP/SL zones that extend right until price touches one; the hit side thickens.
NON-REPAINTING
Compression is read from already-closed bars (a one-bar offset is used), and the release is confirmed on the bar close. A printed signal does not move or disappear afterward. The live dotted preview is informational only and is not a signal.
KEY FEATURES
- Volatility-compression detection from raw range, with an ATR height cap to avoid oversized "boxes".
- Release requires a genuinely wide breakout bar, not just a marginal close.
- Optional live compression preview; option to hide new setups while a trade is active.
- Filled, extend-until-hit TP/SL zones and an on-chart status table (open trades). Alert condition included.
INPUTS OVERVIEW
- The spring: compression window (bars), tightness fraction vs prior window, max compression height (x ATR), release bar range (x ATR), ATR length.
- The knockout: TP as R multiple, SL buffer (x ATR), minimum bars between signals, one-trade-at-a-time, hide-setup-while-in-trade.
- Visuals: compression box / entry / TP / SL colors, label offset, zone transparency, show-live toggle.
HOW TO USE
1. Add to a liquid symbol and timeframe; it is fully overlay-based.
2. Set the compression window and tightness fraction to define how coiled the range must be.
3. Raise the release ATR multiple to demand a stronger breakout bar.
4. Watch the live dotted box to anticipate setups, and study the TP/SL zones on your instrument.
5. Optionally create an alert from the built-in condition.
LIMITATIONS (read this)
- This is a pattern/education tool, not a signal service and not financial advice. It does not predict the future.
- Compression breakouts frequently fail or reverse (false breakouts are common), especially in ranging markets.
- It is long-only by design; it does not trade downside releases.
- Range readings depend on the chosen windows; different settings can materially change what counts as "compressed".
- Results depend heavily on your inputs, instrument, and timeframe. Always use your own risk management and discretion.
CREDITS
ATR uses Wilder's Average True Range. Highest/lowest range measurement uses standard public functions (ta.highest / ta.lowest). The raw-range compression-and-release detection and the trade-zone visualization are original Viprasol design.
Original Viprasol work; no third-party Pine code reused.
Penunjuk

H1 EMA/SMA + Higher Timeframe Analysis (Classic) V1.0 by SRT# H1 EMA/SMA + Higher Timeframe Analysis (Classic) V1.0 by SRT
## Overview
H1 EMA/SMA + Higher Timeframe Analysis (Classic) V1.0 by SRT is a complete market context indicator designed to help traders read trend, structure and execution quality from a single chart.
Instead of relying on one indicator alone, this script combines multiple layers of market information into one unified framework:
• H1 Moving Average Bias Engine
• Higher Timeframe (H4 & Daily) Trend Confirmation
• Ladder Market Structure Analysis
• Dynamic Daily & Weekly Pivot Levels
• VWAP Bias Filter
• Engulfing & Long Tail Bar (LTB) Detection
• RSI Breakout & Retracement Alerts
• Composite Bias Dashboard
• Smart Alert System
The objective is simple:
Reduce subjectivity by helping traders identify when multiple independent factors agree before looking for trade opportunities.
This indicator is designed for traders who prefer trading with trend and market structure rather than relying on a single crossover or oscillator.
---
## Main Features
### ① H1 Bias Engine
The H1 Bias Engine evaluates the alignment of up to four configurable EMA/SMA lines.
Unlike traditional MA crossover indicators, this engine considers:
• Moving average order
• Price position relative to the moving averages
• MA spacing quality
• Trend strength
Bias is classified into:
• Strong Bullish
• Bullish
• Neutral
• Bearish
• Strong Bearish
An ATR-based spacing filter automatically ignores signals when moving averages become compressed, helping reduce false trend readings during consolidation.
---
### ② Higher Timeframe Bias
The script automatically evaluates both:
• H4 Trend
• Daily Trend
using a dedicated EMA40 / EMA150 / SMA200 structure.
These two higher timeframes are combined into a Higher Timeframe (HTF) Bias.
This allows traders to quickly determine whether H1 signals are aligned with the broader market direction.
---
### ③ Ladder Market Structure
The Ladder System measures how support and resistance levels evolve over multiple lookback windows.
Support Levels
S9
S40
S70
S100
S150
Resistance Levels
R9
R40
R70
R100
R150
The relative positioning of these levels produces a Ladder Bias ranging from:
Strong Bullish
Bullish
Neutral
Bearish
Strong Bearish
This provides an additional market structure confirmation independent of moving averages.
---
### ④ Composite H1TF Bias
One of the core components of the indicator.
H1TF combines:
• H1 Moving Average Bias
• Ladder Bias
to generate a stronger consensus trend.
Rather than reacting to a single condition, H1TF requires agreement between trend and structure before producing stronger directional confidence.
---
### ⑤ Final Verdict Engine
The Final Verdict combines:
Higher Timeframe Bias
*
H1TF Composite Bias
Only when both higher timeframe trend and H1 composite trend strongly agree will the dashboard produce:
Strong Bullish
or
Strong Bearish
This helps traders focus on higher probability market conditions instead of reacting to every market fluctuation.
---
### ⑥ Key Bar Detection
The indicator automatically detects two important price action patterns.
Bullish / Bearish Engulfing Bars
Long Tail Bars (LTB)
Each signal includes:
ATR size validation
Minimum body filters
Tail quality checks
Momentum confirmation
These are designed to highlight significant candles instead of every basic engulfing or pin bar.
---
### ⑦ Daily & Weekly Pivot Levels
Built-in pivot calculations include:
Daily Pivot (DP)
Weekly Pivot (WP)
These levels provide additional context for potential support, resistance and reaction zones.
---
### ⑧ VWAP Bias
The indicator includes a built-in VWAP filter.
Price above VWAP
Bullish
Price below VWAP
Bearish
This offers another layer of institutional-style market context that complements the moving average analysis.
---
### ⑨ RSI Momentum Alerts
Four RSI-based alerts are included.
Bullish RSI Breakout
Bearish RSI Breakout
Bullish RSI Retracement
Bearish RSI Retracement
These alerts are designed to identify momentum expansion as well as potential continuation opportunities after retracements.
---
### ⑩ Smart Alert System
The alert engine supports multiple event types.
H1 Bias changes
Higher Timeframe Bias changes
H1TF Composite changes
Ladder Bias changes
Bullish Engulfing
Bearish Engulfing
Bullish Long Tail Bar
Bearish Long Tail Bar
Optional filters allow alerts to trigger only when aligned with:
H1TF
Higher Timeframe
Strong Bias only
This helps reduce unnecessary alert noise.
---
## Reading the Bias Dashboard
The dashboard summarizes the complete market picture.
Daily
Daily Trend
H4
H4 Trend
HTF
Combined Higher Timeframe Trend
H1
Current H1 Moving Average Bias
Ladder
Market Structure Bias
H1TF
Combined H1 Trend
VWAP
Current VWAP Position
Verdict
Final Consensus
The strongest trading environments generally occur when multiple components point in the same direction.
---
## Typical Workflow
A simple workflow may look like this:
1. Check the Final Verdict.
2. Confirm H1TF agrees with the Higher Timeframe.
3. Observe whether VWAP supports the direction.
4. Wait for a qualifying Engulfing Bar or Long Tail Bar.
5. Use Daily Pivot, Weekly Pivot and Ladder levels for trade management.
This approach encourages waiting for confluence rather than entering solely because one indicator changes direction.
---
## Notes
This indicator is intended as a market context and decision-support tool.
It does not predict future prices and should not be considered a standalone trading system.
Like any technical tool, it performs best when combined with sound risk management, proper trade planning and disciplined execution.
---
Thank you for using H1 EMA/SMA + Higher Timeframe Analysis (Classic) V1.0 by SRT
I hope this indicator helps simplify chart analysis and encourages traders to focus on market structure, trend alignment and disciplined decision making.
— SRT
Penunjuk

Ronaldo Bicycle Kick Orbit Break Reversal [ Viprasol ]Ronaldo Bicycle Kick — Orbit Break Reversal (Viprasol)
WHAT IT DOES (the idea)
Most reversal tools watch a single line. This one watches a region. It treats recent price structure as a set of confirmed swing points that "orbit" a structural centre of mass, and it trades the moment price escapes that orbit to the upside. Like a ball coiling around a centre and then leaving orbit — that break is the signal. The name is a sporting homage to a spectacular finish; the tool itself is pure geometry.
HOW IT DETECTS
1. Swings: a lightweight zigzag keeps the last several confirmed pivots. A pivot is only accepted after the required number of bars close to its right, so swings do not move once printed.
2. Orbit geometry: from the last K swings (default 6) it computes the geometric centroid — the mean bar position and mean price. It then measures the average (root-mean-square) distance those swings sit from the centroid price. That distance, scaled by "Orbit radius," becomes the orbit ring. A minimum radius floor (in ATR) filters out flat, meaningless rings.
3. Escape: the setup arms only when the orbit is valid. The signal fires on the first bar that CLOSES above the top of the orbit ring (centroid price + radius) having closed at or below it on the prior bar.
ENTRY / STOP / TARGET
- Entry: the close of the escape bar (long only).
- Stop: the lowest swing price inside the orbit, minus an ATR buffer.
- Target: Entry + R multiple x risk (default 2R), where risk = Entry - Stop.
Each trade draws an entry line plus filled TP and SL zones that extend forward bar by bar until price touches one of them, then freeze.
NON-REPAINTING
Signals are built from confirmed pivots and only evaluated on a confirmed (closed) bar. Nothing is placed on the developing bar, so a printed signal does not disappear or shift on later ticks. The dotted "live orbit" preview is a forward-looking sketch of the current geometry and is not a signal.
KEY FEATURES
- A real orbit ellipse is drawn around the centroid so you can see the ring being broken.
- Extend-until-hit TP/SL zones with a one-trade-at-a-time option.
- Optional hide-new-setup-while-in-trade to reduce clutter.
- Adjustable pivot width, swing count, orbit radius, ATR floor, R multiple, stop buffer, and a minimum-bars-between-signals gap.
INPUTS OVERVIEW
Swing pivot left/right bars; swings used for the orbit; minimum swings for validity; orbit radius multiplier; minimum orbit radius in ATR; ATR length; TP R multiple; SL ATR buffer; signal gap; one-trade toggle; visual colours and label offset.
HOW TO USE
1. Add to any liquid symbol and timeframe; it works on all.
2. Watch for the dotted orbit ring to form around recent structure.
3. Take note when a bar closes above the ring and the GOAL label prints.
4. Use the drawn entry, TP, and SL zones as a visual trade map; adjust the R multiple and stop buffer to your own plan.
5. Raise the pivot width or ATR floor on noisy, low-timeframe charts to demand cleaner structure.
LIMITATIONS (honest)
- This is a pattern and education tool, not a signal service or an autotrading system. It highlights a geometric condition; it does not predict outcomes.
- Long-only by design. It will not flag downside setups.
- In strong one-way trends the orbit ring can be escaped repeatedly; in choppy ranges valid orbits may be sparse. Context and discretion still matter.
- Requiring confirmed pivots means the orbit is defined slightly after a swing forms, which is the cost of non-repainting behaviour.
- Past behaviour of any pattern does not guarantee future results.
CREDITS
Built on public, well-known concepts: Average True Range (J. Welles Wilder) for volatility scaling, and standard pivot/zigzag swing detection. The orbit-centroid geometry and the escape logic are original Viprasol work. The "Bicycle Kick" name is an affectionate sporting homage and does not imply any endorsement or affiliation.
This script is an educational tool and is not financial advice. Trade your own plan and manage risk.
Original Viprasol work; no third-party Pine code reused.
Penunjuk

Auto Trendlines [AFD]Traders!
If this draws fewer lines than the last auto-trendline script you tried, that is not a bug.
Almost every free entrant in this category will connect any two points and call the result a trendline, including points price has already traded straight through. This one will not draw that line at all.
WHAT IT DOES
Two confirmed same-side pivots define a diagonal line - two swing highs for a descending line, two swing lows for an ascending one. Before it is drawn, the pair has to pass four checks, all required:
Same side. Never one high paired with one low.
Progressive. The second pivot has to be lower than the first on a descending line, higher on an ascending one.
No pierce. No bar between the two anchors may have traded through the line.
Still intact now. No bar since the second anchor may have violated it either.
The third check is the one almost everyone in this category skips, and the fourth closes the gap right behind it - a pivot needs time to confirm, so without the fourth check a line could pass the first three and still be dead on arrival, already traded through in the bars since its own anchor. Of every pair that clears all four, the one nearest current price is the one drawn.
It keeps three lines per side by default - one at your Swing Strength setting, and two more at longer multiples of it - so a short, a medium and a long trendline can all be live on the same side at once, each resting on a different swing rather than three readings of the same one.
HOW A LINE LIVES AND DIES
A live line is maintained, not redrawn - its right edge follows price, and its label counts how many bars have touched it within your tolerance. It is retired, dimmed and kept on the chart, never silently deleted, for exactly one of two reasons: price violated it, or its anchor aged past your Bars to Apply setting. A retired line's colour, width and style are yours to set - the defaults reproduce a plain grey dotted line, but a violated line and an aged-out line both use the same styling, because both are "no longer live" and neither claims anything about what happens next.
When a side has nothing to show, an optional note names the refusal directly instead of leaving a blank chart that reads as broken - something like "No valid ascending line - recent pivot pairs failed the validity rule." It disappears the moment a line forms on that side.
THE TWO ALERTS
One alert per side, on one event: a line was violated and retired, on the bar that just closed. That is the whole alert surface.
It does not fire on a developing bar - only once a bar closes.
It does not fire when a line is retired for age. An aged line was not violated, and an alert saying it was would be a false statement about your chart.
It does not tell you what to do next. It names the event and points at the settings that produced it.
There is no alert for a line forming, for a touch, or for price approaching a line.
SETTINGS WORTH KNOWING FIRST
Swing Strength sets how many bars either side of a pivot must confirm it - higher means steadier, later pivots; lower means more of them, sooner and noisier. Pivots Searched sets how many recent pivots each length keeps in its pool to test pairs from. Pierce Tolerance and Touch Tolerance are both a multiple of ATR: Pierce is how far price may travel through a line before it counts as pierced or violated, and Touch is the separate band used only for counting touches. Bars to Apply bounds how old a line's anchor may get before it ages out - 0 means no limit.
Minimum Touches is worth reading twice, because it does not do what it sounds like. Requiring touches before a line can be drawn does not find a better line - it defers the same line's appearance into a later, shorter-lived part of its own life, since touches accrue before the line is drawn, not after. What it actually buys is recency: the lines that survive it are the ones price is currently working on.
Label position offers "Right of line" (default, floats along the line's own slope) or "Below, centered" (sits directly under the line's tip). Either way the label is a plain box with no pointer.
WHAT IT WILL NOT DO
It is not a signal tool. It does not grade a line's strength, does not rank one line against another, and does not name a target, a breakout, or a bounce - each of those is a claim about the bar after the one that just closed, and this script has no view on that. A touch count is a count of what already happened, shown with the tolerance that produced it, nothing more.
WHAT IS DISCLOSED RATHER THAN HIDDEN
A line appears late by design - its anchors are confirmed pivots, so a line shows up Swing Strength bars after the bar that anchors it. That lag is the price of not drawing lines that vanish a bar later.
Whether this script repaints has not been observed on a replay and is not claimed here either way. Its behaviour on a logarithmic price scale is likewise unobserved and unclaimed.
Zero request.*() calls of any kind - every calculation reads the chart's own series.
Open source under the Mozilla Public License 2.0. Penunjuk

Liquidity Sweep Tracker | Smart Money Stop HuntsThis strategy identifies where retail stop-losses and breakout orders cluster (swing highs/lows), waits for price to sweep through that liquidity, and enters only after a confirmed rejection back inside the range. No repainting on the wick, no chasing breakouts — just structured, confirmation-based reversal trading built around genuine Smart Money Concepts (SMC) mechanics.
Core Features
Sweep Detection Engine
Tracks swing highs/lows as live liquidity pools, scored by touch count
ATR-scaled sweep buffer filters out noise — only meaningful stop-runs qualify
Configurable confirmation window (N bars) for the rejection close back inside range
7-Factor Confidence Score (0–100)
Every signal is graded on sweep depth, touch count, market structure alignment, ATR volatility regime, post-sweep displacement, volume spike magnitude, and HTF zone proximity — giving you a single, transparent quality metric per trade instead of a black-box signal.
Structure-First Exits
Adaptive stop placement anchored to the actual sweep wick + volatility regime (not a flat ATR multiple)
Targets pull from real market structure: nearest Fair Value Gap (TP1) and opposing liquidity pool (TP2)
Automatic exit on opposing Break of Structure — if the thesis is invalidated, you're out
Optional time-based exit for setups that stall
Fully Modular Filters — Everything Toggleable
Volume spike confirmation
HTF liquidity zone alignment
Engulfing / displacement / break-of-sweep-candle confirmation triggers
Minimum reward-to-risk gate before any entry fires
All filters default OFF or loosely set — tune restrictiveness to your own edge
Clean, Purpose-Built Visuals
Thin liquidity lines at unswept swing levels — opacity/thickness scale with touch count, so "thicker" lines mark heavier resting liquidity
Simple BUY/SELL labels only on confirmed signals (confidence % included, no chart clutter)
Confidence-scaled glow on active stop/target lines
Win-rate table auto-bucketed by confidence tier (Low/Med/High) — see if your high-confidence signals actually outperform
Ideal Usage
Best markets: liquid index futures (ES/NQ), high-volume large-cap equities, major crypto pairs (BTC/ETH), and major FX pairs during session opens — anywhere real stop-hunting order flow exists
Best timeframes: 15m–1H for intraday/swing entries paired with a 4H–Daily HTF filter; scale the ratio proportionally for scalping or position trading
Best conditions: ranging-to-trending transitions around obvious structure (prior session highs/lows, equal highs/lows) — avoid dead, illiquid instruments where "sweeps" are just noise
Recommended workflow: start with filters off to see raw signal frequency, then layer in volume/HTF/R:R gates while watching the win-rate table to find your own confidence threshold sweet spot
Notes
Pivot-based swing/structure detection carries an inherent confirmation lag (no repainting, but structure is confirmed slightly after the fact). This is a strategy script — backtest thoroughly across your target instrument and timeframe before any live use, and treat the confidence score as a filter to calibrate, not a guarantee. Strategi

Gravity Bands [JOAT] Price orbits value. An anchored VWAP core with true volume-weighted deviation shells, on clean monochrome candles.
◆ WHAT IT IS
Gravity Bands treats fair value as a gravity core that price orbits and keeps returning to. The core is an anchored VWAP , and the bands around it are true volume-weighted standard deviations — not simple percentage or ATR envelopes. A signature "Lunar Mono" candle mode repaints the chart in clean white/grey so the gravity field is the only color on screen. It is a pure context tool with no buy/sell signals.
This is 100% original code, written from scratch. It is not a repackaged VWAP or bands script.
◆ HOW IT WORKS
1. The gravity core. A volume-weighted average price is accumulated from a chosen anchor — Session, Week or Month — resetting each new period. This is the center of value that price gravitates toward.
2. Volume-weighted shells. The bands are computed from the volume-weighted variance of price around the core, giving genuine ±1σ, ±2σ and ±3σ deviation shells. Because they are volume-weighted, the shells reflect where real activity occurred, not just where price ranged.
3. Stretch. The core distance is expressed in sigma — how many standard deviations price has escaped value. Small stretch means price is orbiting fair value; large stretch means it is extended and statistically stretched from the mean.
4. Lunar Mono candles. An optional mode repaints candles in white (up) and slate grey (down) so the colored gravity field reads instantly without competing with candle colors — the signature look of this tool.
◆ WHAT YOU SEE
• The gravity core (anchored VWAP) with a soft ±1σ / ±2σ / ±3σ gravity field
• Optional Lunar Mono monochrome candles
• An extreme-stretch background wash when price escapes the outer shell
• A resizable dashboard showing the core value, the stretch state and an orbit gauge, the upper and lower shell prices, the 1σ width in price and as a percent, the anchor mode, and a volume-feed check
◆ HOW TO USE IT
• Treat the core as the day's (or week's/month's) fair value — a magnet price often reverts to.
• Use the shells as objective stretch zones: reaching ±2σ or ±3σ marks a statistically extended condition where mean-reversion or exhaustion becomes more likely.
• Reclaiming or losing the core is a simple bias flip .
• Match the anchor to your horizon — Session for intraday, Week/Month for swing context.
• Requires a symbol with a real volume feed.
◆ NOTES & LIMITATIONS
Gravity Bands needs a genuine volume feed — without one the core approximates price and the shells lose meaning (the dashboard flags this). Deviation shells describe statistical stretch, not direction: price can stay extended in a strong trend. It is a context tool, not financial advice. Use it with your own method and risk management.
— made with passion by officialjackofalltrade
Penunjuk

Single Timeframe Multi-EMA Trend Table### Overview
The **Single Timeframe Multi-EMA Trend Table** displays the directional bias of 7 customizable Exponential Moving Averages (EMAs) calculated from a single, higher timeframe of your choice.
This allows traders working on lower execution timeframes (e.g., 1-minute or 5-minute charts) to effortlessly monitor macro trend alignment and EMA support/resistance zones from higher timeframes (e.g., 15m, 1h, or 4h) without switching charts.
---
### Key Features
* **Selectable Target Timeframe:** Choose any timeframe (1m, 5m, 15m, 1h, 4h, 1D, etc.) to fetch EMA data from.
* **7 Customizable EMAs:** Define 7 individual EMA lengths (e.g., EMA 9, 20, 50, 100, 150, 200, 800) to monitor full trend structure.
* **Consolidation Detection:** Identifies when price is compressing or trading close to a specific EMA line, marking it as a **RANGE 🟡** state.
* **Clean UI:** Displays chosen timeframe in the table header alongside active EMA lengths and clear color-coded statuses.
---
### How to Use
1. **Set Target Timeframe:** In the settings, choose the macro timeframe you want to base your analysis on (e.g., 15m).
2. **Configure EMAs:** Input your preferred EMA lengths.
3. **Gauge Trend Strength:**
* **Full Bullish Alignment:** All or most EMAs show `BULLISH 🟢`.
* **Compression/Ranging:** Multiple EMAs show `RANGE 🟡`, warning of choppy price action. Penunjuk

VWAP Reversal Probability Signals🟠 OVERVIEW
VWAP Reversal Probability Signals tracks price movements around an anchored VWAP and two volume-weighted standard deviation bands. It looks for price excursions outside these bands and waits for price to move back through the same band before marking a potential reversal.
Each reversal signal is paired with a fixed VWAP target. The script records whether price reaches that target within a user-defined number of bars and displays the historical success rate for each band independently. This allows traders to compare how different reversal distances have performed over time instead of treating every signal the same.
🟠 CONCEPTS
Anchored VWAP — A volume-weighted average price that resets at the selected session, week, month, quarter, or year and acts as the central reference level.
VWAP Deviation Bands — Upper and lower bands created from volume-weighted standard deviation multiples around the anchored VWAP to define progressively larger price extensions.
Reversal Signal — Generated when price first extends beyond a deviation band and then closes back through that same band, indicating that the extreme move has started to reverse.
VWAP Target — Every signal uses the current anchored VWAP as its fixed target, allowing completed signals to be measured using the same destination.
Reversal Probability — The historical percentage of completed signals from each individual band that reached the VWAP target before the expiry period.
🟠 FEATURES
Anchored VWAP and Reversal Bands — Displays the anchored VWAP together with two configurable upper and lower deviation bands.
Reversal Signal Markers — Shows bullish and bearish reversal signals after price returns back
through the selected deviation band.
Historical Probability Labels — Displays the historical VWAP target hit rate beside each new reversal signal for the corresponding band.
VWAP Target Lines — Draws a projected target from every signal to the current VWAP until the trade either succeeds or expires.
Target Confirmation Marks — Places a confirmation mark when a tracked signal reaches its VWAP target within the selected expiry window.
🟠 HOW TO USE
Choose the VWAP anchor period that matches your trading style, such as session, week, or month.
Watch for price to extend beyond a VWAP deviation band and then move back through that same band before considering a reversal signal.
Compare the probability label shown with the signal to understand how that band has performed historically.
Use the dashed VWAP target line as the expected mean reversion objective for the active signal.
Treat the displayed probability as historical context rather than a prediction of future performance.
🟠 CONCLUSION
VWAP Reversal Probability Signals combines an anchored VWAP, volume-weighted deviation bands, reversal signals, and historical outcome tracking. By measuring how often each type of reversal has returned to the VWAP, it provides both reversal locations and statistical context for those signals. Penunjuk

Multi-Timeframe Trend & Consolidation Table### Overview
The **Multi-Timeframe Trend & Consolidation Table** is a lightweight dashboard indicator designed to give traders a quick, multi-timeframe overview of the market trend and consolidation status directly on their chart.
Instead of switching between multiple timeframes or cluttering your chart with dozens of moving averages, this tool consolidates trend data across 10 different timeframes into a clean, customizable table.
---
### Key Features
* **Multi-Timeframe Analysis:** Monitors **1m, 3m, 5m, 10m, 15m, 1h, 4h, 1D, 1W, and 1M** timeframes simultaneously.
* **Customizable EMA Periods:** Set unique Exponential Moving Average (EMA) lengths for every individual timeframe (e.g., EMA 10 for 1m, EMA 50 for 1h, EMA 200 for 1D).
* **Consolidation Detection:** Built-in threshold logic identifies when price is hovering extremely close to the EMA line, signaling potential range-bound/chop market conditions.
* **Dynamic Table UI:** Displays the specific EMA length assigned to each timeframe directly inside the table for clear tracking. Fully customizable position (Top Right, Bottom Left, etc.) and text sizes.
---
### How It Works
The indicator compares the price of each timeframe against its assigned EMA line:
1. **BULLISH 🟢:** Current close price is above the timeframe's EMA (outside the consolidation zone).
2. **BEARISH 🔴:** Current close price is below the timeframe's EMA (outside the consolidation zone).
3. **RANGE 🟡:** Price percentage difference from the EMA is smaller than the set threshold (e.g., within 0.15%), indicating market consolidation or flat movement.
---
### How to Use
1. **Trend Alignment:** Look for timeframes aligning in the same direction (e.g., 1h, 4h, and 1D all green) to trade with the macro trend.
2. **Avoiding Chop:** When lower timeframes show `RANGE 🟡`, it indicates low volatility or moving average compression, warning you to avoid breakout trades or wait for confirmation.
3. **Execution Timeframes:** Tune lower timeframes (1m, 3m, 5m) to fast EMAs for scalp setups, while keeping higher timeframes (1D, 1W) on key levels like the 200 EMA.
---
### Settings & Inputs
* **EMA Lengths per Timeframe:** Set custom EMA periods for all 10 available timeframes.
* **Enable Consolidation Detection:** Toggle range detection on or off based on your strategy preference.
* **Consolidation Threshold (%):** Adjust the distance percentage between close price and EMA to define a range zone (default is 0.15%).
* **Table Display:** Adjust table placement on your screen and text font size. Penunjuk

MSNR Bias HTFAKFX Storyline Alignment Dashboard (Multi-Timeframe Analysis)
The AKFX Storyline Alignment Dashboard is a multi-timeframe analysis tool designed to help traders quickly determine market bias and alignment across higher and lower timeframes using the concept of Market Storylines.
Instead of trading off single-timeframe signals, this indicator evaluates structural price action on higher timeframes (HTF) and confirms directional continuation via line-chart breakouts on the lower timeframe (LTF).
🟢 How the Storyline Logic Works
A Storyline is defined as the price movement initiated when price interacts with a higher timeframe zone and receives confirmation from the timeframe directly below it.
Weekly Storyline (Macro Bias):
Checks if Current Market Price (CMP) is reacting at a Weekly Support or Resistance zone.
Confirmed when a Daily line-chart breakout occurs (a Daily candle body closes past the local Daily swing high/low).
Daily Storyline (Intermediate Bias):
Checks if CMP is reacting at a Daily Support or Resistance zone.
Confirmed when a 4-Hour (H4) line-chart breakout occurs (an H4 candle body closes past the local H4 swing high/low).
Bias Alignment Status:
ALIGNED (BULLISH 🟢): Both Weekly and Daily storylines are confirmed Bullish. High-probability environment to look for Buy setups.
ALIGNED (BEARISH 🔴): Both Weekly and Daily storylines are confirmed Bearish. High-probability environment to look for Sell setups.
CONFLICTED 🔴: Weekly and Daily storylines point in opposite directions. Exercise caution or wait for alignment.
WAITING FOR SETUP ⚪: One or both storylines are in a neutral/unconfirmed state.
🎨 Key Customization Features
Customizable Dashboard Colors: Configure background fill, text, border, and header colors via the indicator settings.
Default High-Contrast Theme: Pre-styled with a dark gray fill, crisp black text, and a solid black border for maximum readability on any chart background.
Optional Status Highlighting: Includes a toggle (Use Green/Red Status Colors instead of Solid Gray) to instantly highlight alignment with green/red status boxes.
💡 How to Use in Your Trading Strategy
Add the dashboard to your preferred asset (Forex, Crypto, Indices, Stocks).
Check the Bias Alignment Status row:
When ALIGNED: Look for pullback entries at fresh Support/Resistance zones on your execution timeframe (e.g., H1 or 15m) in the direction of the alignment.
When CONFLICTED or WAITING: Sit on your hands or restrict trades to quick scalps, as higher timeframe momentum is divided. Penunjuk

Elliott Impulse Engine [WillyAlgoTrader]📊 Elliott Impulse Engine (EIE) is an overlay indicator that counts a full Elliott cycle — impulse 0-1-2-3-4-5 plus correction A-B-C — completely automatically, using a Change-of-Character (CHoCH) trigger to start each count, a strict state machine to accept every wave point, Fibonacci target boxes to show where the next point is expected, a dashed "ghost" projection of the entire remaining path, and a trailing red invalidation line that tells you the exact price where the current count dies.
The core insight: most Elliott Wave tools either repaint their labels endlessly or force you to draw everything by hand. EIE does neither. It treats every count as a hypothesis : a CHoCH break seeds it, each confirmed pivot advances it one wave at a time, and a single hard price level can kill it. When the hypothesis dies, the chart is wiped clean and the engine waits for the next CHoCH — no stale labels, no silent redrawing of history. You always know three things at a glance: what wave the market is in, where price should go next, and where the idea is wrong.
Works on any symbol and any timeframe. Free and open for everyone.
🧩 WHY THESE COMPONENTS WORK TOGETHER
A ZigZag alone gives you swings but no wave logic. A Fibonacci tool alone gives you levels but no structure. A CHoCH detector alone tells you the trend flipped but not what comes next. And a manual Elliott count gives you structure but demands hours of drawing and constant re-labeling.
EIE chains all of these into one pipeline:
Swing structure engine → CHoCH detection → count seeding (point 0 + point 1) → fib grid on leg 0-1 → target boxes for points 2/3/4 → pivot-based point acceptance with soft-marking → ghost projection of the remaining path → trailing invalidation level → reset with a stated reason
The swing engine finds structural highs and lows. A confirmed close through a swing level against the previous trend is a CHoCH — the only event allowed to start a new count, so counts always begin at genuine structure shifts, not random noise. The moment leg 0-1 is confirmed, the engine builds a Fibonacci grid on that leg and projects the whole expected structure forward as a dashed ghost path. Each subsequent wave point is accepted from a separate, faster pivot stream, checked against its expected fib range, and either labeled clean ("2") or soft-marked ("2~") if it landed outside the range. At every state the engine maintains exactly one critical price — the trailing invalidation level — and if price breaks it, the count is declared dead with an explicit reason (BELOW_0, BELOW_W2, W3_SHORTEST, and so on), the markup is wiped, and the engine returns to scanning.
No single public tool does this loop. The combination turns Elliott counting from a subjective drawing exercise into a rule-driven process you can watch unfold bar by bar.
🔍 WHAT MAKES IT ORIGINAL
1️⃣ CHoCH-seeded counting — every count starts at a real structure break.
The engine tracks swing highs and lows using symmetric pivots (default 10 bars left / 10 bars right). A break is registered only on a confirmed bar close through the swing level. If that break goes against the current internal trend, it is a CHoCH — and only then does the engine arm a new count: point 0 is set to the extreme of the run that preceded the break, and the engine waits for a with-trend pivot beyond the CHoCH level to lock point 1.
Anti-noise guards built into the seeding:
— a warm-up gate (no CHoCH before max(3 × swing length, 50) bars of history),
— an optional cooldown (N bars after any count ends before a new CHoCH may seed),
— a level lock: after an invalidation, the same CHoCH level cannot immediately re-seed a new count (compared with half-a-tick tolerance, so floating-point equality can never leak a duplicate seed).
Why this matters: counts started from random pivots produce random labels. Counts started from structure breaks start where trend logic actually changed.
2️⃣ Non-blocking Fibonacci ranges with soft-marking — geometry informs, price decides.
Each wave point has an expected fib range measured on the 0→1 grid (retracement for 2, negative extension beyond point 1 for 3, 5 and B; point 4 uses its own 2→3 grid; C uses 0→1 again):
— Point 2: 0.5 – 0.705 (retracement of 0→1)
— Point 3: −0.5 – −0.618 (extension beyond point 1)
— Point 4: 0.5 – 0.705 (retracement of leg 2→3)
— Point 5: −0.618 – −1.0
— Point B: −0.5 – −0.618
— Point C: 0.0 – 0.236
The fib level of any price p on the 0→1 grid is computed as L = (p1 − p) / (p1 − p0); on the 2→3 grid as F = (p3 − p) / (p3 − p2). A pivot inside its range is labeled clean ("3"); a pivot outside it is still accepted but soft-marked ("3~") — because in real markets a valid wave frequently overshoots textbook levels. Only the hard invalidation rules can reject a point. Every range is a user input (min/max per point), so you can tighten or widen the geometry to your market.
Why this matters: strict-range engines discard perfectly good structure; free-form engines accept garbage. Soft-marking keeps the count honest while telling you visually which points are textbook and which are stretched.
3️⃣ Ghost projection — the whole remaining path drawn before it happens.
As soon as leg 0-1 is confirmed, EIE draws a dashed projection of every remaining point: 2? 3? 4? 5? A? B? C?. Each ghost point is placed inside its fib range at a position you choose (Middle of the range, Near edge, or Far edge), and spaced horizontally at step = round((b1 − b0) × coefficient) bars — i.e., the time geometry of the projection scales with the actual duration of leg 0-1. Ghost point 5? sits at extension −1.0 plus a configurable offset.
The projection is re-anchored from every newly accepted real point : once point 2 locks, the ghost path redraws starting from the real 2; once point 3 locks, from the real 3, and so on. Point 4's ghost is computed on the 2→3 grid using the best available references (real points when confirmed, ghost estimates before that).
Why this matters: you see the expected shape of the entire move — including the A-B-C correction after the impulse — while the impulse is still in wave 2.
4️⃣ Trailing invalidation level — one red line that answers "where am I wrong?".
At every state the engine maintains exactly one critical level, drawn as a dashed red line with an "INVALID + price" label:
— waiting for 1 / wave 2 in progress: point 0
— wave 3 before point 1 is broken: point 0; after the break: point 2
— wave 4: point 2
— wave 5 before point 3 is broken: point 2; after the break: point 4
— correction A/B/C: point 2
A break of this level resets the hypothesis with a named reason. The check runs every bar, before pivot processing , so a violent bar cannot both break the invalidation level and sneak a new wave point into the count on the same bar. Wick-driven pivots that slip past a close-based check are caught by a second, pivot-level guard (a pivot beyond point 2 / point 4 in the protected phases also triggers the reset). Classic Elliott rules are enforced on top: wave 2 may never retrace below point 0, wave 4 may never enter below point 2, and if wave 3 turns out shortest among 1, 3 and 5 at the moment point 5 is proposed, the count is rejected with reason W3_SHORTEST.
Why this matters: an Elliott count without a falsification level is a story, not a hypothesis. EIE makes the falsification price explicit on every bar.
5️⃣ Two-speed pivot system — stable structure, fast confirmation.
Structure and CHoCH run on the main swing length (default 10/10). Wave points 1-5 and A-C are accepted from a separate, shorter pivot stream (default 5/5, always ≤ swing length — validated at load). This decouples two jobs that a single pivot length cannot do well simultaneously: the long pivots keep the structural skeleton stable, the short pivots confirm wave points with roughly half the lag.
A dedicated backfill scan (up to ~480 bars) closes the pivot-lag gap for point 2: when point 1 locks or repositions, the engine re-scans all bars since point 1 for the true retracement extreme, so the best low/high inside the confirmation window is never missed. If price breaks point 1 before any counter-trend pivot confirmed point 2, the tracked extreme itself is accepted as point 2 and wave 3 is activated immediately.
Why this matters: one pivot length forces a trade-off between stability and speed. Two lengths plus a backfill scan give you both.
6️⃣ Repositioning logic — labels refine forward, never silently rewrite history.
Until the next wave locks, the engine allows controlled repositioning: a higher high repositions point 1 (rebuilding the grid and the point-2 box on the new geometry), a deeper pullback repositions point 2 (only until point 1 is broken — after the break, a deeper pivot is an invalidation, not a reposition), point 3 extends while wave 4 forms, point 4 deepens until point 3 is broken, point 5 extends during the correction, A deepens until B appears, B rises until C appears. Every reposition deletes and redraws only the affected segment and label, and the associated target box and its center line are rebuilt on the fresh grid — no stale geometry is left behind.
Why this matters: this is the honest middle ground between "repaints everything" and "freezes wrong labels forever". The rules for what may move, and until when, are fixed and stated.
7️⃣ OTE target boxes for points 2, 3 and 4 — the next objective is always a zone, not a guess.
When point 1 locks, a yellow box covering the point-2 fib range appears with a dashed center line at the range midpoint. When point 2 locks, the point-3 target box (on the extension side) appears. When point 3 locks, the point-4 box appears on the 2→3 grid. Each box extends forward a configurable number of bars (default 20) and its right edge snaps to the bar where the point actually forms. Box fill transparency adapts to the theme (65 dark / 55 light); the border and center line stay fully opaque.
Why this matters: "wave 4 should come" is vague. "Wave 4 is expected inside this drawn box, centered here" is actionable.
8️⃣ Explicit reset reasons + persistent CHoCH history — the chart tells you why.
Every count ends with a machine reason: FALSE_CHOCH (price broke back through point 0 before point 1 formed), BELOW_0, BELOW_W2, BELOW_W4, W3_SHORTEST, DEEP_C (correction retraced beyond point 2), TIMEOUT (optional: state lasted longer than k × leg 0-1 duration), B_ABOVE_5 (the "correction" broke above point 5 — the impulse is closed as done), or DONE (point C accepted, full cycle complete). On invalidation a ✖ marker with the reason in its tooltip is placed on the bar, and the dashboard keeps showing the last reason.
The active markup is wiped on reset — but CHoCH lines and labels live on a separate persistent layer (FIFO history, up to 100, default 50). When price later closes back through a CHoCH level, that line is clipped to the mitigation bar and turns dotted. So your chart accumulates a clean structural map of every trend change while dead counts disappear.
A special same-bar case is handled explicitly: if a reset and a fresh opposite CHoCH land on the same bar (with cooldown off), the engine wipes first, then seeds the new count on that same bar — the new hypothesis is never lost to ordering.
Why this matters: most auto-counters just vanish or redraw without explanation. EIE always states its reason, and the CHoCH map survives as context.
9️⃣ Anti-repaint discipline — confirmed pivots, close-confirmed breaks, honest Wick mode.
Three independent mechanisms:
— All pivot values are consumed only on confirmed bars: a forming real-time bar can make a pivot flicker, so transient pivot values are masked out and can never trigger an irreversible state transition. Historical bars are unaffected (they are all confirmed).
— In the default Close confirmation mode, invalidation breaks and wave-top breaks are evaluated only on the confirmed bar close — an intrabar excursion of the close cannot fire a reset that "un-happens" seconds later.
— The optional Wick mode reacts to any intrabar touch — faster, and by design irreversible within the bar. This is stated openly so you can choose speed vs. strictness.
Zone-entry events (price entering the point-2 OTE zone, the point-4 box, or tagging the −1.0 target) intentionally use wick extremes — a touch is a touch — and are one-way flags.
🔟 Theme-adaptive visual system with auto-contrast labels.
Theme is Auto-detected from the chart background (or forced Dark/Light). By default, long counts use a theme-adaptive green (dark green on light charts, bright green on dark charts) and short counts use red. If you enable custom colors, label text color is derived from the luminance of your chosen background — luma = 0.299R + 0.587G + 0.114B, threshold 140 — so digits stay readable on any shade you pick. The fib grid uses role-based color inputs (red 0.236, teal 0.705 OTE, blue retracement levels, gray round levels), all editable. Label font size is selectable from Tiny to Huge.
⚡ HOW IT WORKS — CALCULATION FLOW
Step 1 — Structure scan: Symmetric pivots (default 10/10) maintain the latest swing high and swing low; the engine also tracks the running extreme since the last swing (the future point 0).
Step 2 — CHoCH: A confirmed close through a swing level against the internal trend flips the trend and — if the engine is idle, cooled down, and the level is not locked — seeds a count: direction, CHoCH level, point 0.
Step 3 — Point 1: The first fast pivot beyond the CHoCH level becomes point 1. The 0→1 fib grid, the point-2 target box, and the full ghost projection are drawn.
Step 4 — Impulse counting: Fast counter-trend pivots propose points 2 and 4; fast with-trend pivots propose 3 and 5. Each is checked against its fib range (clean or "~"), each unlocks the next state, target boxes appear for the next objective, and the ghost path re-anchors from every real point.
Step 5 — Hard rules per bar: Before any pivot is processed, the trailing invalidation level is checked (Close or Wick mode). Wave 2 below point 0, wave 4 below point 2, a broken point 4 in late wave 5, or a shortest wave 3 all kill the count with a named reason.
Step 6 — Impulse complete: Point 5 accepted → the impulse counter increments and the engine rolls into correction tracking.
Step 7 — Correction A-B-C: A forms on a counter-trend pivot, B on a with-trend pivot (a B at or beyond point 5 closes the whole structure as B_ABOVE_5 instead), C completes the cycle → DONE.
Step 8 — Reset: On any ending — invalidation or completion — the active markup is wiped, the cooldown starts, and the engine returns to scanning. CHoCH history stays.
📖 HOW TO USE
🎯 Quick start (works even if you have never counted a wave):
1. Add the indicator to a clean chart. Nothing to configure — defaults are ready to use.
2. Wait for a CHoCH label. That is the engine saying: "the trend character just changed, I am watching for a new impulse here."
3. When labels 0 and 1 appear, the count is live. The dashed gray path with 2? 3? 4? 5? A? B? C? is the expected roadmap of the entire move.
4. Watch the yellow box — that is where the next wave point is expected. The dashed line inside it is the center of the zone.
5. Keep one eye on the red dashed INVALID line at all times. If price breaks it, the count is over — a ✖ appears, the markup clears, and the engine starts hunting for the next CHoCH. Hover the ✖ to read the exact reason.
👁️ Reading the chart:
— 🟢 Green numbered labels (0, 1, 2, 3, 4, 5) = accepted impulse points of a long count; red labels = a short count. Letters A, B, C = the correction.
— A label with ~ (like "2~") = the point is accepted, but it landed outside its textbook fib range — the count continues, treat it with slightly more caution.
— Solid colored path = confirmed structure. Dashed gray path with "?" labels = the ghost projection of what is still expected.
— 🟡 Yellow boxes = target zones for points 2, 3 and 4, each with a dashed center line.
— Dotted horizontal grid = the Fibonacci grid of leg 0-1 (retracements 0.236…1.0 above, extensions −0.5 / −0.618 / −1.0 below), each level labeled with its ratio and price.
— 🔴 Red dashed line + "INVALID price" = the trailing invalidation level of the current count.
— Dashed horizontal CHoCH lines = historical structure breaks; a line that turns dotted has been mitigated (price closed back through it).
— ✖ = the count was invalidated on this bar (reason in the tooltip).
📊 Dashboard fields:
— State: current phase (Scanning / CHoCH · wait 1 / Wave 2…5 / Corr · A-B-C).
— Direction: Long, Short, or — when idle.
— Invalidation: the current critical price.
— Last Reset: why the previous count ended (reason, DONE, or B_ABOVE_5). Resets on chart reload.
— Impulses: completed 5-wave impulses on the loaded history. Resets on chart reload.
— TF: chart timeframe. Version: engine version.
🔧 Tuning guide:
— Counts appear too rarely: lower Swing Detection Length (structure forms faster, more CHoCH seeds) — or the market is simply ranging without character changes.
— Too many counts die instantly (FALSE_CHOCH / BELOW_0): raise Swing Detection Length, or add a Cooldown of 5-20 bars so the engine skips the chop right after a failed count.
— Points confirm too slowly: lower Point Confirmation (min 1); remember it must stay ≤ Swing Detection Length.
— Too many "~" soft marks: widen the fib ranges for those points — your market may simply run hotter than the defaults.
— Old counts hang around in dead phases: set Timeout k > 0 (e.g. 3.0) — any state lasting longer than k × the duration of leg 0-1 resets automatically.
— Chart feels crowded: toggle off the Fib Grid, OTE Boxes, or the Projection independently; reduce Historical CHoCH; shrink label font size.
⚙️ KEY SETTINGS
⚙️ Main Settings:
— Swing Detection Length (default 10): pivot length for structure and CHoCH. Higher = larger structure, fewer seeds.
— Point Confirmation, bars (default 5): the separate short pivot used to accept wave points. Must be ≤ swing length (validated).
— Breaks: Invalidation Mode (default Close): Close = confirmed bar close beyond the level (non-repainting); Wick = any intrabar touch (instant, irreversible within the bar).
📐 Point Ranges (fib): min/max expectation range per point — Point 2 (0.5–0.705), Point 3 (−0.5…−0.618), Point 4 (0.5–0.705 on the 2→3 grid), Point 5 (−0.618…−1.0), Point B (−0.5…−0.618), Point C (0–0.236). All validated at load (2 and 4 must be inside (0,1); 3, 5, B must be negative; C inside [0,1); no zero-width ranges).
👻 Ghost Projection:
— Show Projection (on), Point Inside Range (Middle / Near / Far), Time Step Coef (default 1.0 × leg 0-1 duration), 5?: Offset From −1.0 (default 0.05).
♻️ Reset:
— Cooldown After Reset, bars (default 0 = off) and Timeout, k × leg 0-1 (default 0 = off; in the wait-for-1 phase the timeout scales on swing length instead, since no leg exists yet).
🎨 Visual Settings: Theme (Auto / Dark / Light), Fib Grid toggle, OTE Boxes toggle, CHoCH layer toggle, Path Width (2), Box Length Forward (20), Historical CHoCH max (50), Label Font Size (Tiny…Huge), Watermark toggle.
📏 Grid Levels: individual on/off for 0.236, 0.382, 0.5, 0.618, 0.705, 0.786, 0.886, 1.0, −0.5, −0.618, −1.0.
🎨 Colors: Use Custom Colors switch (off = theme-adaptive defaults), long/short point label backgrounds (text auto-contrasts), target box color, path and ghost colors, bull/bear CHoCH colors, and role-based fib grid colors.
📊 Dashboard: on/off, position (5 anchors), font size (the version row renders one step smaller).
🔔 ALERTS
Ten alert conditions covering the full lifecycle:
— 🟢 1. CHoCH + projection — CHoCH confirmed, movement projection built
— 🟡 2. Price in W2 OTE — price entered the point-2 zone
— 🟢 3. Point 2 accepted
— 🟢 4. Break of point 1 — wave 3 active
— 🟡 5. Price in W4 box
— 🟢 6. Break of point 3 — wave 5 active
— 🎯 7. Target −1.0 reached
— 🟢 8. Impulse complete — point 5 locked
— 🎯 9. Target C — correction complete, full cycle done
— 🔴 10. Invalidation — hypothesis reset
In addition, the engine fires dynamic alert() messages on every reset and on B_ABOVE_5 completion, including the reason text. In Close mode these announce on confirmed bar close; in Wick mode once per bar.
⚠️ IMPORTANT NOTES
— 🚫 No repainting of confirmed structure. Pivots use equal left/right lookback and their values are consumed only on confirmed bars; CHoCH breaks require a confirmed close; in the default Close mode, invalidation and wave-top breaks are evaluated on confirmed closes only. A pivot is, by nature, confirmed N bars after the actual extreme — the indicator draws from the confirmed bar backward to the true swing point. This is delayed confirmation, not repainting of settled values.
— 📐 Controlled repositioning is part of the design. Until the next wave locks, the latest point may legitimately move to a more extreme pivot (e.g., point 1 to a higher high). The rules for what may move, and until when, are fixed and described above. Wick mode reacts intrabar by design and is irreversible within the bar.
— 📊 The Impulses counter and Last Reset field are computed on loaded chart history and reset when the chart reloads.
— ⚖️ EIE counts one impulse degree at a time from the latest CHoCH. It does not label nested sub-waves, diagonals, or complex W-X-Y corrections — it is a focused impulse + zigzag engine, and the fib ranges reflect one practical interpretation of Elliott guidelines, which you can re-tune.
— 🛠️ This is a wave-counting and projection tool, not an automated trading system. It identifies structure, projects expected zones, and shows the invalidation price — trade decisions remain yours.
— 🌐 Works on all markets (crypto, forex, stocks, indices, commodities) and all timeframes. Penunjuk

Hyperliquid-Ready Webhook Strategy TemplateMost webhook templates get you 80% of the way there — then your bot double-fills an order at 3am and you learn about the missing 20%. This template IS the missing 20%.
What this is
An open-source strategy template whose real value is the alert payload: a production-grade JSON webhook message with the fields most templates skip. The included strategy (EMA 21/55 cross + RSI filter, ATR-based SL/TP) is a simple demo — swap in your own logic. It happens to test reasonably on BTC 4H, but the point of this script is the plumbing, not the entry logic. Bring your own edge.
The payload — and why each field exists
→ id — unique per event (ticker + timeframe + action + bar time). Your backend treats this as an idempotency key: TradingView sometimes retries the same alert when your server responds slowly. Dedupe by id (one Redis SET NX) and you'll never double-fill. The action is part of the id so an entry and its exit on the same bar can never collide — a bug I caught in live testing of this exact script.
→ ts — fire-time timestamp via {{timenow}}. Reject alerts older than N seconds so a delayed or replayed webhook can't trade a stale price.
→ secret — replace with a long random token and verify it server-side (or better, HMAC the body). Anyone who finds your webhook URL can POST to it. This field is your lock.
→ reduce_only — true on exits, so a close can never accidentally flip you into a new position if state desyncs.
Also included: leverage and qty fields for your backend (cap leverage server-side too — never trust the client alone), and an on-chart payload preview table so you can eyeball your exact JSON before wiring real money.
Setup (2 minutes)
Add to chart (crypto perps: BTC/ETH/SOL, 15m–4H)
Create alert → condition: this strategy → "Order fills events" → message box: {{strategy.order.alert_message}}
Point the alert's webhook URL at your execution backend or bridge
Works with any TradingView→exchange webhook bridge. Important: alerts snapshot the script when created — if you edit the code, delete and re-create your alerts.
Who I am
I build custom TradingView→Hyperliquid execution pipelines (Pine Script v6, non-custodial agent wallets). If you want this wired to live execution or adapted to your strategy, links are in my signature. Strategi