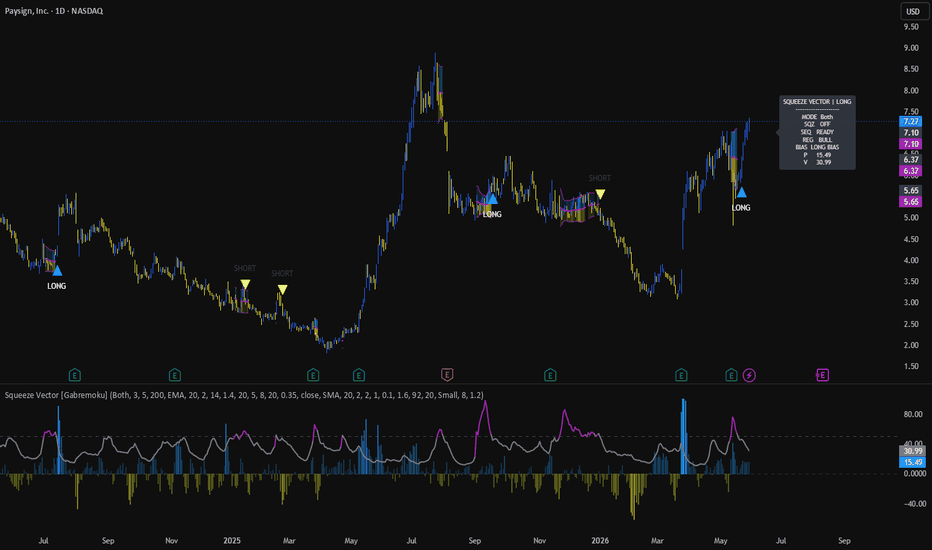
Squeeze Vector [Gabremoku]Squeeze Vector is a squeeze-based volatility breakout tool that combines Bollinger/Keltner compression detection, directional pressure flow, and a first-expansion state machine to help traders identify high-probability post-squeeze breakout setups.
The core idea is simple: compression precedes expansion. When Bollinger Bands shrink inside Keltner Channels, the market is coiling — and when that squeeze releases, the first directional signal can carry strong momentum. This script gives that process a structured visual and logical framework.
Core Concept — Squeeze → Release → Direction
A BB/KC squeeze occurs when Bollinger Bands, which reflect price volatility through standard deviation, contract inside Keltner Channels, which reflect typical range through ATR. This gap between the two envelopes is used as a proxy for volatility compression.
When BB width becomes smaller than KC width, the script identifies a Squeeze state. When it releases, the script enters an Armed state and opens a short post-squeeze window during which it looks for the first valid directional expansion.
Importantly, the squeeze release alone does not confirm direction. That is why the script adds multiple expansion confirmation filters before triggering a signal.
What it shows
Squeeze Vector Oscillator — a single line that rises as BB/KC compression increases. When it crosses above 50, the squeeze is active. The oscillator turns purple during squeeze states for fast visual identification.
Pressure Flow Histogram — a volume-weighted directional pressure value that reads where price closed within the candle range and weights it by volume relative to its moving average. Positive values indicate bullish pressure, negative values indicate bearish pressure.
Bollinger Overlay on Price — during squeeze states, the script renders Bollinger Bands directly on the main chart with gradient fills, making it easy to see where price is relative to the compressed structure.
LONG / SHORT signals — primary directional signals are placed on the main chart after a post-squeeze expansion bar meets all required conditions. Optional lighter repeat markers can be shown for follow-through confirmation.
Dashboard with live checklist — the on-chart dashboard shows the current state, regime, pressure, vector value, and a 6-point checklist for both long and short setups, with filled/empty circles to show how many conditions are currently met.
Signal Logic
The signal engine works as a state machine with three phases:
Squeeze — BB/KC compression is active. No signal is generated. The dashboard shows SQUEEZE.
Armed — the squeeze just released. The script opens a short expansion window and waits for directional confirmation. The dashboard shows ARMED.
Expansion signal — within the expansion window, if a valid directional bar forms with sufficient pressure, body size, and break condition, a LONG or SHORT label is placed on the main chart.
Signal direction is confirmed by checking:
Basis side: price above or below the BB basis
Pressure: smoothed directional pressure above threshold
Strong pressure: optional stronger filter
Body quality: minimum body-to-candle-range ratio
Break condition: higher high or lower low
Regime: optional EMA 200 trend filter
When both long and short conditions are simultaneously valid, the stronger pressure side wins. If pressure is equal, raw pressure bias decides.
States and Dashboard
The dashboard tracks the full machine at a glance:
Row Content
SQZ Squeeze ON / OFF
SEQ ARMED or READY
REG Trend regime (BULL / BEAR / OFF)
BIAS Current directional pressure bias
P Pressure Flow value
V Vector Oscillator value
Checklist 6-point LONG and SHORT condition matrix
The checklist can be set to appear only during Squeeze or Armed states to reduce visual noise when no setup is forming.
Features
✅ Bollinger/Keltner squeeze detection via ratio oscillator
✅ Volume-weighted directional pressure flow
✅ Post-squeeze first expansion state machine
✅ Armed → signal transition logic
✅ 6-point entry checklist for both long and short
✅ EMA 200 regime filter
✅ Bollinger overlay with gradient fill during squeeze
✅ LONG / SHORT signal labels on main chart
✅ Optional follow-through repeat markers
✅ Repeat window filter to suppress signal clustering
✅ Strategy mode: Long, Short, or Both
✅ Fully configurable dashboard with size and offset settings
✅ Alert conditions for BUY, SELL, and squeeze activation
How to use
A practical workflow:
Watch for the Vector Oscillator to cross above 50 and turn purple — that is the squeeze state.
When it releases below 50, the dashboard switches to ARMED.
In the expansion window, check the checklist: more filled circles on one side indicate stronger directional alignment.
A LONG or SHORT label confirms a valid first expansion signal.
Use the Pressure Flow histogram to gauge how strong and consistent the directional push is.
The squeeze release alone is not a signal. Direction is only confirmed when the expansion bar quality, pressure, and structure checks all align.
Notes
Like all squeeze-based tools, Squeeze Vector is most effective when used alongside price structure context. Squeezes release into strong moves, but not every release produces a sustained trend — volume, higher timeframe context, and support/resistance levels can all affect follow-through quality.
Author: Gabremoku
Pine Script v6 Penunjuk
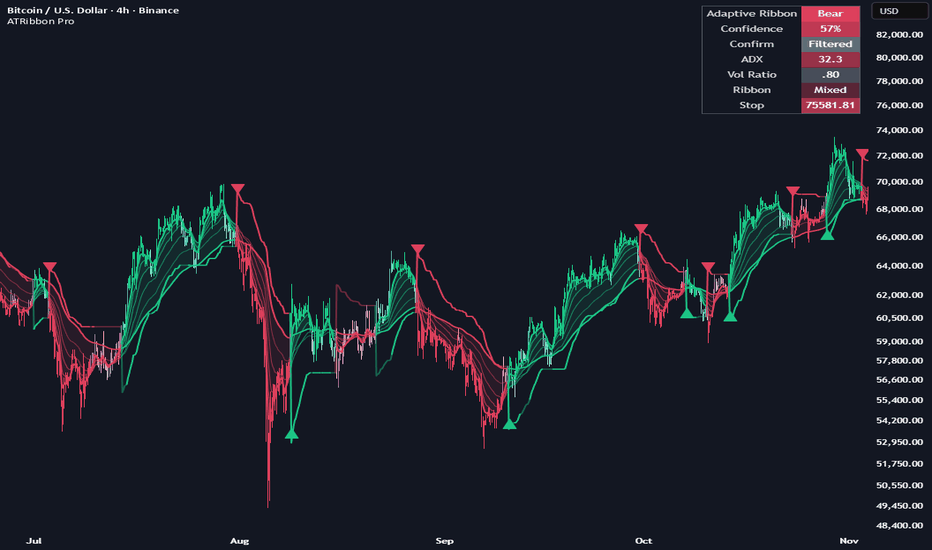
Adaptive Trend Ribbon [Alpha Extract]A sophisticated adaptive trend-following framework that combines volatility-responsive moving averages, ribbon stack analysis, ATR-based trend rails, ADX confirmation, pullback continuation signals, and a real-time confidence dashboard into one complete market regime tool. The indicator is designed to identify bullish and bearish trend environments, filter weak conditions, highlight confirmed trend flips, and provide structured stop guidance through an adaptive ATR rail. By adjusting ribbon sensitivity based on current volatility, the system aims to stay responsive during expansion phases while remaining smoother during quieter market conditions.
🔶 Adaptive Volatility-Based Ribbon Engine
Implements a multi-layer adaptive EMA ribbon that automatically modifies its effective moving-average lengths based on current volatility conditions. When volatility expands, the ribbon becomes more responsive by shortening its dynamic length. When volatility contracts, the ribbon lengthens to reduce noise and avoid unnecessary whipsaw.
volRatioRaw = atrAverage > 0 ? atr / atrAverage : 1.0
volRatio = clamp(volRatioRaw, 0.35, 2.75)
emaFast = adaptiveEma(src, baseFast, volRatio, adaptStrength)
This creates a trend ribbon that adapts to the market environment instead of relying on fixed moving-average behaviour across all conditions.
🔶 Six-Layer Trend Structure
Uses six adaptive moving averages ranging from fast to anchor length to define market structure across multiple trend speeds. The ribbon includes fast, mid, slow, and anchor components, allowing traders to see whether short-term momentum is aligned with broader trend direction.
A clean bullish trend forms when the ribbon is stacked from fastest above slowest, while a clean bearish trend forms when the ribbon is stacked from fastest below slowest. Mixed ribbon conditions indicate compression, transition, or weaker directional conviction.
🔶 Bullish & Bearish Stack Detection
Identifies strong directional alignment through full ribbon stack confirmation. Bullish stack conditions require every faster ribbon layer to sit above the slower layer beneath it, while bearish stack conditions require the opposite alignment.
This gives traders a simple way to distinguish clean trend environments from sideways or indecisive price action.
🔶 ATR Trend Rail System
Features a built-in ATR-based trend stop that acts as the main regime rail. The rail flips direction when price breaks through the active stop level, creating a clear bullish or bearish trend state.
longCandidateStop = railBasis - atr * atrMult
shortCandidateStop = railBasis + atr * atrMult
railDirection := close < trendStop ? -1 : 1
The stop can be based on the ribbon midline, close, or HL2, giving traders flexibility in how the trend rail is anchored.
🔶 Regime Flip Signal Logic
Generates long and short signals when the trend rail flips direction and the confirmation conditions are satisfied. A bullish signal occurs when the regime flips into bullish structure, while a bearish signal occurs when the regime flips into bearish structure.
Signals are filtered through ADX and directional movement confirmation when enabled, helping reduce low-quality flips during weak or choppy market conditions.
🔶 ADX & Directional Movement Confirmation
Integrates ADX confirmation to measure whether the market has enough directional strength to justify a trend signal. The system also checks directional movement by comparing +DI and -DI, allowing bullish regimes to favour positive directional pressure and bearish regimes to favour negative directional pressure.
This confirmation layer helps separate true trend expansion from random price movement.
🔶 Pullback Continuation Alerts
Includes optional pullback continuation logic designed to identify trend resumption after price interacts with the adaptive ribbon. When price pulls into the ribbon area and then closes back in the trend direction, the system can trigger continuation alerts.
This is useful for traders who prefer entering after a trend has already been established rather than only trading the initial regime flip.
🔶 Confidence Scoring Framework
Calculates a real-time trend confidence score by combining multiple components of trend quality, including ribbon stack alignment, price position relative to the ATR rail, ADX strength, directional movement, and spread between fast and anchor ribbon layers.
The score provides a quick snapshot of how strong and confirmed the current trend environment is.
🔶 Dynamic Trend Coloring System
Uses adaptive color logic to visually represent bullish, bearish, and neutral/mixed conditions. Candles, ribbon lines, fills, the ATR stop rail, and the status panel all update according to the current regime.
When ADX confirmation is enabled but the filter has not passed, the system fades the trend color to show that the regime exists but confirmation is weaker.
🔶 Real-Time Status Panel
Features a compact dashboard that displays the most important trend information directly on the chart. The panel includes:
• Current regime
• Confidence percentage
• Confirmation status
• ADX value
• Volatility ratio
• Ribbon stack condition
• Active stop level
This allows traders to quickly assess whether the market is bullish, bearish, filtered, mixed, or entering a stronger trend phase.
🔶 Flexible Risk Rail Basis
Allows the ATR stop rail to be calculated from different price references depending on the trader’s preferred style. Ribbon Mid creates a smoother institutional-style trend rail, Close makes the rail more reactive, and HL2 provides a balanced price reference.
This flexibility makes the indicator suitable for both faster trend-following styles and slower swing-trend systems.
🔶 Clean Overlay Visual Design
Displays the full adaptive ribbon directly on price with optional candle coloring, background regime shading, trend stop plotting, and signal markers. The ribbon uses layered transparency to maintain chart readability while still showing the strength and direction of the trend structure.
The result is a clean visual layout that can be used as a primary trend framework or as a confirmation layer alongside other systems.
🔶 Comprehensive Alert System
Includes alerts for the most important trend events:
• Adaptive Ribbon Long
• Adaptive Ribbon Short
• Bullish Pullback Continuation
• Bearish Pullback Continuation
• Long Trend Exit
• Short Trend Exit
These alerts allow traders to monitor trend flips, pullback continuations, and invalidation events without needing to constantly watch the chart.
🔶 Why Choose Adaptive Trend Ribbon ?
This indicator provides a complete adaptive trend-following environment by combining responsive moving-average structure, volatility-adjusted behaviour, ATR-based trend rails, ADX confirmation, continuation logic, and live confidence scoring. Instead of relying on a single moving average or fixed trend signal, it evaluates multiple layers of trend quality before confirming direction.
The adaptive ribbon helps traders understand whether the market is strongly aligned, weakening, transitioning, or mixed. The ATR rail provides a clear trend invalidation reference, while the confidence panel gives immediate context on whether the trend has enough structure and strength behind it. Perfect for trend-following traders, swing traders, momentum traders, and systematic traders who want a cleaner way to identify confirmed bullish and bearish regimes with built-in risk guidance. Penunjuk
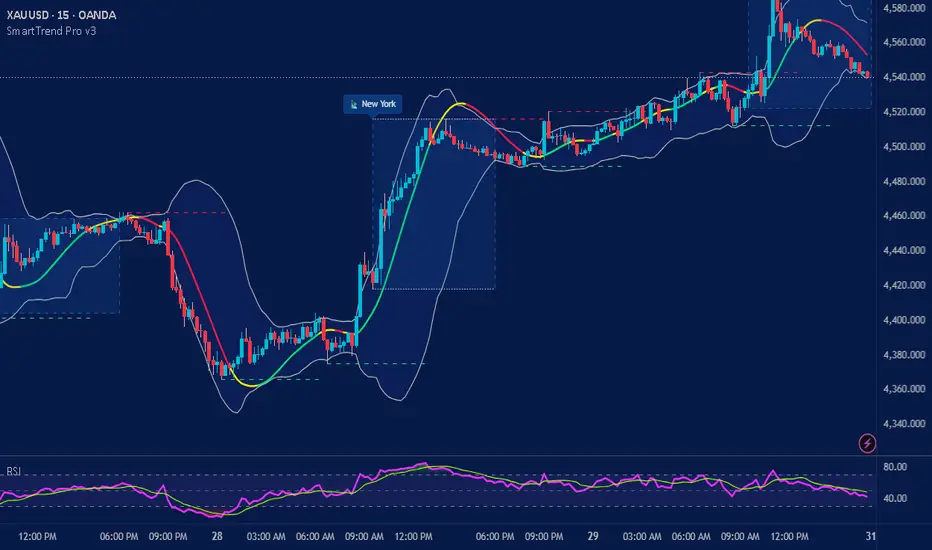
SoSa Smart Trend ProSoSa Smart Trend Pro
Advanced All-in-One Trading Indicator
SoSa Smart Trend Pro is a powerful institutional-grade trading indicator designed to help traders identify high-probability opportunities through advanced trend analysis, volume confirmation, momentum filters, Fair Value Gap detection, market structure analysis, and session-based trading tools.
Built for Forex, Stocks, Futures, Indices, and Cryptocurrency markets, SoSa Smart Trend Pro combines multiple professional trading concepts into a single indicator, allowing traders to make faster, smarter, and more confident decisions.
🚀 Core Features
📈 Advanced Trend Detection
Choose from multiple moving average types:
EMA
SMA
WMA
VWMA
RMA
HMA
DEMA
TEMA
Bollinger Basis
The moving average dynamically changes color to instantly identify market conditions:
🟢 Bullish Trend
🔴 Bearish Trend
🟡 Neutral Market
🕯️ Smart Engulfing Pattern Detection
Automatically detects:
Bullish Engulfing Patterns
Bearish Engulfing Patterns
Advanced body-size filtering helps eliminate weak setups and highlights stronger reversal opportunities.
📊 Volume Confirmation System
Filters market signals using real-time volume analysis.
Features include:
Volume SMA comparison
Adjustable volume multiplier
High-volume breakout confirmation
Helping traders avoid low-quality entries during weak market participation.
⚡ Institutional Fair Value Gap Detection
Automatically identifies market imbalances used by professional traders.
Includes:
Bullish Fair Value Gaps
Bearish Fair Value Gaps
ATR-based minimum gap sizing
Adjustable zone extensions
Dynamic FVG management
Ideal for identifying retracements, continuation setups, and liquidity zones.
🗽 New York Session Tracker
Monitor the most active trading session with:
Automatic New York Session Box
Session High & Low Tracking
Session Labels
Extended High/Low Levels
Perfect for traders who focus on market open volatility and liquidity sweeps.
🔵 Dynamic Support & Resistance Levels
Automatically plots key market structure zones based on pivot analysis.
Benefits:
Identifies potential reversal areas
Highlights important reaction zones
Improves entry and exit timing
📉 RSI Momentum Filter
Built-in Relative Strength Index analysis:
Custom RSI Length
Overbought Detection
Oversold Detection
Trade Confirmation Filter
Adds an additional layer of momentum validation.
〰️ MACD Confirmation Engine
Uses MACD crossover and histogram strength to confirm momentum.
Detects:
Bullish Momentum
Bearish Momentum
Trend Continuation Opportunities
Reducing false entries and increasing signal quality.
〰️ Bollinger Bands Integration
Monitor market volatility with built-in Bollinger Bands.
Features:
Adjustable Length
Adjustable Deviation Multiplier
Volatility Expansion Detection
Useful for breakout and mean-reversion strategies.
🎯 Smart Buy & Sell Signals
Signals are generated only when multiple confirmations align.
Signal conditions may include:
✅ Trend Direction
✅ Moving Average Confirmation
✅ Engulfing Pattern Detection
✅ Volume Confirmation
✅ RSI Validation
✅ MACD Confirmation
This multi-layer approach helps filter market noise and improve trade quality.
📊 Confidence Score Technology
Every trade signal includes a confidence rating from 0% to 100%.
The score is calculated using:
Trend Strength
Volume Activity
Fair Value Gap Confirmation
Engulfing Patterns
MACD Momentum
Price Structure Alignment
Allowing traders to quickly assess the quality of each setup.
🖥️ Professional Market Dashboard
The integrated information panel displays:
Market Trend
Volume Status
RSI Condition
MACD Status
Fair Value Gap Activity
New York Session Status
Confidence Score
Current Trading Signal
All critical market information is available in one location.
🔔 Real-Time Trading Alerts
Receive alerts for:
Buy Signals
Sell Signals
RSI Overbought Conditions
RSI Oversold Conditions
Bullish FVG Detection
Bearish FVG Detection
New York Session Open
Stay connected to the market without constantly watching the chart.
💎 Why Traders Choose SoSa Smart Trend Pro
✔ Combines multiple indicators into one
✔ Reduces chart clutter
✔ Improves signal quality
✔ Identifies institutional market imbalances
✔ Tracks trend, momentum, volume, and volatility
✔ Provides confidence-based trade scoring
✔ Suitable for scalpers, day traders, swing traders, and position traders
✔ Works across Forex, Crypto, Stocks, Futures, and Indices
Trade Smarter. Trade With Confidence.
SoSa Smart Trend Pro is built to provide a complete market analysis solution, combining trend identification, momentum confirmation, institutional concepts, and intelligent signal generation into one professional-grade trading tool. 📈🔥
Tagline:
"See the Trend. Trust the Signal. Trade with Confidence." 🚀 Penunjuk

Gaspard98 - Carter Squeeze On Chart / Signals# Gaspard98 — Carter Squeeze On Chart / Signals
## Overview
The **Carter Squeeze** is an on-chart implementation of John Carter's well-known *TTM Squeeze* concept, rebuilt as a clean overlay with discrete **Buy / Sell signals**. It detects periods of volatility compression — when a market coils up before an expansion move — and fires a directional signal the moment that energy is released.
Unlike a classic momentum-pane squeeze, everything here lives directly on the price chart: compression state, momentum bias, trend, and entries are all visible at a glance, with no second window to monitor.
---
## The Concept Behind the Squeeze
Carter's method is built on a single, elegant observation: **when Bollinger Bands contract inside the Keltner Channels, the market is in a low-volatility "squeeze."** Volatility is mean-reverting, so a tight squeeze tends to be followed by a sharp expansion. The trade is not the squeeze itself — it's the *release* (the "fire"), taken in the direction of momentum.
This script measures that compression at **three intensity levels** (TTM Squeeze Pro style) rather than a single on/off state, so you can distinguish a mild coil from an extreme one.
---
## How It Works
**1. Compression detection**
Bollinger Bands (default 20, 2.0) are compared against three Keltner Channels built from the average True Range, at multipliers 2.0 / 1.5 / 1.0:
- **No squeeze** — bands are outside the widest Keltner (market is expanding)
- **Low compression** — mild coil
- **Mid compression** — moderate coil
- **High compression** — the tightest state; bands sit inside the narrowest channel
**2. Momentum**
A linear-regression oscillator measures price relative to the mid-channel (the classic Carter momentum formula). Its sign defines directional bias (bullish / bearish) and its slope defines whether momentum is accelerating or fading.
**3. Signals**
The default trigger is the **squeeze fire**: the bar where compression releases. A **BUY** prints if momentum is positive at the release, a **SELL** if it is negative. An optional alternative mode triggers on a **momentum zero-cross** instead.
---
## Signal Logic & Filtering
- **Trigger — Squeeze fire** (default): entry on the release of a compression, in the direction of momentum. This is the purest expression of Carter's method.
- **Trigger — Momentum cross**: entry when momentum crosses the zero line, regardless of squeeze state.
- **Require accelerating momentum** (default on): only allows a BUY when momentum is rising and a SELL when it is falling, filtering out weak, fading releases.
- **Confirm on close** (default on): signals evaluate only on closed bars, making them **non-repainting**. Disable it for faster, intrabar-reactive signals at the cost of mid-bar flicker.
---
## Visual Features
- **Buy / Sell labels** plotted directly below / above the bars.
- **Squeeze state dots** along the bottom of the chart, color-coded by intensity:
- green = no squeeze
- blue = low compression
- orange = mid compression
- red = high compression
- **Background tint** while a squeeze is active (color reflects intensity).
- **Candle coloring** driven by momentum (bright = accelerating, faded = fading).
- **Trend line** (the basis) colored by momentum bias.
- **Status table** in the top-right corner showing squeeze level, momentum value + direction, current bias, and the last signal.
- Optional **Bollinger + Keltner band overlay** so you can visualize the compression itself.
---
## Settings
**Squeeze**
- Source, Bollinger length & multiplier
- Keltner length and the three compression multipliers (low / mid / high)
**Signals**
- Trigger mode (Squeeze fire / Momentum cross)
- Require accelerating momentum
- Confirm on close (non-repaint)
**Visual**
- Toggle bands, background, dots, candle coloring, trend line, status table
- Custom Buy / Sell colors
---
## How to Use It
1. Watch for a tightening sequence — dots moving from green toward orange and red signal building compression.
2. The **brighter the candles** and the larger the momentum value, the stronger the directional conviction.
3. A signal prints when the squeeze releases. Treat the release as a *timing* tool, not a standalone system — combine it with structure, higher-timeframe trend, and your own risk management.
4. Tighter compressions (red) before a fire tend to precede the cleanest expansions.
Works on any market and timeframe (futures, indices, FX, crypto, equities). Higher timeframes generally yield fewer but cleaner signals.
---
## Alerts
Two alert conditions are built in — **BUY** and **SELL** — ready to attach in TradingView's alert dialog. The default message embeds the ticker and close price and can be reshaped for any webhook or automation endpoint.
---
## Notes
- Default Bollinger / Keltner parameters follow Carter's classic 20-period configuration; adjust to your instrument's volatility profile.
- With *Confirm on close* enabled, signals are fixed once the bar closes and do not repaint.
---
*This indicator is a technical-analysis tool provided for educational and informational purposes only. It is not financial advice and does not guarantee any outcome. Trading involves substantial risk of loss — always test thoroughly and manage risk according to your own plan.* Penunjuk

Guppy MMA Mean Reversion SignalsThe Guppy MMA Mean Reversion System is a trend-following mean reversion tool designed to identify high-probability pullbacks within established trends. By combining the classic Guppy Multiple Moving Average (GMMA) with volatility, volume, and momentum filters, this script aims to reduce the "noise" often found in standard moving average cross strategies.
The Concept: Why this Works
Standard GMMA indicators are excellent for visualizing trend strength but often lack precise entry triggers or filters to avoid entering during periods of low volume or extreme exhaustion. This script addresses these limitations by integrating four distinct analytical components:
- GMMA Ribbons (Trend & Reversion Zones) : We use two groups of EMAs (Short-term and Long-term). The Long-term group defines the "institutional" trend. Our entry logic looks for price to revert from the short-term trend back into the long-term trend zone—a classic sign of a healthy pullback.
- CVD Confluence (Volume Confirmation) : Using Cumulative Volume Delta (CVD) based on candle-body delta approximations, the script ensures that volume flow supports the entry direction. This prevents entering pullbacks that lack the necessary buying/selling pressure to resume the trend.
- ATR Volatility Filter (Statistical Spacing) : To avoid "choppy" entries, this filter requires the price to be at a statistically significant distance from the EMA based on market volatility (ATR). This ensures you are entering at a true "discount" rather than in a sideways market.
- RSI Exhaustion Filter (Momentum Safety) : We utilize RSI to ensure that a reversion hasn't reached an overextended state. For example, it prevents buying a pullback if the RSI indicates the asset is already in an overbought exhaustion phase.
How to Use
- Long Entries (Green Circles) : Triggers when the Long-term ribbon is bullish, and price pulls back to touch the Long-term EMA group, provided the CVD, ATR, and RSI conditions are met.
- Short Entries (Red Circles) : Triggers when the Long-term ribbon is bearish, and price rallies to touch the Long-term EMA group, filtered by volume and momentum.
- Exits (Labels) : Exit signals appear when price successfully reverts back to the "fast" Short-term group, marking the completion of the mean reversion move.
Key Features & Customization
- Independent Toggles : You can independently turn on/off buy signals, sell signals, and their respective exits to suit your specific trading style (e.g., only trading the long side).
- Signal Cooldown : Includes a customizable "bar count" cooldown to prevent multiple overlapping signals during high-volatility periods.
- Comprehensive Settings : Fully adjustable EMA lengths, ATR multipliers, and RSI thresholds to adapt the system to different timeframes and asset classes (Crypto, Forex, Stocks).
Settings Guide
- Use ATR Filter : Increase the multiplier for more conservative, wider entries.
- Use CVD Filter : Enable to ensure volume delta is trending with your entry.
- Use RSI Filter : Helps avoid "catching falling knives" by filtering out trades during extreme momentum spikes. Penunjuk

Penunjuk

Bollinger Band [scoopup]Overview
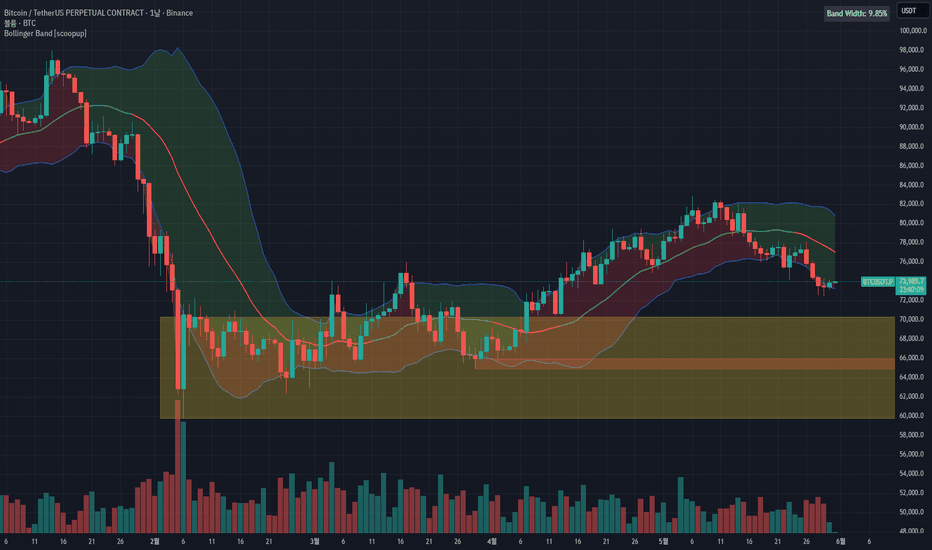
A Bollinger Bands–based indicator that shows trend direction (up/down) through the basis line color, displays band width (volatility) as a percentage, and marks the most recent meaningful lows (demand zones) on the weekly and daily timeframes as boxes. It lets you view statistical volatility and the real low zones where buying previously stepped in — all on a single chart.
Default settings are Length 21 and StdDev 1.618, based on the Fibonacci number (21) and the golden ratio (1.618).
Components
1. Bollinger Bands (Upper / Basis / Lower)
Defaults: Length 21, StdDev 1.618
Upper band, basis (middle), and lower band. The bands widen and narrow with volatility.
2. Basis Line Trend Color (Daily-based)
The color of the middle basis line indicates trend direction.
Logic: over a set lookback, it compares the cumulative size of the "close-to-lower" area (red) versus the "upper-to-close" area (green).
Red area dominant → uptrend → basis line GREEN
Green area dominant → downtrend → basis line RED
The longer the close stays near the lower band (larger red area), the more it is read as base-building before a move higher.
This color is always calculated from Daily data, regardless of the chart timeframe. Whether you view it on the 15m, 1h, or 4h chart, the daily trend color stays consistent.
3. Fill
Upper band ↔ close: semi-transparent green
Close ↔ lower band: semi-transparent red
Lets you quickly read where the close sits within the bands.
4. Band Width (%)
Formula: (Upper − Lower) / Basis × 100
Displays the current band width in a corner table as Band Width: X.XX%.
Lower = volatility contraction (squeeze) → often precedes a large move; higher = volatility expansion.
The Data Window also shows band width % and band width (price difference), including on historical bars.
5. Recent Lows
Weekly recent low = yellow box / Daily recent low = red box
Shows only the most recent pivot (swing) low that sits below the current close. (Lows above the close are skipped; if the latest low is above the close, the prior low is used instead.)
Box height spans the low ↔ the close at that point, and extends to the right to show a still-valid support/demand zone.
How to Read It
Basis green + close near the lower band → watch for a potential bounce after base-building.
Basis red + close near the upper band → watch for overextension/pullback risk.
Band Width % contracting (squeeze) → watch for an upcoming volatility expansion.
Recent low boxes (yellow/red) act as first support candidates on a pullback. A close below the box signals support failure.
Key Settings
Bollinger Bands: Source, Length (default 21), StdDev (default 1.618), Band Color / Width / Style
Basis Line: Show Basis, Basis Width, Ratio Length, Up / Down Color
Fill: Show Fill, Upper / Lower Fill Transparency
Band Width: Show Band Width %, Table Position, Text Size
Recent Lows: weekly/daily toggles, Pivot Length, Box Color
Tips
This is a supporting tool for reading trend direction + volatility + support zones together, not a standalone trade signal.
Reliability increases when the daily trend color and a recent low box line up in the same area.
Adjust StdDev and Ratio Length to fit each instrument's volatility.
Disclaimer
This indicator is for reference only and does not guarantee trading profits. All trading decisions and responsibility rest solely with the user. Penunjuk
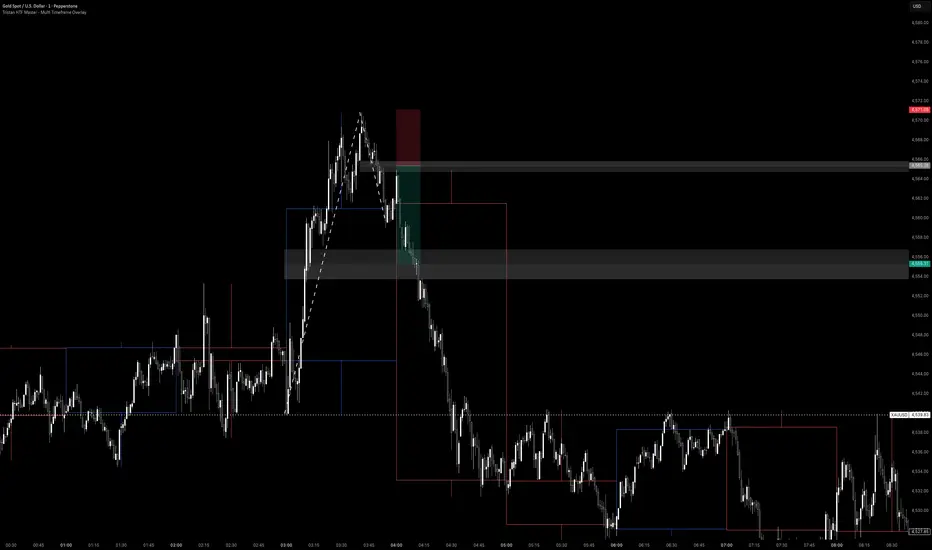
Tristan HTF Master - Multi Timeframe OverlayWelcome to my indicator, a powerful multi-timeframe (MTF) visualization tool designed specifically for traders who rely on "Candle Behavior Strategies" and precise timing strategies. I use this indicator as an orientation
If you base your trades on the internal mechanics of Higher Timeframe (HTF) candles—such as tracking the open, high, low, and close of a 1-hour candle while executing on the 1-minute or 5-minute chart—this indicator is built for you.
The Core Concept: Time-Based Candle Behavior: Depending on your strategy in my opinion it is best suited for Time Based Strategies.
This indicator was developed with a specific structural trading strategy in mind (heavily inspired by concepts of "Tom Trades" Candle Behavior Reversal. So respects to him. The core philosophy revolves around observing how a Higher Timeframe candle (e.g., the 1H candle) behaves during its lifespan.
Often, in ranging or consolidating markets, a 1H candle will exhibit a distinct pattern:
First 30 Minutes (The Trap): The market creates a sudden Liquidity Sweep accompanied by an Overextension. This often traps breakout traders.
The Reversal (At ~30 Mins): Right around the midpoint of the candle's lifespan, the market loses momentum, reverses, and creates a Type 3 Market Shift / Break of Structure (BoS) on the lower timeframes.
Last 30 Minutes (The Retrace): The price retraces back into the HTF candle's range, often pulling back up to 50% of the initial overextension before the candle closes.
Because precise timing is everything in this strategy, the Tristan HTF Master visually draws the HTF candle directly onto your lower timeframe chart from the very first second it opens. You can visually track exactly when the 30-minute mark is reached without having to constantly switch timeframes or check the clock.
How to Trade the Strategy Using This Indicator
While this tool can be used for any MTF strategy, here is the optimal step-by-step setup it was designed for:
Market Condition: Identify a ranging market. Avoid massive, aggressive trending environments. Look for longs in the lower third of the range, and shorts in the upper third.
The Setup: Wait for a Liquidity Sweep and an Overextension during the first half of the HTF candle (e.g., the first 30 mins of the 1H box).
The Trigger: Look for a Type 3 Market Shift (Break of Structure) on the lower timeframe, confirming the exhaustion of the overextension.
The Entry: Pull your Fibonacci tool over the Type 3 shift. Place a limit order at the 50% retracement level of that shift (ideally backed by a factual shift confirmation).
Stop Loss (SL): Placed strictly above the local high (for shorts) or below the local low (for longs) of the sweep.
Take Profit (TP): Target the 50% retracement level of the entire initial overextension.
Indicator Features
Dynamic HTF Boxes: Overlays 15m, 30m, 1H, or 4H candles perfectly onto your current LTF chart. The boxes span the full width of the time period from the moment they open.
100% Transparent Bodies: The HTF box bodies are fully transparent. This allows you to clearly read the internal Lower Timeframe (LTF) price action without visual clutter.
Real-Time Wicks: The wicks of the HTF candle update dynamically in the center of the box as new highs and lows are formed.
Live Countdown Timer: Includes a clean, built-in countdown label attached to the active HTF candle, showing exactly how much time is left until the candle closes.
Disclaimer: This script and the described strategy are for educational purposes only and do not constitute financial advice. Past performance is not indicative of future results. Always backtest strategies thoroughly and manage your risk appropriately. Penunjuk

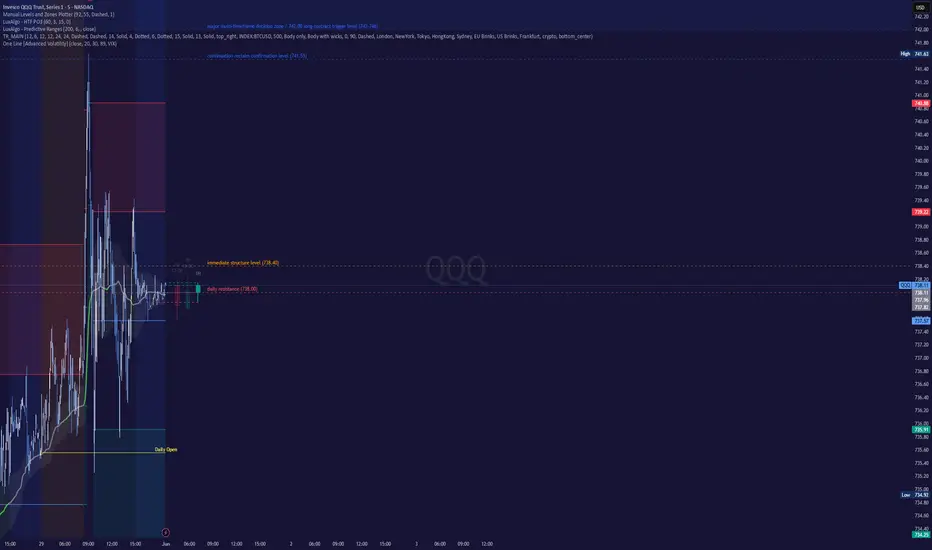
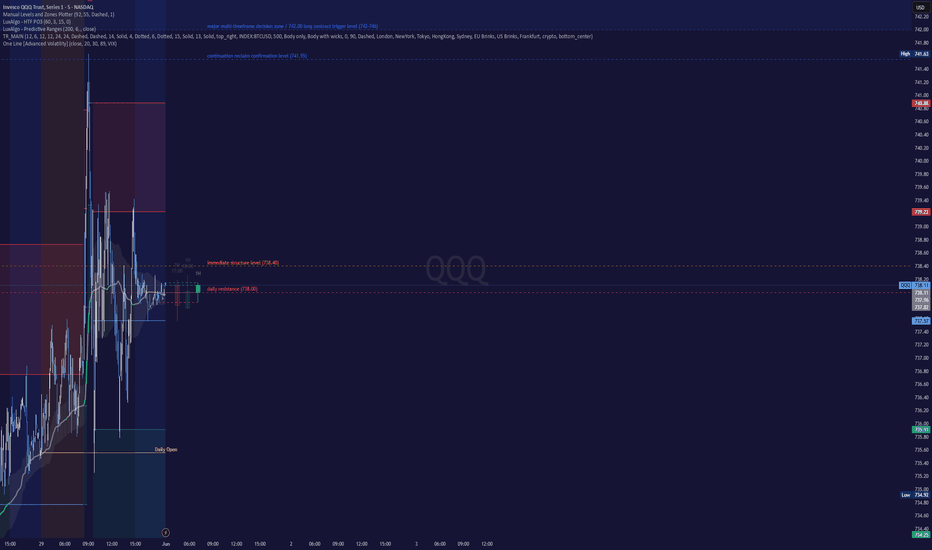
quick levels and zonesManual Levels and Zones Plotter is a lightweight, high-utility tool designed to instantly map out your entire technical analysis framework from a single text block. Simply paste your raw text notes, level levels, or automated scanner outputs directly into the indicator settings, and the script handles the rest.
🚀 Key Features
Instant Bulk Plotting: Parses multiple lines of text simultaneously. No more manual line drawings or repeating actions for every single price point.
Dynamic Range & Zone Detection: If a line contains a price range (e.g., 742–746 major resistance zone), the script automatically detects it and draws a shaded visual box (zone) instead of a single line.
Smart Color Coding: Automatically identifies key market terms within your text notes and applies contextual color profiles:
🔴 Red: Exhaustion, Resistance, Outliers
🟢 Green: Support, Expansion Targets
🟠 Orange: Pivot points, Line-in-the-sand levels
⚪ Gray: Standard micro or unclassified levels
Smart Label Staggering: Labels are dynamically staggered off the right edge of the price action (bar_index + spacer) to prevent overlap and maintain a pristine, readable chart view.
Replay & Real-Time Performance Optimized: Built using persistent garbage-collection arrays running strictly on barstate.islast. It renders flawlessly during historical Bar Replay sessions without lagging your chart or cluttering background memory.
🛠 How to Use It
Open the indicator settings window.
In the "Paste Levels Here" text area, paste your levels. Each level must be on its own line, starting with the numeric price value.
Example format:
Plaintext
766.70 outlier monthly resistance
742–746 major resistance zone
733.55 daily pivot / line in the sand
708.43 weekly support
Toggle "Extend Across Entire Screen?" to choose between historical infinite projections or localized, clean right-side tracking. Penunjuk
Ultimate Scalp MoBo + RSI + Mult-MA + MACD ConfigurationOverview
The Ultimate Scalp Configuration is a comprehensive trend-following and pullback execution system designed specifically for scalpers and day traders. Rather than simply overlaying indicators, this script synchronizes three distinct technical layers—Trend, Volatility-Adjusted Momentum, and Price Action—to identify high-probability entries at the precise moment a pullback ends and a trend resumes.
How It Works (The "Synergy")
This script uses a modular approach to filtering out "market noise," which is the primary challenge in lower-timeframe scalping:
- The Trend Layer (Multi-MA Engine): The script utilizes a fanned-out Moving Average structure (9, 50, and 200 lengths). Users can choose from 12 advanced MA types, including Zero-Lag EMA (ZLEMA) and Fractal Adaptive Moving Average (FRAMA). These are used to determine the "Path of Least Resistance." A signal only fires when the trend is perfectly aligned (Fast > Medium > Slow).
- The Volatility Layer (MoBo Bands): Momentum Breakout (MoBo) Bands are derived from Standard Deviation. They act as a volatility filter, ensuring that a "Buy" or "Sell" signal only occurs when the price has enough momentum to break out of its immediate value area.
- The Momentum Filter (RSI & MACD): To prevent "buying the top," the script cross-references the Relative Strength Index (RSI) and MACD Histogram. These ensure that momentum is not only trending but is actively accelerating in the direction of the trade.
- The Execution Layer (EMA Touch & Price Action): The primary trigger is a mean-reversion "touch" of the 9-period Fast EMA. To confirm the reversal, the script scans for one of eight institutional candlestick patterns (e.g., Morning/Evening Stars, Tweezers, or Pin Bars).
Key Features
- 12 Selectable MA Types: Adapt to different market conditions (Forex, Crypto, or Futures) by switching between GMA, VIDYA, KAMA, and more.
- Advanced Price Action Detection: Integrated logic for Hammer, Shooting Star, Tweezer, Inside Bar, and Dark Cloud patterns as signal requirements.
- Secondary Volatility Filters: Built-in ADX (Trend Strength) and ATR (Volatility) filters to keep you out of sideways, low-volume markets.
- Signal Cooldown: Prevents repetitive "over-trading" by enforcing a minimum bar distance between consecutive signals.
- Dynamic TP/SL Zones: The 50 and 200 MAs are highlighted as primary dynamic levels for taking profit or placing trailing stops.
How To Use
Identify the Trend: Ensure the 50 (Orange) and 200 (Blue) MAs are fanned out and the price is above/below them.
- Wait for the Pullback: Look for the price to return and "touch" the 9 EMA (Signal Line).
The Entry: Enter on the BUY or SELL label, which signifies that the pullback has met all MoBo, RSI, MACD, and Candlestick requirements.
- Management: Use the Orange MA (50) as your first Take Profit or "Break Even" zone, and the Blue MA (200) as your ultimate trend reversal stop. Penunjuk

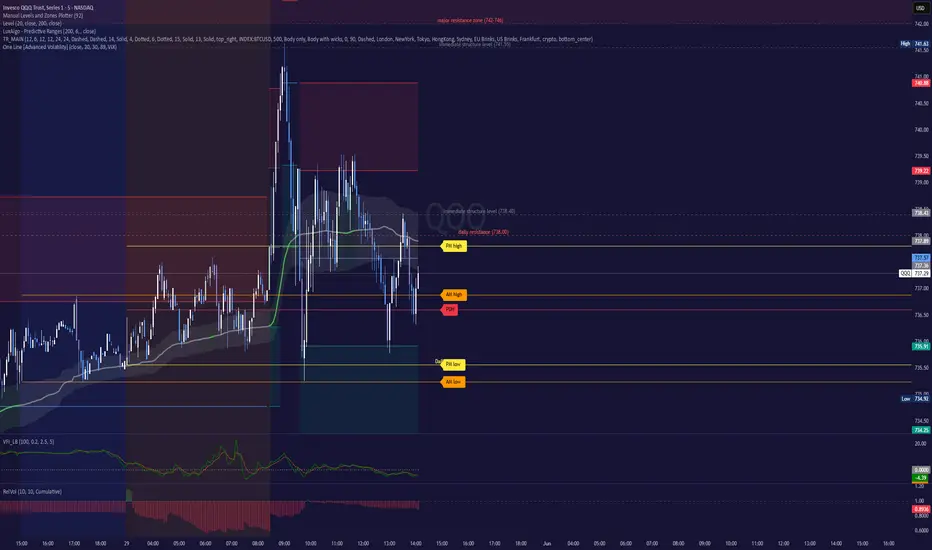
Adaptive Flow & Volatility BaselineMost retail indicators fail because they ask a single, one-dimensional question: What is the price doing?
The One Line is a multi-factor state machine designed to filter out the noise that traps retail traders. Instead of relying on lagging moving averages, it requires the mathematical confluence of price expansion, directional money flow, higher-timeframe alignment, and implied volatility (VIX) to validate a trend. If the institutional data does not support the move, the indicator stays flat, keeping you out of the chop.
Core Mechanics
Under the hood, this script processes four institutional data pillars into a single, easy-to-read baseline:
Adaptive Efficiency Smoothing (KAMA): The baseline blends a VWMA and SMA, dynamically adjusted by Kaufman’s Efficiency Ratio (ER). During strong trends, the line tracks price closely. When the market turns into a noisy, inefficient mess, the alpha drops and the line goes completely flat.
Directional Volume Flow (VFI): Rather than using raw volume—which can be easily skewed by a single block trade—the model calculates a Volume Flow Indicator (VFI). It caps anomalous volume spikes and tracks whether the underlying money flow is actually accumulating or distributing.
Macro IV Filter (VIX): Equities do not move in a vacuum. The model continuously pulls real-time VIX data. A bullish breakout will only trigger if the VIX is in a state of crush (falling), and a bearish breakdown requires the VIX to be expanding.
Non-Repainting MTF Trend: A strict, non-repainting higher-timeframe filter ensures you are never taking intraday signals against the macro structural trend.
How to Read the Chart
The indicator operates in three distinct regimes, represented by the color of the baseline and the surrounding volatility cloud (fueled by an exponentially smoothed ATR).
Green (Bullish Regime): Price has broken above the upper volatility band, VFI shows net accumulation, the higher-timeframe trend is up, and the VIX is cooperating. Action: Look for long entries on pullbacks to the baseline.
Red (Bearish Regime): Price has broken below the lower volatility band, VFI shows net distribution, the higher-timeframe trend is down, and the VIX is expanding. Action: Look for short entries or put options.
Gray (Chop / Trap Zone): The market is mathematically inefficient. This triggers when price reverts inside the bands, volume dries up, or a structural divergence occurs (e.g., price is rising but VFI money flow suddenly turns negative). Action: Capital preservation. Sit on your hands.
Trading Playbook & Best Practices
The "Trap" Exit: The smartest feature of this indicator is its dynamic reversion. If you are in a valid Green trend, but the underlying money flow (VFI) suddenly flips negative, the line will instantly turn Gray. Do not wait for price to hit your stop-loss. If the line turns gray, the institutional support for the move has vanished. Exit or trim your position.
Asset Class: This model was built specifically for highly liquid, volume-heavy instruments like SPY, QQQ, and ES/NQ futures.
Timeframes: It thrives on the 3-minute, 5-minute, and 15-minute charts. (Ensure the "Macro Timeframe" input is set appropriately higher than your chart timeframe, e.g., a 30m MTF on a 5m chart).
Trade the regime, not the noise. Penunjuk

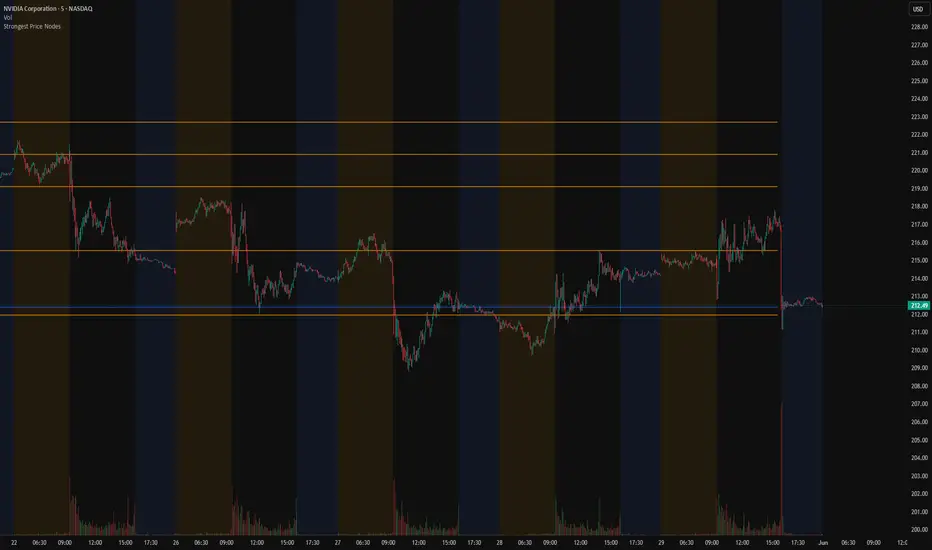
Strongest Price NodesStrongest Price Nodes highlights the price levels where the market has built the strongest activity across recent sessions.
Instead of displaying a full profile or filling the chart with too many levels, this indicator extracts only the most important price nodes and plots them directly on the chart as clean decision levels.
These nodes represent areas where price has spent time, traded volume, or built both time and volume together.
In simple terms, the indicator helps answer one question: Where has the market shown the strongest acceptance?
What It Shows? The indicator plots two types of nodes:
1. Historical Price Nodes
Historical nodes are calculated from completed sessions using the selected lookback period.
They show where the strongest market participation occurred in recent history.
These levels can act as important areas for reaction, support, resistance, retest, breakout confirmation, or mean reversion.
2. Developing Session Node
The developing session node shows the strongest value area forming during the current session.
It updates live as the session develops.To keep the chart clean, the developing session node is always limited to one level.
Calculation Modes The indicator includes three profile modes:
Volume
Finds price levels where the most volume traded.
Time
Finds price levels where price spent the most time.
Volume x Time
Finds price levels where both volume and time align.
This mode is useful for identifying stronger acceptance zones because it combines participation with time spent at price.
Why These Nodes Matter
Strong price nodes often become important market reference points.
Price may pause around them, reject from them, retest them after a breakout, rotate back toward them, or use them as support or resistance.
A strong node is not a buy or sell signal by itself. It is a decision zone. What matters is how price behaves when it reaches the node.
Display Controls
Nodes can be displayed as lines or ATR-based zones.
ATR-based zones adjust automatically with market volatility.
The extension mode can also be controlled.
You can choose to stop levels at session end, extend them for a fixed number of bars, extend them to the right, extend them to the left, or extend them in both directions.
This helps keep the chart clean and avoids unnecessary infinite lines when they are not needed.
How Traders Can Use It
Use historical nodes to mark important prior value areas.
Use the developing node to understand where the current session is building value.
If price holds above a node, it may suggest acceptance.
If price rejects from a node, it may suggest failed acceptance.
If price breaks away and later retests the node, it can become a useful continuation or reversal area.
The indicator works best when combined with price action, VWAP, session highs and lows, trend context, and volume behavior.
Summary
Strongest Price Nodes is built for traders who want a cleaner way to identify important price levels.
It focuses only on the strongest areas of market activity and removes unnecessary profile clutter.
The goal is not to predict direction.
The goal is to show where the market has accepted price and where the next important reaction may happen.
Penunjuk

Penunjuk
Penunjuk

Penunjuk

Penunjuk

Takhtupuria Sniper Pro: All-in-OneUltimate Sniper Pro: All-in-One
This is an advanced, comprehensive scalping tool designed to consolidate essential trading indicators into a single, user-friendly workspace. It is built to help traders analyze market trends, volatility, and institutional price levels efficiently.
Core Features included in this script:
EMA Settings: Includes both 21 EMA and 200 EMA to provide clear trend direction and support/resistance confirmation.
Alligator Indicator: A powerful tool for identifying market consolidation and catching the start of a trend burst.
Bollinger Bands (BB): Used to measure volatility and identify potential mean reversion opportunities in fast-moving markets.
VWAP: A critical tool for tracking institutional-level price averages.
Customization & Control:
Flexibility: Users can toggle each component (EMA, Alligator, BB, VWAP) on or off from the Inputs tab to suit their specific trading style.
Full Customization: All colors, line thicknesses, and styles are fully editable in the Style tab, allowing you to customize the tool to match your preferred chart setup.
This indicator is designed for traders seeking a clean, "All-in-One" solution to eliminate chart clutter and improve decision-making speed. Penunjuk

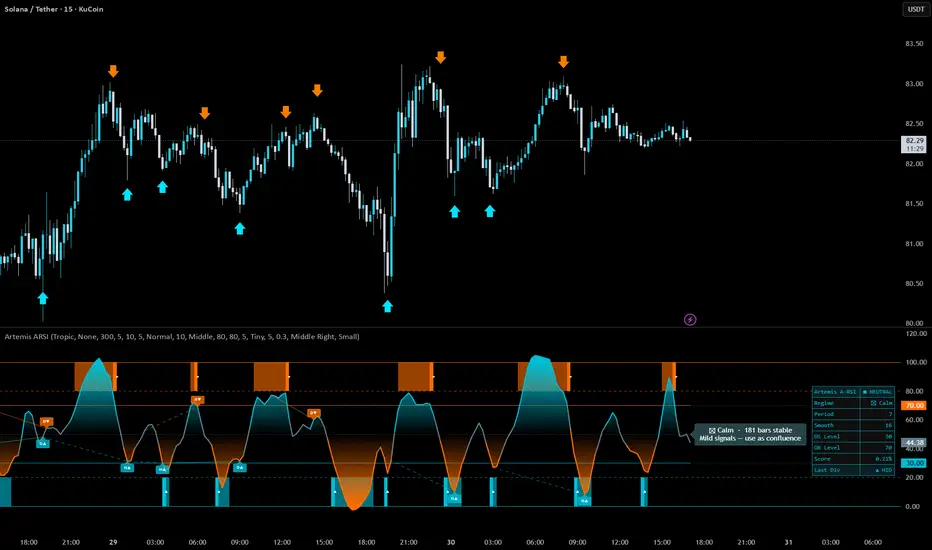
Artemis Adaptive RSI🟦 Artemis Adaptive RSI is a Pine v6 self-tuning RSI workbench. Instead of shipping with a fixed period and fixed thresholds — and forcing the trader to babysit the inputs across regimes (14 / 70 / 30 on stocks, 7 / 80 / 20 on crypto, 21 / 60 / 40 in trends) — a 60-candidate optimisation grid scores Supersmoother-filtered RSI variants against their own forward-return performance on a rolling window, then picks the variant whose threshold trips deliver the cleanest mean-reversion edge on the current market. The active period, smoothing, and OB / OS thresholds update online, and a five-state regime label tells you why the optimiser chose what it chose.
The indicator integrates seven analytical layers — Supersmoother-filtered RSI core, online candidate optimiser, hysteresis-locked regime classifier, Stochastic-Extreme-style multi-band zone visual, pivot-based Regular + Hidden divergence detection with a Smart AI Filter, adaptive trigger markers, theme-adaptive bar painter, and a PRO 8-row dashboard — each operating independently and rendered on a single, clean oscillator panel.
🟦 CREDITS & ATTRIBUTION
The adaptive optimisation CORE — Supersmoother-filtered RSI fleet, rolling-window incremental scorer, champion selection with hysteresis, and the five-state regime classifier — is derived from the open-source work of **GoodBadBitcoin** and published under the same MPL-2.0 license. Full respect to the original author for the design and the open release; this project would not exist without that groundwork.
- Source script — [Adaptive Modern RSI ]()
- Original author — (www.tradingview.com)
Everything else — the Stochastic-Extreme-style multi-band zone UI, the twelve-theme palette system, the pivot-based divergence engine, the Smart AI Filter, the PRO dashboard, the hover-tooltipped regime badge, the theme-aware bar painter, and the curated nine-channel alert pack — is original work added on top.
🟦 HOW THE CORE ENGINE WORKS
**Supersmoother**
Each bar, the per-bar close change is split into two streams — positive (gains) and negative (losses) — and each stream is fed through an Ehlers two-pole Butterworth low-pass filter. The Supersmoother removes high-frequency noise without piling on the phase lag that naive EMA / RMA pre-smoothing chains accumulate. The filtered gain / loss streams then feed the classical Wilder RSI ratio:
rsi = 100 − 100 / (1 + smoothedGains / smoothedLosses)
**Candidate Fleet**
15 RSI variants are precomputed in parallel — every combination of:
| Axis | Values |
|---|---|
| RSI length | 7 / 10 / 14 / 21 / 28 |
| Supersmoother smoothing | 6 / 10 / 16 |
Combined with 4 threshold tiers (15-85 / 20-80 / 25-75 / 30-70), this gives the 60-slot fleet the optimiser grades against.
**Online Optimiser (Rolling-Edge Scorer)**
Every bar, each of the 60 slots is evaluated:
1. **Trigger detection** — for the slot's threshold pair, did the bar produce an OS-entry (RSI crossed down through OS) or an OB-exit (RSI crossed back down through OB)?
2. **Forward-return scoring** — if a trigger fired, score it by `close / close − 1` (signed by trigger direction).
3. **Rolling bookkeeping** — each slot maintains its own running mean over a sliding `scoreWindow`-bar window. Returns enter on add, exit on subtract, mean recomputed in O(1) per slot per bar — no rescans, no naive sum-of-products drift.
After every bar's update, the slot with the highest mean return wins — subject to two gates:
- **Min Triggers per Candidate** — under-sampled slots are disqualified
- **Switch Margin (%)** — a new champion must beat the current incumbent by this hysteresis margin before it actually takes over
This protects against bar-by-bar leadership flapping when two candidates trade marginal scores.
**Regime Classifier**
The crowned champion's shape (length-index, smoothing-index, level-index, mean-return) is read each bar and the market is tagged as one of five phases:
| Glyph | Phase | Meaning |
|---|---|---|
| ◐ | Adapting | Cold start — optimiser not yet armed (default RSI in use) |
| ✸ | Noisy | Score collapsed, no exploitable edge — sit out |
| ➜ | Trending | Long period + relaxed thresholds — trend dominates, avoid OB/OS reversals |
| ▣ | Range | Short period + strict thresholds — RSI's sweet spot, triggers reliable |
| ⊠ | Calm | Middling parameters — mild swings, use as light confluence |
The raw tag stream is then locked through a two-stage hysteresis machine: the displayed phase only updates after the underlying classification holds for `Regime Confirmation Bars` in a row. This keeps the floating badge from twitching on every minor optimiser jitter.
🟦 MULTI-BAND ZONE UI
A Stochastic-Extreme-style six-band visual at 100 / 80 / 70 / 50 / 30 / 20 / 0. The active OB / OS thresholds overlay as steplines that move as the optimiser updates. Zone fills key off the *adaptive* thresholds so the visual escalation tracks the actual signal logic, not a fixed 70 / 30 line.
The fills are tiered — when the RSI line plus the live champion's mean-return both confirm a zone state, the fill intensifies; otherwise the band shows a lighter tint. The 40 / 60 reference dotted lines and the 50 zero line are decorative — they are NOT the triggers.
**RSI line colour**
| Zone | Colour |
|---|---|
| Above 60 | theme-bull (price-strength bias) |
| Between 40 and 60 | neutral |
| Below 40 | theme-bear (price-weakness bias) |
These 40 / 60 bands are FIXED — they are NOT the adaptive OS / OB. The adaptive thresholds drive the triggers; the 40 / 60 bands just colour the RSI line for at-a-glance bias reading.
🟦 TRIGGER MARKERS
Triangle markers fire at the bar of OS entry / OB exit on the *adaptive* thresholds — the events the optimiser is actually scoring:
- ▲ **OS Entry Trigger** — RSI just crossed down through the adaptive OS threshold (mean-reversion long opportunity)
- ▼ **OB Exit Trigger** — RSI just crossed back down through the adaptive OB threshold from above (rejection / short opportunity)
Markers use `location.absolute` with fixed Y coordinates (10 / 90) so they stay glued to the same visual spot every bar — no drift between candles, no shift when zone fills update. Each visible triangle is paired with an invisible `label.style_circle` carrying a hover tooltip with live RSI value, active threshold, active period, and active smoothing — `plotshape()` does not support tooltips natively, so the dual-track rendering is required for hover content.
🟦 DIVERGENCE DETECTION
Pivot-based detection for the four classical divergence flavours:
| Type | Price | RSI | Signal |
|---|---|---|---|
| Regular Bull (D▲) | Lower Low | Higher Low | Potential reversal up |
| Regular Bear (D▼) | Higher High | Lower High | Potential reversal down |
| Hidden Bull (H▲) | Higher Low | Lower Low | Uptrend continuation |
| Hidden Bear (H▼) | Lower High | Higher High | Downtrend continuation |
Pivots are sampled on raw price (high / low) using `Pivot Arm` bars on each side (symmetric). Each pivot bar's RSI value is read **dynamically from the current active RSI series** via bar-index lookup — so when the optimiser switches champions between pivots, the comparison stays internally consistent (both endpoints come from the SAME series). This is a subtle but critical fix vs. naive divergence ports.
Regular Divergence labels (D▲ / D▼) use bracketed glyphs with solid styling — these are the reversal signals.
Hidden Divergence labels (H▲ / H▼) use the same bracket scheme — these are the continuation signals.
Each label hovers a tooltip with the price change, RSI change, and the pivot bar distance.
**Smart AI Filter**
An optional pre-filter that rejects low-quality divergences before they render. Three independent gates:
1. **Min RSI Swing** — minimum RSI difference between the two pivots (default: 5 points). Drops noise-level differences where RSI barely moved between pivots.
2. **Min Price Swing (%)** — minimum price swing between pivots as a percentage of the recent (80 bars) price range (default: 0.3%). Drops divergences where price barely moved relative to recent volatility.
3. **Zone Confirmation** — RSI at the current pivot must sit in the matching adaptive reversion half:
- Bullish divergence → RSI ≤ midpoint(liveOs, 50) (moderate-to-deep oversold)
- Bearish divergence → RSI ≥ midpoint(50, liveOb) (moderate-to-deep overbought)
The zone gate is adaptive — it tightens or loosens as the optimiser updates the live OS / OB thresholds. This encodes the classical "best divergences form at extremes" rule using the live adaptive thresholds, not a fixed 30 / 70.
When the master toggle is OFF (default), all detected divergences render. When ON, only divergences that clear all three gates survive. The filter applies identically to both chart rendering and alert conditions — no mismatch between visual and alert signals.
🟦 REGIME BADGE
A floating label pinned to the LATEST bar, extending rightward into the chart's right-margin / future area. The `label.style_label_left` style places the arrow tip on the LEFT of the box so it visually "points back" to the active RSI data without overlapping the oscillator line.
The badge shows:
- **Glyph + phase name** (e.g. `▣ Range`)
- **Bars stable** (how long the current phase has held)
- **Action note** (e.g. "RSI's sweet spot — triggers work well")
The background colour pulls from the theme palette — Range = theme-bull tint, Trending = theme-bear tint, Adapting / Noisy = theme-neutral tint, Calm = theme-signal tint — so the badge meaning is reinforced by the palette consistency.
**Hover tooltip**
Hovering the badge surfaces a comprehensive phase legend explaining all five glyphs, what each means, what action to take in each, and how to read the "bars stable" counter.
**Position**
User-selectable: Top (y = 80, upper third), Middle (y = 50, centre, default), Bottom (y = 20, lower third). The Y resolver maps the dropdown onto fixed pane-fraction coordinates so the badge stays parked at the same visual spot regardless of RSI value.
🟦 BAR COLORING
Two mutually exclusive modes apply a state-driven colour to every price bar on the chart:
| Mode | Behavior |
|---|---|
| None | Leave bars untouched (default) |
| RSI Zone | Theme-bear when RSI in OB zone, theme-bull when in OS zone, theme-neutral otherwise |
Uses the *adaptive* OB / OS thresholds, not fixed 30 / 70. The bar painter pulls directly from the active threshold state — when the optimiser switches candidates, the bar colour rule updates accordingly with no lag.
🟦 DASHBOARD
A compact 2-column, 8-row PRO data panel renders on the last bar when enabled. Every value derives from variables already computed upstream, so the dashboard adds zero overhead until the final bar.
| Row | Left | Right |
|---|---|---|
| Header | Artemis A-RSI | ▲ OB / ▼ OS / ■ Neutral (current bias) |
| Phase | Phase | ◐ ✸ ➜ ▣ ⊠ glyph + name (current regime) |
| Period | Period | Active RSI length (e.g. 14) |
| Smooth | Smooth | Active Supersmoother smoothing (e.g. 10) |
| OS Level | OS | Active adaptive OS threshold (e.g. 20) |
| OB Level | OB | Active adaptive OB threshold (e.g. 80) |
| Score | Score | Champion's mean forward return (in %) |
| Last Div | Last Div | Most recent divergence within last 50 bars (D▲ / D▼ / H▲ / H▼ / —) |
**Theme-Adaptive Chrome**
The dashboard auto-inverts its layout based on the active theme:
- **Dark themes** (Tropic, Amber, Pastel, Cyber, Helios, Electric, Candy, Bloomberg, Solar, Royal): header and footer use a faint `thBull` tint, middle rows stay solid dark, text uses full-saturation `thBull`. Border uses `thBull` at 20% transparency for strong theme presence.
- **Light themes** (Midnight, Graphite): backgrounds flip to white, text stays `thBull` (which is itself dark on these themes), border uses `thBull` at 40% transparency.
This guarantees text legibility against every palette without per-theme manual tuning.
**Position & Size**
Six anchor slots (Top / Middle / Bottom × Left / Right) and four text sizes (Tiny / Small / Normal / Large).
🟦 COLOR THEMES
Twelve cohesive palettes, each resolving to four axis colors. The whole script reads through these four variables — nothing below the theme resolver references a raw hex literal, so a single dropdown selection drives every plot, fill, stepline, divergence line, dashboard cell and badge.
| Theme | Character | Bull | Bear |
|---|---|---|---|
| Tropic | Cyan steel + deep orange | #00bcd4 | #ff6d00 |
| Amber | Warm amber + indigo blue | #ff9800 | #e53935 |
| Pastel | Sky blue + soft lavender | #4fc3f7 | #9575cd |
| Cyber | Neon lime + hot crimson | #00e676 | #ff1744 |
| Helios | Bright gold + scarlet | #ffd600 | #ef5350 |
| Electric | Electric aqua + magenta | #00e5ff | #e040fb |
| Candy | Neon green + hot pink | #69F0AE | #FF4081 |
| Bloomberg | Terminal orange + cyan | #ff8c00 | #00b0ff |
| Solar | Solarized olive + crimson | #859900 | #dc322f |
| Royal | Imperial gold + deep purple | #ffd700 | #6a0dad |
| Midnight | Deep navy + dark crimson | #0d47a1 | #b71c1c |
| Graphite | Near-black + silver grey | #1a1a1a | #757575 |
🟦 ALERT SYSTEM
Seven user toggles drive nine alert messages, all using `alert.freq_once_per_bar_close`:
| Toggle | Alert(s) | Condition |
|---|---|---|
| OS Entry Trigger | OS Entry | RSI crossed down through adaptive OS |
| OB Exit Trigger | OB Exit | RSI crossed back down through adaptive OB |
| Regime Change | Phase Flip | Locked regime label updates (post-hysteresis) |
| Regular Divergence | D▲ + D▼ | Reversal divergences detected (respects Smart AI Filter) |
| Hidden Divergence | H▲ + H▼ | Continuation divergences detected (respects Smart AI Filter) |
| RSI Mid Cross Up | Mid ↑ | RSI crossed above 50 |
| RSI Mid Cross Down | Mid ↓ | RSI crossed below 50 |
Each alert fires through `alert()` so the message body carries live context — current RSI value, the active adaptive threshold that triggered, active period and smoothing, and (for Regime Change) the previous phase's hold duration. Divergence alerts respect the Smart AI Filter — if the filter is ON and a divergence is rejected visually, the alert will also not fire.
🟦 SETTINGS REFERENCE
**Visual**
- Theme — 12 palette options. Default: Tropic
**Adaptation Core**
- Optimization Lookback (bars) — 100–1000. Default: 300
- Forward-Return Eval Horizon — 2–20. Default: 5
- Min Triggers per Candidate — ≥ 2. Default: 5
- Switch Margin (%) — 0–50, step 2.5. Default: 10
**Regime Label**
- Show Regime Label — Toggle. Default: ON
- Regime Label Size — Tiny / Small / Normal / Large / Huge. Default: Normal
- Regime Confirmation Bars — 1–100. Default: 10
- Regime Label Position — Top / Middle / Bottom. Default: Middle
**Zones & Levels**
- Show Adaptive Levels — Toggle. Default: ON
- Show Zone Fills — Toggle. Default: ON
- Show Trigger Signals — Toggle. Default: ON
**Divergence**
- Regular Divergence — Toggle. Default: ON
- Regular Opacity — 0–100. Default: 80
- Hidden Divergence — Toggle. Default: ON
- Hidden Opacity — 0–100. Default: 80
- Pivot Arm — 2–50. Default: 5
- Label Size — Tiny / Small / Normal / Large. Default: Tiny
- Smart AI Filter — Master toggle. Default: OFF
- Min RSI Swing — 1.0–50.0. Default: 5.0
- Min Price Swing (%) — 0.1–5.0. Default: 0.3
- Require Zone Confirmation — Toggle. Default: ON
**Bar Coloring**
- Bar Color Mode — None / RSI Zone. Default: None
**Dashboard**
- Show Dashboard — Toggle. Default: ON
- Panel Position — 6 anchor slots. Default: Middle Right
- Panel Text Size — Tiny / Small / Normal / Large. Default: Small
**Alerts**
- OS Entry Trigger — Default: ON
- OB Exit Trigger — Default: ON
- Regime Change — Default: ON
- Regular Divergence — Default: ON
- Hidden Divergence — Default: OFF
- RSI Mid Cross Up — Default: OFF
- RSI Mid Cross Down — Default: OFF
🟦 COMPATIBILITY
Works on all asset classes and all timeframes in TradingView Pine Script v6.
- Crypto: Spot, futures, perpetual contracts
- Forex: All pairs
- Equities: Stocks, ETFs, indices
- Commodities: Metals, energy, agriculture
- Timeframes: 1m through Monthly
Because the engine self-tunes its RSI period, smoothing, and OB / OS thresholds online, the same default settings work on a 5-second BTC chart and a weekly index chart without retuning. The optimiser sees the asset's actual reversion behaviour and adapts — no per-asset preset library needed.
🟦 TECHNICAL NOTES
- Pine Script v6
- `max_lines_count = 500`, `max_labels_count = 500`, `max_bars_back = 1000`
- No repainting — all values calculated on bar close. Pivot-based divergence results appear `Pivot Arm` bars late by design (standard Pine pivot confirmation behaviour)
- The adaptive RSI line is internally consistent across optimiser switches — divergence pivots read RSI dynamically via `activeRsi `, so both endpoints come from the SAME (current) RSI series even when the champion changes between pivots
- The Supersmoother filter relies on `var float lpY = 0.0` private state per call-site — Pine v6 issues one independent state slot per call-site, so the 15 fleet entries below produce 30 (15 × 2 streams) independent filter histories with zero cross-talk
- Champion switch is hysteresis-gated by `Switch Margin (%)` and an eligibility floor (`Min Triggers per Candidate`) — protects against bar-by-bar flapping when two candidates trade marginal scores
- Regime tag is doubly hysteresis-gated — first the candidate must hold, then the displayed phase only flips after `Regime Confirmation Bars` of stable tagging
- Trigger markers use `location.absolute` with fixed Y coordinates (10 / 90) for visual stability — no slide on zoom or candle-spacing changes
- Trigger marker tooltips piggy-back on invisible `label.style_circle` parallel renders — `plotshape()` does not natively support the `tooltip` argument
🟦 DISCLAIMER
This indicator is provided for educational and informational purposes only. It does not constitute financial advice. Past performance does not guarantee future results. Always conduct your own analysis and apply proper risk management. Penunjuk

Penunjuk

Penunjuk

Penunjuk

Penunjuk

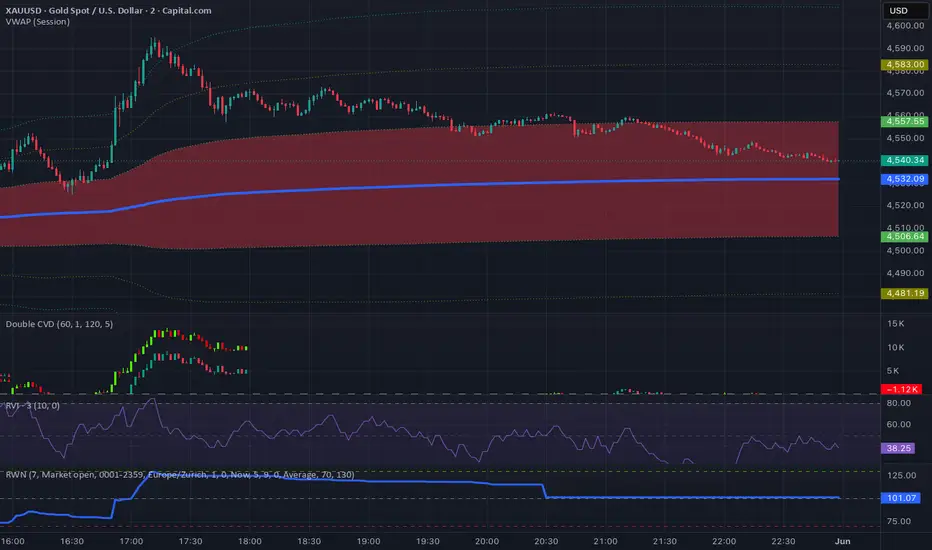
EMA Ribbon with ATR ExtensionsThis indicator is an EMA ribbon framework combined with multi-timeframe trend structure and volatility-normalized distance measurements using ATR.
The core component is a configurable exponential moving average ribbon, allowing multiple EMA lengths to be plotted simultaneously across different timeframes. This includes both intraday EMAs and optional higher-timeframe EMAs such as daily and weekly periods. The purpose of this structure is to provide a layered view of trend behavior across multiple time horizons, helping visualize alignment, compression, and expansion within broader market structure.
In addition to standard EMA visualization, the indicator integrates a volatility context layer using the Average True Range (ATR). This allows price distance from each EMA to be expressed not only in percentage terms, but also in ATR-normalized form. The ATR extension metric is derived from the relationship between percentage deviation from the moving average and current ATR percentage, enabling comparison of movement intensity across different instruments regardless of price scale.
The included table presents a structured breakdown for each selected EMA:
EMA value based on configurable length and timeframe
Percentage distance between price and each EMA
ATR-normalized extension value representing volatility-adjusted deviation
This structure allows users to observe how price interacts with multiple trend references simultaneously, while also understanding whether movement is occurring within normal volatility conditions or represents an expanded deviation relative to recent market behavior.
A visual marker is included to highlight conditions where price is significantly extended above a selected higher timeframe EMA relative to ATR-based expansion. This is intended to assist with quickly identifying periods of elevated trend extension within the broader EMA framework.
The header display optionally shows symbol, description, and active chart timeframe to maintain contextual awareness when analyzing multiple assets or timeframes.
Overall, the tool is designed as a multi-layer trend and volatility visualization system combining moving averages, relative distance metrics, and ATR-based normalization to better contextualize price positioning within ongoing market structure. Penunjuk