Penunjuk

Smart RebalanceThis script is based on the portfolio rebalancing strategy. It's designed to work with cryptocurrencies, but it can work with any market.
How portfolio rebalance works?
Let's assume your initial capital is $1000, and you want to distribute it into 4 coins. This script takes the USDT as the stable coin for the initial money, so in case you want other currency, the pairs must be with that fiat as the quote.
Following our example, you would take BTC, ETH, BNB, and FTT. After selecting the coins, it's time to choose how much allocation is on each. Let's put 25% on each. This way, $250 of our capital on each coin.
After selecting the coins and their allocation, you choose the price change ratio for rebalancing. Let's use 1%. Next, you start to watch the markets. The first thing that happens, following our example, is the BTCUSDT price moving 1% up.
That amount hit the ratio of 1% for the rebalance. Hence, you sell 1% of BTC for USDT and redistribute to the other coins, buying 0.25% of each currency to rebalance the portfolio.
Next, ETHUSDT goes 1% down, time to rebalance again. This time, you need to take 0.33% of each other coin and buy ETH, so this way, it's all divided as the chosen allocation.
Why use rebalancing?
Looks easy, right? It is, but very time demanding. Demands even more if you raise the number of coins you want to distribute. Having a system to do that automatically is a must to work efficiently. Rebalancing spreads the risk among multiple currencies. This way, you earn small when it goes up, but you lose small when it goes down.
What this script helps with portfolio rebalance?
This indicator will not buy/sell for you but will help you choose the best markets for your rebalancing. Which coin will work best in that period? Do I need to have more than 8 coins? How much must be my ratio? Those questions you can answer using this indicator.
What this script has?
Start and End dates
The script will work for a certain period. All calculations will be done in that period.
Coin Ratio %
The amount of price movement of each asset that will be used to calculate the rebalancing
Initial Capital and Broker Fee
The amount of capital to be used on the rebalancing and the broker fee you want to use the strategy. The cost will be applied on every trade, buying or selling the coins.
Assets, allocations, and colors
It's possible to select from 2 to 10 assets to be used on the portfolio. Each purchase must have the allocation %. Suppose the sum of the allocations is different from 100%. In that case, a warning message will appear on the chart instead of the statistics.
Panel and tooltips
There is a panel with a summary of the results
Set allocations automatically
There is an option to make the indicator use the daily asset volume from the day before to determine the allocation percentage of each asset. This option is better if you are unsure how much allocation you want to use on each coin.
Use this indicator as a backtest for your rebalancing strategy. The selected market on the chart will not affect the calculation on this indicator, but the time frame will. The higher the time frame, the higher the coin ratio % must be.
About the code
The code is written to use arrays to store the values of each asset, making the calculations on each candle inside the time range. The for-loops are used to reduce the code length and make it easy to change the analysis of all assets. Finally, the script has some comments on the code.
Penunjuk

Penunjuk

Penunjuk
Penunjuk
Penunjuk

Fr3d0's Volume Profile Visible RangeLow level implementation
At the core of VPVR there’s a concept called “bucketization”.
Question : what is bucketization?
Answer : bucketization consists of identifying metrics with high predictive power and combine them appropriately.
I think this is a problem of bucketization because what the VPVR does is to take a price range, divide it into buckets and fill them up with the volume that was produced in each bucket’s range over the given period.
The more we divide our price range the finer the resolution, but also the less significant each bucket will become.
The steps are :
1. Get the price range with min and max over the give period;
2. Divide the range into buckets;
3. Loop over each candle of the given period and proportionally assign volume to one or more bucket.
Question : how to assign volume to buckets?
Answer : we need to calculate the right amount to add to each bucket for each candle. If 20% of a candle lies on a bucket then that bucket needs to have 20% of the volume of that candle, the rest 80% belongs to other buckets.
To get the percentage of a candle on a given bucket we have to find the price range of the candle contained within the bucket, then divide that amount by the entire length of the candle.
How to bucketize
Question : what are the formulas of A, B, C and Target respectively?
Answer :
- A = Max(candle_high, bucket_top) - Min(candle_low, bucket_bottom);
- B = Max(candle_high, bucket_top) - Min(candle_high, bucket_top);
- C = Max(candle_low, bucket_bottom) - Min(candle_low, bucket_bottom);
- Target = A - B - C.
Now that we now how to calculate the price range belonging to each bucket we need to calculate a percentage of volume to fill the bucket with.
The formula is trivially simple :
Volume * Target / (candle_high - candle_low).
Question : can we distinguish between buy volume and sell volume? If so, how?
Answer : yes we can and the following paragraph will teach you how.
Put it simply we can use the difference between the extremes of a candle (low and high) and its close price to get the buy and sell volumes.
The formulas for that are :
- Buy volume = Volume * (close - low) / (high - low);
- Sell volume = Volume * (high - close) / (high - low).
I know this is rather simplicistic but it makes sense.
Closing thoughts
This script is a working progress and I’m going to give more details if necessary, just let me know in the comments down below. Penunjuk

Penunjuk
Penunjuk

Penunjuk

Penunjuk

Penunjuk

Relative Volume (rVol), Better Volume, Average Volume ComparisonThis is the best version of relative volume you can find a claim which is based on the logical soundness of its calculation.
I have amalgamated various volume analysis into one synergistic script. I wasn't going to opensource it. But, as one of the lucky few winners of TradingClue 2. I felt obligated to give something back to the community.
Relative volume traditionally compares current volume to prior bar volume or SMA of volume. This has drawbacks. The question of relative volume is "Volume relative to what?" In the traditional scripts you'll find it displays current volume relative to the last number of bars. But, is that the best way to compare volume. On a daily chart, possibly. On a daily chart this can work because your units of time are uniform. Each day represents a full cycle of volume. However, on an intraday chart? Not so much.
Example: If you have a lookback of 9 on an hourly chart in a 24 hour market, you are then comparing the average volume from Midnight - 9 AM to the 9 AM volume. What do you think you'll find? Well at 9:30 when NY exchanges open the volume should be consistently and predictably higher. But though rVol is high relative to the lookback period, its actually just average or maybe even below average compared to prior NY session opens. But prior NY session opens are not included in the lookback and thus ignored.
This problem is the most visibly noticed when looking at the volume on a CME futures chart or some equivalent. In a 24 hour market, such as crypto, there are website's like skew can show you the volume disparity from time of day. This led me to believe that the traditional rVol calculation was insufficient. A better way to calculate it would be to compare the 9:30 am 30m bar today to the last week's worth of 9:30 am 30m bars. Then I could know whether today's volume at 9:30 am today is high or low based on prior 9:30 am bars. This seems to be a superior method on an intraday basis and is clearly superior in markets with irregular volume
This led me to other problems, such as markets that are open for less than 24 hours and holiday hours on traditional market exchanges. How can I know that the script is accurately looking at the correct prior relevant bars. I've created and/or adapted solutions to all those problems and these calculations and code snippets thus have value that extend beyond this rVol script for other pinecoders.
The Script
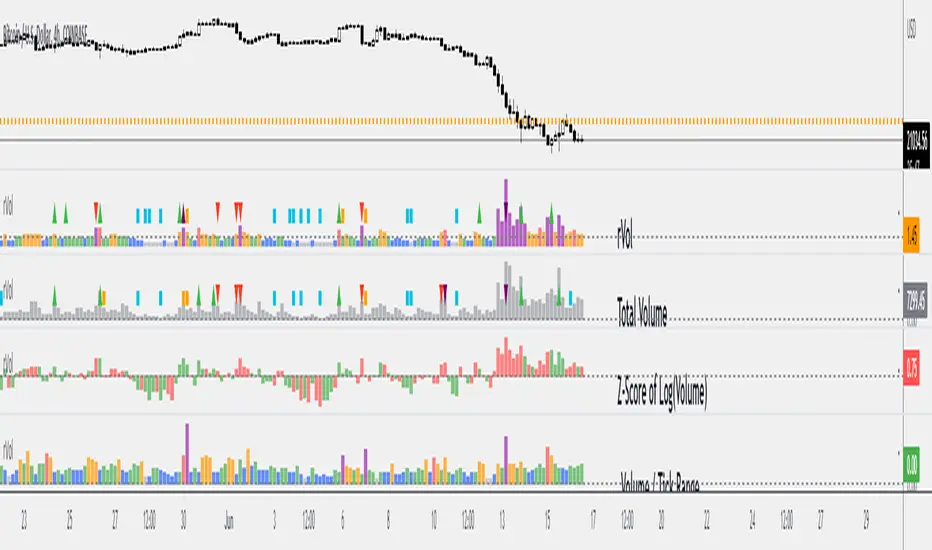
This rVol script looks back at the bars of the same time period on the viewing timeframe. So, as we said, the last 9:30 bars. Averages those, then divides the: . The result is a percentage expressed as x.xxx. Thus 1.0 mean current volume is equal to average volume. Below 1.0 is below the average and above 1.0 is above the average.
This information can be viewed on its own. But there are more levels of analysis added to it.
Above the bars are signals that correlate to the "Better Volume Indicator" developed by, I believe, the folks at emini-watch and originally adapted to pinescript by LazyBear. The interpretation of these symbols are in a table on the right of the indicator.
The volume bars can also be colored. The color is defined by the relationship between the average of the rVol outputs and the current volume. The "Average rVol" so to speak. The color coding is also defined by a legend in the table on the right.
These can be researched by you to determine how to best interpret these signals. I originally got these ideas and solid details on how to use the analysis from a fellow out there, PlanTheTrade.
I hope you find some value in the code and in the information that the indicator presents. And I'd like to thank the TradingView team for producing the most innovative and user friendly charting package on the market.
(p.s. Better Volume is provides better information with a longer lookback value than the default imo)
Credit for certain code sections and ideas is due to:
LazyBear - Better Volume
Grimmolf (From GitHub) - Logic for Loop rVol
R4Rocket - The idea for my rVol 1 calculation
And I can't find the guy who had the idea for the multiples of volume to the average. Tag him if you know him
Final Note: I'd like to leave a couple of clues of my own for fellow seekers of trading infamy.
Indicators: indicators are like anemometers (The things that measure windspeed). People talk bad about them all the time because they're "lagging." Well, you can't tell what the windspeed is unless the wind is blowing. anemometers are lagging indicators of wind. But forecasters still rely on them. You would use an indicator, which I would define as a instrument of measure, to tell you the windspeed of the markets. Conversely, when people talk positively about indicators they say "This one is great and this one is terrible." This is like a farmer saying "Shovels are great, but rakes are horrible." There are certain tools that have certain functions and every good tool has a purpose for a specific job. So the next time someone shares their opinion with you about indicators. Just smile and nod, realizing one day they'll learn... hopefully before they go broke.
How to forecast: Prediction is accomplished by analyzing the behavior of instruments of measure to aggregate data (using your anemometer). The data is then assembled into a predictive model based on the measurements observed (a trading system). That predictive model is tested against reality for it's veracity (backtesting). If the model is predictive, you can optimize your decision making by creating parameter sets around the prediction that are synergistic with the implications of the prediction (risk, stop loss, target, scaling, pyramiding etc).
<3 Penunjuk

Penunjuk

Penunjuk

Penunjuk

Penunjuk

Penunjuk
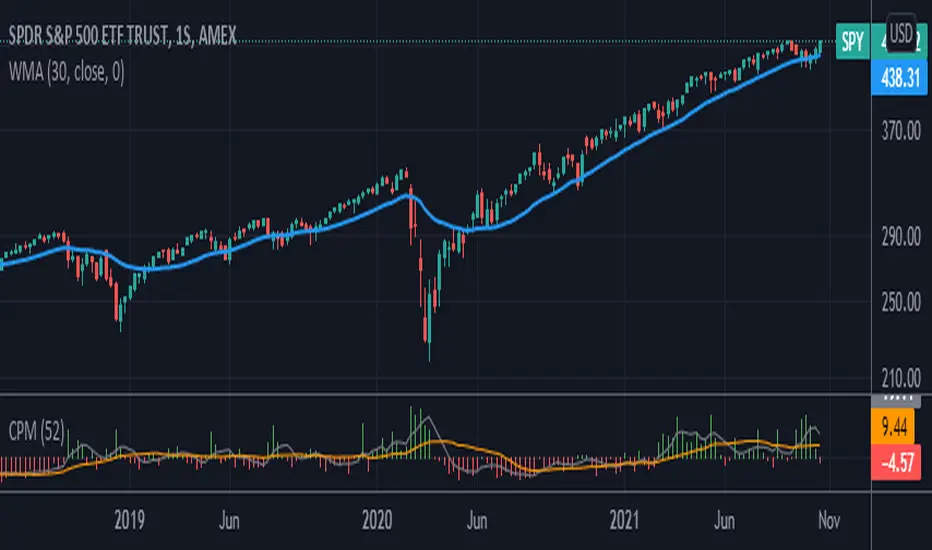
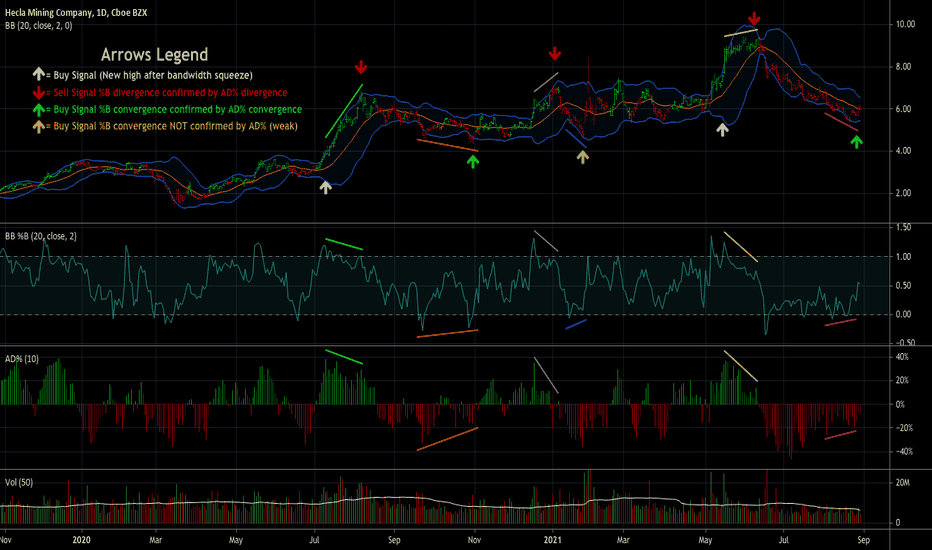
Accumulation/Distribution %This script takes the signal from the Accumulation Distribution indicator invented by Larry Williams and normalizes it such that it becomes an oscillator about a zero line as described by John Bollinger in his book Bollinger on Bollinger Bands . The purpose of the indicator is to serve as a volume-based confirmation of signals given by other indicators, typically Bollinger Bands paired with a momentum indicator . In the example shown, Bollinger Bands are paired with Bollinger Bands %B and the Bollinger Bands %B indicator is interpreted similar to the Relative Strength Index ( RSI ) which is a momentum indicator .
The AD% indicator is colorized such that positive readings are green and negative readings are red. The readings become darker when approaching the zero line. The colorization is also displayed on the price chart. The chart type needs to be set to "bars" for price colorization to work properly.
The formula for this indicator is presented in the John Bollinger book as follows:
10-day sum of /10-sum of volume
How to use (my take on a strategy from the book):
1. Look for %B readings that are oversold or overbought (less than 0.00 or greater than 1.00)
2. Check for bearish divergence or bullish convergence of price and %B as shown on the chart
3. Verify divergence or convergence with AD%
4. Note previous trending/crossover behavior of AD% and %B and compare to situation being analyzed
5. A conservative trader may consider buying/selling on a close beyond the 20-day moving average and an AD% zero line crossover (color change)
6. An aggressive trader may consider buying/selling on a color change alone, on a breakdown of %B, or some other signal(s).
Securities behave differently from one another and this strategy doesn't work for all of them. As with any strategy, check past performance to make sure this approach is a good fit. Bandwidth ( volatility ) squeeze is another strategy which seems to work well for this security. For that reason, it was used to demonstrate buy signals, but squeezes aren't always so predictable. AD% may be useful for determining which direction a squeeze will resolve itself, as was the case here. Further information on volatility squeeze trading can be found in the John Bollinger book Bollinger on Bollinger Bands or online.
The default TradingView Accumulation Distribution indicator does not incorporate opening price. The formula used for this indicator does, so there are multiple versions of the A/D formula.
Despite the buy signal indicated, I'm not going long Hecla Mining here and I don't recommend it. I'd need to do further DD before doing so.
Please feel free to ask questions. Penunjuk
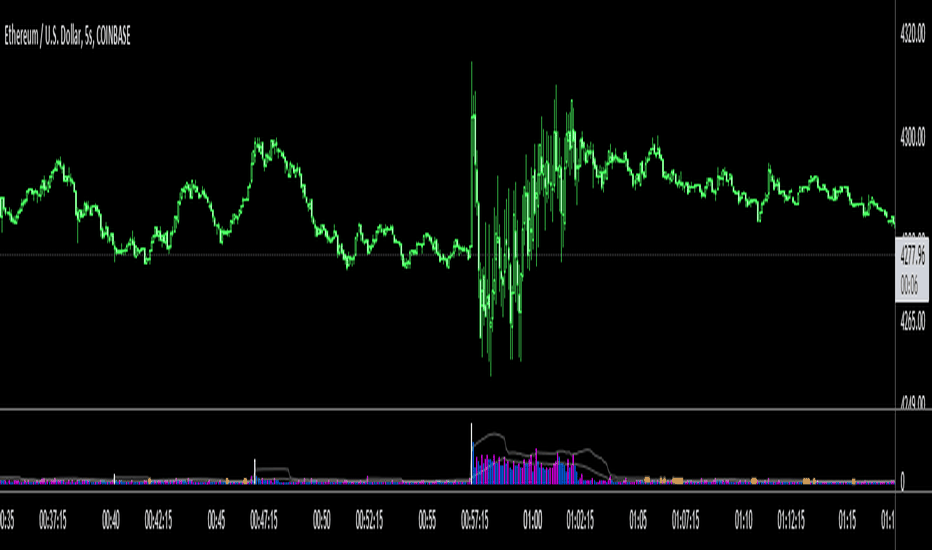
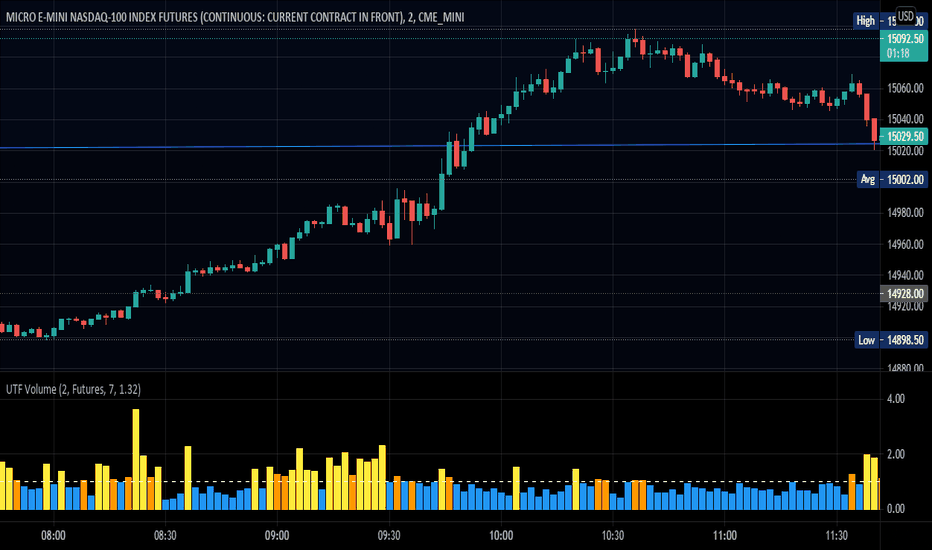
Unusual Time Frame VolumeThis script plots the ratio of each volume bar to the average daily volume of that specific bar (at that specific time of day).
You can see what the volume at the 09:30 (or whenever) bar looks like compared to the average volume at the same time during the previous X number of days.
The output can be read like a normal volume chart; however, you can see at a glance whether these is more volume than "normal" for that time of day.
A value of "2" would be 2x the "normal" volume; a value of "0.5" would be half.
Thus, if bars exceed the value of "1", you know that there is more volume than normal.
If the bar exceeds an adjustable threshold, it will change the color of the bar to yellow; otherwise it will be orange for values exceeding "1".
As a consequence to this approach, the plot is effectively normalized such that it obviates the need to scale up or down as volume changes throughout the day.
Notes:
If the settings are not set appropriately for your mode and time frame, the output will be incorrect/invalid!
Make sure you set the "Asset Mode" and "Time Frame (minutes)" to values that match your asset and chart setting. For example, if you are trading Futures on a 2m chart, set the Asset Mode to Futures and Time Frame to 2m. If you are trading crypto on a 5m chart, set the Asset Mode to 24/7 and Time Frame to 5m.
If you choose a "Look-back (Days)" setting that is too far back given the time frame, the script will produce an error. I suggest playing with settings from 1 (compares volume to the previous day's volume) to the highest number that doesn't break the script. For example, at a 2m time frame, the maximum look-back will be 6-7 depending on which mode you are using. Longer time frames allow larger look-back values. I find that the default value (6 Days) does a decent job in general. Penunjuk
Penunjuk

Realtime Volume Bars w Market Buy/Sell/Neutral split & Mkt Delta
What is it?
A tool that shows Real-time Volume bars split into 3 components: (1) Market Buy Volume - i.e., the volume that got transacted on upticks; (2) Market Sell Volume - i.e., the volume that got transacted on downticks;
and, (3) Neutral Volume - i.e., the volume that got transacted without a change in price. (This feature can be turned off if you want normal volume bars).
Market delta (i.e., Market Buy Volume - Market Sell Volume) is also displayed above each volume bar. (On by default; can be switched off from Settings)
The split and Market Delta data are ONLY AVAILABLE FOR REAL-TIME BARS. Historical bars are shown just like regular ones. The dotted line marks the start of real-time data (i.e., the bar from which the indicator started collecting and displaying data). You will see accurate data for bars to the right of this line. The longer you keep a chart open with the study enabled, the more data it collects and displays, and the better your analysis can potentially be.
Note that the data gets reset every time any of the options is changed, the market is switched, the browser is refreshed, or the script is reloaded
DATA ISN'T STORED. I.e., every time a new symbol is loaded, the previous symbol's data is lost. So if you intend to monitor a symbol, you would need to keep it loaded all the time.
Who is it for?
For traders who are used to analyzing buy/sell activity using market buy/sell volume and market delta information
Although you can use this independently as well, use it in conjunction with "Market Delta Volume for Realtime Bars" indicator to get a better visual representation of the numbers. Penunjuk

Market Delta Volume for Realtime BarsWhat is it?
Market Delta Volume Tool for real-time bars
A market delta tool that shows, (1) the volume that got transacted on upticks - or the market buy volume; (2) the volume that got transacted on downticks - or the market sell volume (3) the market delta volume (i.e., market buy volume - market sell volume); (4) the total volume (market buy volume + market sell volume + neutral volume); and (4) the volume that got transacted without a change in price - or the neutral volume (total volume = market buy volume + market sell volume + neutral volume)
NOTE: THIS WORKS ONLY ON REAL-TIME BARS, NOT ON HISTORICAL BARS! The dotted line marks the start of real-time data (i.e., the bar from which the indicator started collecting and displaying data). You will see accurate data only for bars to the right of this line.
The longer you keep a chart open with the study enabled, the more data it collects and displays and the better your analysis can potentially be.
Note that the data gets reset every time any of the options is changed, the market is switched, the browser is refreshed, or the script is reloaded.
DATA ISN'T STORED. I.e., every time a new symbol is loaded/or the same symbol is reloaded, data gets refreshed.
Who is it for?
For traders who are used to analyzing buy/sell activity using market delta information. Especially, short-term trader/scalpers who are used to keeping the same chart open through the trading session.
Also for traders to see and study how anomalies in volume can give clues to buyer/seller absorption, initiative buying/selling etc.
Can be used to better understand VSA as well, although not necessary.
Essentially, this gives real-time delta volume information; use it however you see fit. Penunjuk