MEW enters accumulation phase before a breakout (3D)From the point marked with the red arrow on the chart, the MEW meme coin has entered a corrective phase, which appears to be an ABC correction that is now nearing completion.
After the completion of such ABC structures, the price can often reverse strongly in the opposite direction.
The range wher
MEW Reacting at Macro Channel FloorMEW is trading on the Daily timeframe inside a large descending channel that has controlled price action for months. The overall structure is clearly bearish, with consistent lower highs and lower lows. Recently, price accelerated downward inside a sharper internal descending channel, showing strong
MEW Main Trend. Memcoin. 2025 07 02Logarithm. Time frame 3 days.
Cat in a dogs world (MEW)
X -133 thousand subscribers (this is not enough).
Reduction from the maximum -87%. For such assets, this is not enough.
I imposed a descending channel on the chart (current descending trend of the main trend), and a horizontal one, if by some
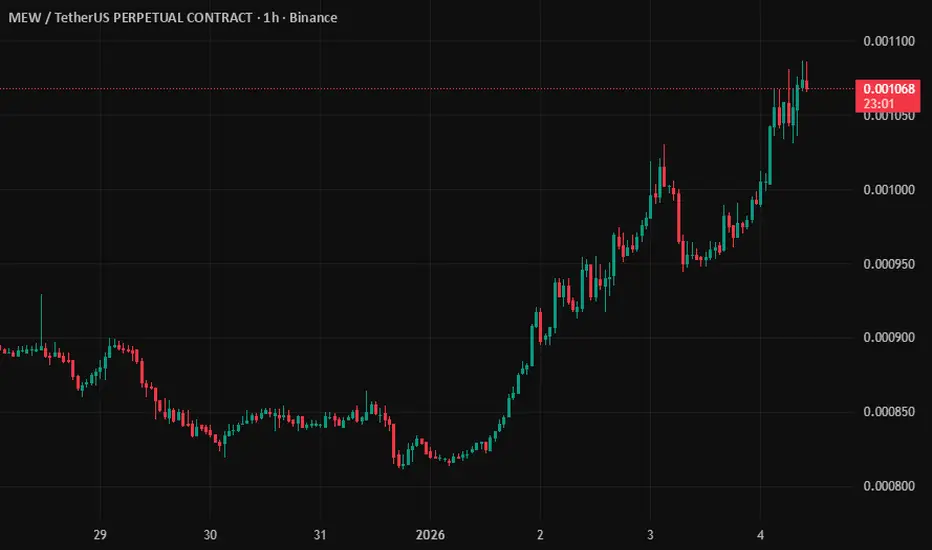
MEWUSDT LONG SIGNAL📢 Trade Setup – MEW/USDT
📈 Position: LONG
💰 Entry Zone:
0.00101 – 0.00106
(Price is reacting inside the marked demand zone after trendline breakout)
🛑 Stop-Loss:
0.00094
(Below the demand zone and structure invalidation)
🎯 Take-Profit Targets:
• TP1: 0.00115
• TP2: 0.00126
• TP3: 0.00137
• TP4: 0.00
MEW Buy/Long Signals (4H)After the bullish CH on the chart, the price has moved strongly to the upside with powerful momentum. The current market structure and price momentum clearly support long buy positions.
We have two entry zones, and positions should be entered using a DCA (Dollar-Cost Averaging) approach to manage r
MEW / USDT : Bullish setup , Watching retest for next leg upMEW / USDT Breakout confirmed from the descending trendline. Price is retesting the demand zone, and as long as this support holds, we can expect bullish continuation towards higher levels. Breakdown below the zone will invalidate the setup.
MEWUSDT 1D#MEW is moving within a symmetrical triangle on the daily chart and is currently sitting on the daily SMA200. In case of a bounce, we can expect it to move toward the triangle resistance and potentially break above it. If that happens, the targets are:
🎯 $0.003647
🎯 $0.004104
🎯 $0.004797
Mid-term
MEWU/USDT — Symmetrical Triangle: A Major Breakout is Coming?📝 Summary
The MEWU/USDT pair is currently consolidating after a strong downtrend since early 2025. Price has been compressing into a symmetrical triangle pattern, trapped between a horizontal support zone at 0.0027–0.0033 and a descending resistance trendline.
The structure is now very close to its
MEW/USDT Retesting Key Zone, Ready for the Next Move?📊 Technical Analysis:
MEW/USDT on the 2D timeframe shows a compelling structure with a Symmetrical Triangle pattern breakout that occurred in late July 2025. This breakout indicates a potential trend reversal from bearish to bullish.
Currently, the price is performing a retest of the breakout leve
See all ideas
Summarizing what the indicators are suggesting.
Oscillators
Neutral
SellBuy
Strong sellStrong buy
Strong sellSellNeutralBuyStrong buy
Oscillators
Neutral
SellBuy
Strong sellStrong buy
Strong sellSellNeutralBuyStrong buy
Summary
Neutral
SellBuy
Strong sellStrong buy
Strong sellSellNeutralBuyStrong buy
Summary
Neutral
SellBuy
Strong sellStrong buy
Strong sellSellNeutralBuyStrong buy
Summary
Neutral
SellBuy
Strong sellStrong buy
Strong sellSellNeutralBuyStrong buy
Moving Averages
Neutral
SellBuy
Strong sellStrong buy
Strong sellSellNeutralBuyStrong buy
Moving Averages
Neutral
SellBuy
Strong sellStrong buy
Strong sellSellNeutralBuyStrong buy
Displays a symbol's price movements over previous years to identify recurring trends.