
🐳 BIGBELUGA TRADING ROADMAP
Course 01 — Classical Technical Analysis · Lesson 2
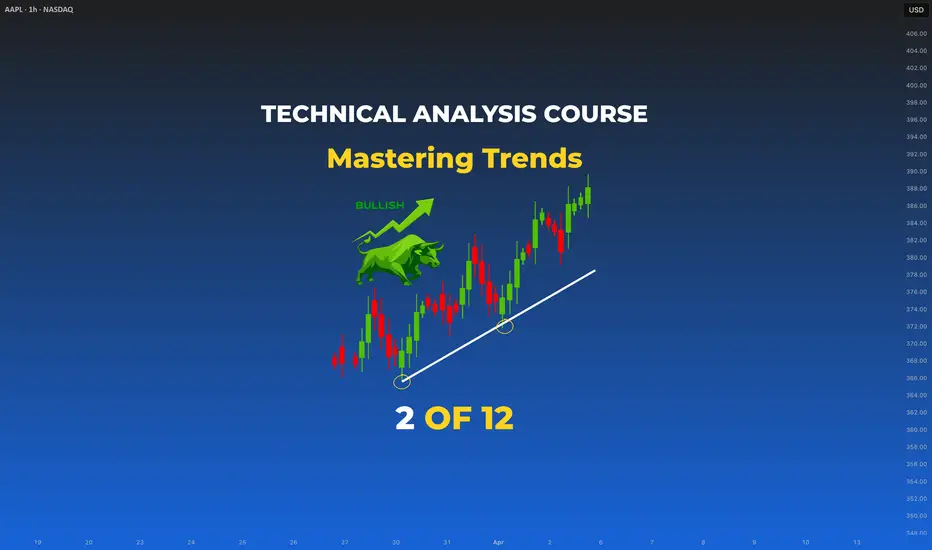
Mastering Trends: How to Read Direction and Draw Lines That Hold
Difficulty: 🐳🐋🐋🐋🐋 (Beginner)
"The trend is your friend" is the most repeated cliché in trading — and the least understood. Most traders cannot reliably identify which trend they are in, let alone reconcile conflicting trends across timeframes. This lesson fixes both. After this, you read direction the way professionals do.

🔵 WHY TREND READING IS THE MOST IMPORTANT SKILL
Every successful trade has one thing in common: it was taken in alignment with a meaningful trend on the correct timeframe.
You can master entries, exits, indicators, and risk — but if you systematically trade against the dominant trend, you lose. The market is a direction-following machine. Your job is to read direction before anything else.
🔵 1. THE THREE TRENDS
Price can do only three things:
Every chart, on every timeframe, is always in one of these three states. Identify which one before doing anything else.

Downtrend: sellers control. Each rally fails at a lower high, each leg breaks the prior low. Long entries fight the dominant flow.

Range: buyers and sellers are temporarily balanced. Price oscillates between two horizontal levels. Trend-following strategies fail here; mean-reversion thrives.
🐳 Pro Tip: If you cannot classify the current chart as one of the three states within 5 seconds, you do not have a setup — you have a guess.
🔵 2. HOW TO DRAW A VALID TRENDLINE
A trendline is not a decorative line. It is a structural rule.

The 3-touch rule:
Until the line has three rejections from price, it is not a tool — it is a guess.
Construction:
🐳 Pro Tip: More touches = stronger trendline = more meaningful break when it eventually fails.
🔵 3. INTERNAL vs EXTERNAL TRENDLINES
Most traders only know one type. Professionals use both.

External trendline: connects the extreme wicks. Captures the absolute boundary of price.
Internal trendline: connects the candle bodies, ignoring the wicks. Captures where real momentum and decision-making lives.
When they conflict, the internal line breaks first and gives the earlier warning. The external line provides the final confirmation. Watch both, trade the second.
🔵 4. THE FRACTAL NATURE OF TRENDS
This is the section that separates amateurs from professionals.
A trend on one timeframe is often a correction inside a larger trend on a higher timeframe. The market is fractal — the same patterns repeat at every scale, but their meaning depends on context.

Example:
All three are simultaneously true. None of them is wrong. They serve different purposes.
How to trade this:
🐳 Pro Tip: Counter-trend trades inside a strong higher-timeframe trend are not "shorting an uptrend" — they are scalping a correction. Know what you are doing before you call it a trade.
🔵 5. TRENDLINE BREAKS — REAL vs FAKEOUT
The break is where most traders lose money.
A trendline break is not price touching the line. It is not one candle poking through. It is when price closes decisively beyond the line and confirms with follow-through.

Real break — checklist:

Fakeout — warning signs:
🐳 Pro Tip: Never trade the break itself. Trade the retest. You sacrifice the initial move but you avoid 80% of fakeouts.
🔵 6. COMMON BEGINNER MISTAKES
🔵 7. YOUR TREND-READING FRAMEWORK
Before any trade, ask these four questions in order:
These four questions, asked every time, will filter out the majority of losing trades.
🔵 QUICK SELF-CHECK
🔵 WHAT IS NEXT
Lesson 3 — Support & Resistance: now that you can read direction and draw lines, the next layer is the horizontal levels price keeps respecting. We will cover static vs dynamic levels, flip zones, and how to rank a level's strength before trading off it.
Drop a comment: have you ever shorted a "downtrend" only to discover you were fighting a larger uptrend? Tell us where.
Best Regards, BigBeluga 🐳
Course 01 — Classical Technical Analysis · Lesson 2
Mastering Trends: How to Read Direction and Draw Lines That Hold
Difficulty: 🐳🐋🐋🐋🐋 (Beginner)
"The trend is your friend" is the most repeated cliché in trading — and the least understood. Most traders cannot reliably identify which trend they are in, let alone reconcile conflicting trends across timeframes. This lesson fixes both. After this, you read direction the way professionals do.
🔵 WHY TREND READING IS THE MOST IMPORTANT SKILL
Every successful trade has one thing in common: it was taken in alignment with a meaningful trend on the correct timeframe.
You can master entries, exits, indicators, and risk — but if you systematically trade against the dominant trend, you lose. The market is a direction-following machine. Your job is to read direction before anything else.
🔵 1. THE THREE TRENDS
Price can do only three things:
- Trend up — Higher Highs (HH) and Higher Lows (HL)
- Trend down — Lower Highs (LH) and Lower Lows (LL)
- Move sideways — Equal highs and equal lows inside a range
Every chart, on every timeframe, is always in one of these three states. Identify which one before doing anything else.
Downtrend: sellers control. Each rally fails at a lower high, each leg breaks the prior low. Long entries fight the dominant flow.
Range: buyers and sellers are temporarily balanced. Price oscillates between two horizontal levels. Trend-following strategies fail here; mean-reversion thrives.
🐳 Pro Tip: If you cannot classify the current chart as one of the three states within 5 seconds, you do not have a setup — you have a guess.
🔵 2. HOW TO DRAW A VALID TRENDLINE
A trendline is not a decorative line. It is a structural rule.
The 3-touch rule:
- 1 touch = a point in space
- 2 touches = a hypothesis
- 3+ touches = a validated trendline
Until the line has three rejections from price, it is not a tool — it is a guess.
Construction:
- Uptrend → connect the rising lows (the floor of the move)
- Downtrend → connect the falling highs (the ceiling of the move)
- Range → draw two horizontal lines, one across the highs, one across the lows
🐳 Pro Tip: More touches = stronger trendline = more meaningful break when it eventually fails.
🔵 3. INTERNAL vs EXTERNAL TRENDLINES
Most traders only know one type. Professionals use both.
External trendline: connects the extreme wicks. Captures the absolute boundary of price.
Internal trendline: connects the candle bodies, ignoring the wicks. Captures where real momentum and decision-making lives.
When they conflict, the internal line breaks first and gives the earlier warning. The external line provides the final confirmation. Watch both, trade the second.
🔵 4. THE FRACTAL NATURE OF TRENDS
This is the section that separates amateurs from professionals.
A trend on one timeframe is often a correction inside a larger trend on a higher timeframe. The market is fractal — the same patterns repeat at every scale, but their meaning depends on context.
Example:
- On the Daily — price is in a clean uptrend (the dominant bias)
- On the 4H — price is in a corrective downtrend (a pullback inside the larger uptrend)
- On the 15M — price is in a small uptrend (the rally that ends the pullback and resumes the larger move)
All three are simultaneously true. None of them is wrong. They serve different purposes.
How to trade this:
- Use the higher timeframe (Daily / Weekly) to define your directional bias — long-only or short-only
- Use the middle timeframe (4H / 1H) to identify the corrective phase that gives you entry opportunity
- Use the lower timeframe (15M / 5M) to execute when the correction ends and the dominant trend resumes
🐳 Pro Tip: Counter-trend trades inside a strong higher-timeframe trend are not "shorting an uptrend" — they are scalping a correction. Know what you are doing before you call it a trade.
🔵 5. TRENDLINE BREAKS — REAL vs FAKEOUT
The break is where most traders lose money.
A trendline break is not price touching the line. It is not one candle poking through. It is when price closes decisively beyond the line and confirms with follow-through.
Real break — checklist:
- Strong candle closes beyond the line (body, not just wick)
- Volume expansion on the break candle
- Follow-through candle in the new direction
- Successful retest of the broken line as new support/resistance
Fakeout — warning signs:
- Wick beyond the line, body stays inside
- Volume contraction on the break attempt
- Immediate snap-back inside within 1–2 candles
- No retest — price refuses to revisit the line
🐳 Pro Tip: Never trade the break itself. Trade the retest. You sacrifice the initial move but you avoid 80% of fakeouts.
🔵 6. COMMON BEGINNER MISTAKES
- Drawing trendlines with only 2 touches and treating them as valid
- Forcing a trendline because you want it to be there (confirmation bias)
- Trading the first poke through the line — the textbook fakeout
- Ignoring the higher-timeframe trend when entering on lower timeframes
- Using only external trendlines and missing internal momentum shifts
- Treating a trendline break as a guaranteed trend reversal
- Trading counter-trend without realizing you are inside a stronger opposing higher-timeframe trend
🔵 7. YOUR TREND-READING FRAMEWORK
Before any trade, ask these four questions in order:
- What is the dominant trend on the higher timeframe? (Weekly / Daily)
- Is the lower timeframe aligned with that trend, or correcting against it?
- How many touches does my trendline have?
- If there is a break — was it a clean body close with follow-through, or just a wick?
These four questions, asked every time, will filter out the majority of losing trades.
🔵 QUICK SELF-CHECK
- Classify any chart as uptrend / downtrend / range in under 5 seconds
- Draw a valid trendline with 3+ touch confirmation
- Recognize the difference between an internal and external trendline
- Read the same instrument across three timeframes and explain how the trends relate
- Tell a real break from a fakeout before you react
🔵 WHAT IS NEXT
Lesson 3 — Support & Resistance: now that you can read direction and draw lines, the next layer is the horizontal levels price keeps respecting. We will cover static vs dynamic levels, flip zones, and how to rank a level's strength before trading off it.
Drop a comment: have you ever shorted a "downtrend" only to discover you were fighting a larger uptrend? Tell us where.
Best Regards, BigBeluga 🐳

🔵Gain access to our powerful tools : bigbeluga.com/tv
🔵Join our free discord for updates : discord.com/invite/FuW63RKgdc
All scripts & content provided by BigBeluga are for informational & educational purposes only.
🔵Join our free discord for updates : discord.com/invite/FuW63RKgdc
All scripts & content provided by BigBeluga are for informational & educational purposes only.
Wyłączenie odpowiedzialności
Informacje i publikacje nie stanowią i nie powinny być traktowane jako porady finansowe, inwestycyjne, tradingowe ani jakiekolwiek inne rekomendacje dostarczane lub zatwierdzone przez TradingView. Więcej informacji znajduje się w Warunkach użytkowania.
🔵Gain access to our powerful tools : bigbeluga.com/tv
🔵Join our free discord for updates : discord.com/invite/FuW63RKgdc
All scripts & content provided by BigBeluga are for informational & educational purposes only.
🔵Join our free discord for updates : discord.com/invite/FuW63RKgdc
All scripts & content provided by BigBeluga are for informational & educational purposes only.
Wyłączenie odpowiedzialności
Informacje i publikacje nie stanowią i nie powinny być traktowane jako porady finansowe, inwestycyjne, tradingowe ani jakiekolwiek inne rekomendacje dostarczane lub zatwierdzone przez TradingView. Więcej informacji znajduje się w Warunkach użytkowania.