
📈 ABCA (ABC Arbitrage) — Technical Structure Analysis
Chart Visual & Pattern Layout: ChartsSpecialist (via TradingView)
🔍 Technical Observations
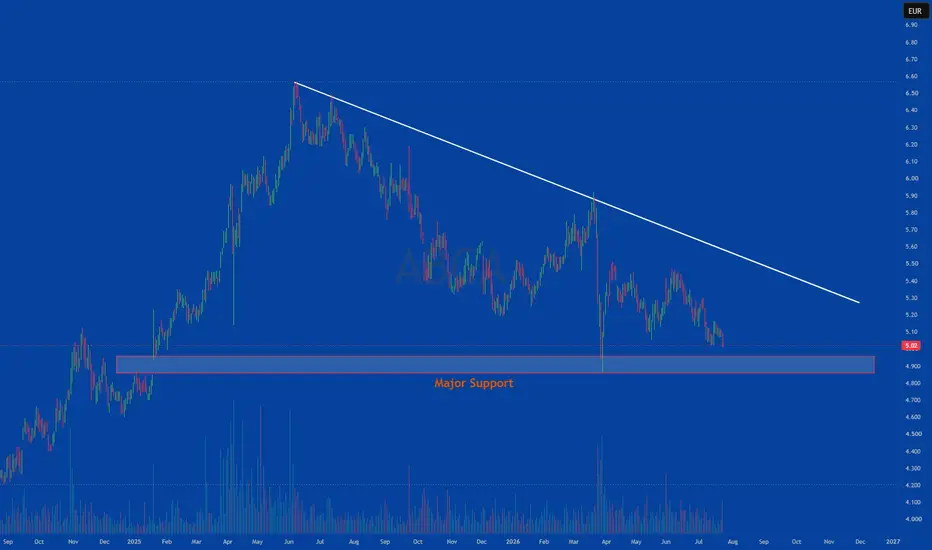
Major Support Zone Re-test: The chart highlights a prominent horizontal demand channel annotated as "Major Support," which historical price action previously bounced from during early-stage advances.
Descending Resistance Trendline: A extended downward-sloping trendline connects successive lower swing highs, acting as active dynamic overhead resistance.
Price Approach to Base: Following rejections at the overhead trendline, price action has steadily pulled back and is currently stabilizing near the upper boundary of the "Major Support" band.
📚 Technical Analysis Concepts Demonstrated
Multi-Month Dynamic Resistance: Observing trendline behavior in prolonged corrective market structures.
Demand Zone Integrity: Analyzing price reaction and volatility contraction as price approaches major horizontal support levels.
Descending Triangle Dynamics: Examining the interaction between a falling resistance line and a flat, horizontal support level.
📌 SEBI Compliant Educational Disclaimer
Regulatory Disclaimer & Disclosures:
Educational Purpose Only: This post analyzes chart patterns and technical concepts strictly for learning and educational purposes.
No Recommendation: This content does NOT contain target levels, stop-loss triggers, entry calls, or buy/sell/hold recommendations.
SEBI Registration Status: ChartsSpecialist and the publisher are NOT SEBI-registered Research Analysts or Investment Advisors.
Risk Warning: Securities trading involves market risk. Past patterns do not guarantee future price movements. Please consult a qualified financial advisor before taking any market positions.
#ChartsSpecialist #ABCA #TechnicalAnalysis #ChartReading #StockMarketEducation #SEBICompliant #PriceAction #TradingView #FinancialLiteracy #SupportAndResistance #Trendlines

Wyłączenie odpowiedzialności
Informacje i publikacje nie stanowią i nie powinny być traktowane jako porady finansowe, inwestycyjne, tradingowe ani jakiekolwiek inne rekomendacje dostarczane lub zatwierdzone przez TradingView. Więcej informacji znajduje się w Warunkach użytkowania.
Wyłączenie odpowiedzialności
Informacje i publikacje nie stanowią i nie powinny być traktowane jako porady finansowe, inwestycyjne, tradingowe ani jakiekolwiek inne rekomendacje dostarczane lub zatwierdzone przez TradingView. Więcej informacji znajduje się w Warunkach użytkowania.