Continuation via Symmetrical Triangle
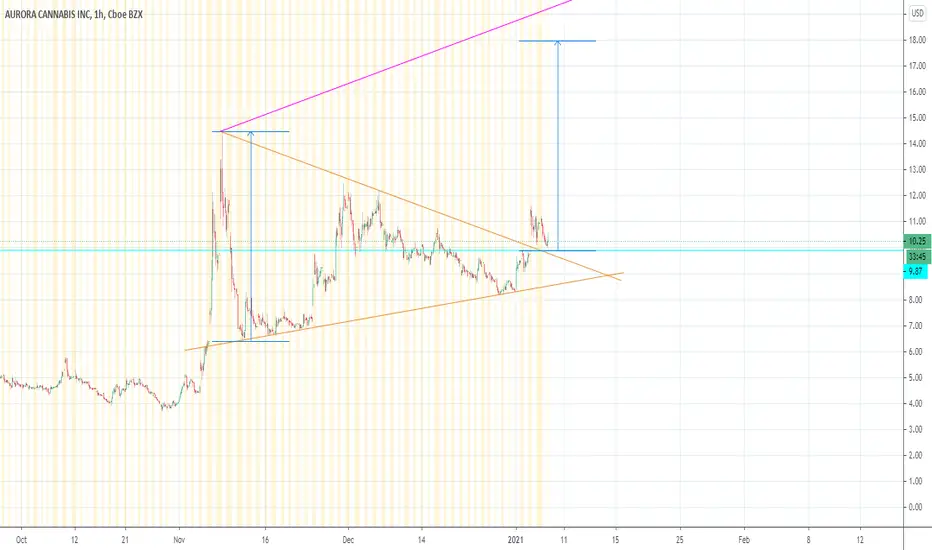
Hourly chart showing ACB making higher lows and lower highs to form a symmetrical triangle. Potential trend continuation following a breakout of the triangle, and back test of the upper trendline of the triangle. See SunRun,  RUN for a similar setup and how it can play out. GLTA!
Wyłączenie odpowiedzialności
Informacje i publikacje nie stanowią i nie powinny być traktowane jako porady finansowe, inwestycyjne, tradingowe ani jakiekolwiek inne rekomendacje dostarczane lub zatwierdzone przez TradingView. Więcej informacji znajduje się w Warunkach użytkowania.
Wyłączenie odpowiedzialności
Informacje i publikacje nie stanowią i nie powinny być traktowane jako porady finansowe, inwestycyjne, tradingowe ani jakiekolwiek inne rekomendacje dostarczane lub zatwierdzone przez TradingView. Więcej informacji znajduje się w Warunkach użytkowania.