
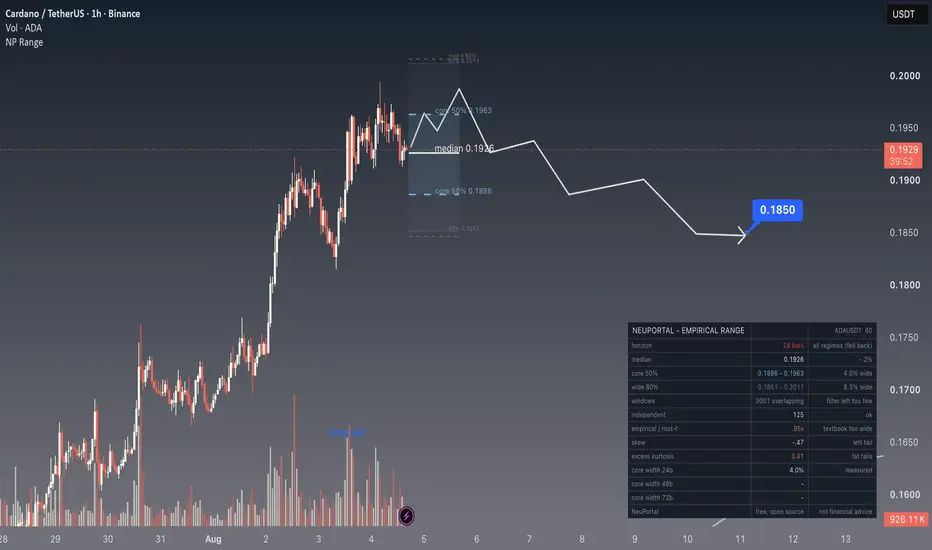
Measured rather than assumed. Every level here is a quantile of what ADA has actually done over the following 24 one-hour bars on this chart's own history. Nothing is fitted and no distribution is imposed on it.
Median 0.1926
Core 50% 0.1886 - 0.1963 (4.0% of spot)
Wide 80% 0.1851 - 0.2011 (8.3%)
THE CAVEAT PRINTS IN RED, SO IT GOES FIRST
Two rows are flagged. The horizon reads all regimes (fell back) and the window count reads filter left too few. The intent is to keep only windows that opened in conditions close to the present ones; not enough of those existed here, so the estimate reverted to the full sample of 3,001 overlapping windows.
The direction of that error is knowable even where its size is not. Pooling every regime pulls the calm stretches and the violent ones into one figure, which leaves a standing margin for conditions today has not necessarily produced. Our published scoring shows precisely that outcome on our own record: stated fifty per cent intervals holding far more than fifty per cent of results, which is a failure of calibration and the quiet kind. Treat what follows as likelier loose than tight.
The width-scaling cells are empty for the same reason. 4.0% is measured at 24 bars; at 48 and 72 the matched history ran out, and a blank is the correct contents of a cell nobody measured.
TWO INSTRUMENTS, TWO OPPOSITE ERRORS
Worth setting side by side, because the same indicator produced both readings within the hour.
Width. The fifty per cent core here spans 4.0% of spot across twenty-four hours. On gold at the same horizon and resolution that figure is 2.1%. Close to double, and nobody had to decide that a token moves more than a metal - the windows said so.
Error direction of the textbook. Empirical width on ADA is 0.95x the sigma-root-t band, so the conventional formula runs slightly wide. On gold the same ratio prints 1.31x, meaning it runs narrow there. One equation, two markets, errors in opposite directions, which is a fair argument for reading the sample rather than the formula.
Tails are present and unremarkable by the standards of this asset class: skew -0.47, excess kurtosis 3.41. The left side carries more weight, though less lopsidedly than on several instruments we follow.
NO DIRECTIONAL LEAN
The median sits 0.2% under spot, which is a rounding distance rather than a view, and it is published as one.
What this post contains is a distance and the caveats attached to measuring it. No entry, no exit and no level worth defending is proposed anywhere in it.
Educational content - not financial advice.
Median 0.1926
Core 50% 0.1886 - 0.1963 (4.0% of spot)
Wide 80% 0.1851 - 0.2011 (8.3%)
THE CAVEAT PRINTS IN RED, SO IT GOES FIRST
Two rows are flagged. The horizon reads all regimes (fell back) and the window count reads filter left too few. The intent is to keep only windows that opened in conditions close to the present ones; not enough of those existed here, so the estimate reverted to the full sample of 3,001 overlapping windows.
The direction of that error is knowable even where its size is not. Pooling every regime pulls the calm stretches and the violent ones into one figure, which leaves a standing margin for conditions today has not necessarily produced. Our published scoring shows precisely that outcome on our own record: stated fifty per cent intervals holding far more than fifty per cent of results, which is a failure of calibration and the quiet kind. Treat what follows as likelier loose than tight.
The width-scaling cells are empty for the same reason. 4.0% is measured at 24 bars; at 48 and 72 the matched history ran out, and a blank is the correct contents of a cell nobody measured.
TWO INSTRUMENTS, TWO OPPOSITE ERRORS
Worth setting side by side, because the same indicator produced both readings within the hour.
Width. The fifty per cent core here spans 4.0% of spot across twenty-four hours. On gold at the same horizon and resolution that figure is 2.1%. Close to double, and nobody had to decide that a token moves more than a metal - the windows said so.
Error direction of the textbook. Empirical width on ADA is 0.95x the sigma-root-t band, so the conventional formula runs slightly wide. On gold the same ratio prints 1.31x, meaning it runs narrow there. One equation, two markets, errors in opposite directions, which is a fair argument for reading the sample rather than the formula.
Tails are present and unremarkable by the standards of this asset class: skew -0.47, excess kurtosis 3.41. The left side carries more weight, though less lopsidedly than on several instruments we follow.
NO DIRECTIONAL LEAN
The median sits 0.2% under spot, which is a rounding distance rather than a view, and it is published as one.
What this post contains is a distance and the caveats attached to measuring it. No entry, no exit and no level worth defending is proposed anywhere in it.
Educational content - not financial advice.
Uwaga
Update, two days on. Two things are being tracked on this chart and they answer to different clocks, so here they are separately.The 24-hour band from the indicator has resolved. Sealed at 0.1921 on 4 August at 16:00 UTC, settled at 0.1912 twenty-four hours later. That is inside the 50% core of 0.1886 to 0.1963, with the median missing by 0.73%. One detail worth pointing at: the lowest print inside that window was 0.1886, which is the lower core bound to four decimal places. Coincidence, and a pretty one.
The hand-drawn path runs to its own endpoint on a longer clock. Its sequence was a high, then a decline, then a bounce. In order: 0.1990 on 5 August at 09:00, down to 0.1859 on the 6th at 04:00, back to 0.1908 six hours later. Price now sits at 0.1887 and the endpoint at 0.1850 is 1.96% below it. The low came within nine ten-thousandths of that endpoint without reaching it.
The honest weighting of all this: a 50% interval is supposed to contain the outcome half the time, so a single hit carries almost no information. It carries less than usual for us, because our published record shows these intervals catching far more often than the label allows. A miss would have been the more interesting result. This one was not.
Educational content - not financial advice.

Wyłączenie odpowiedzialności
Informacje i publikacje nie stanowią i nie powinny być traktowane jako porady finansowe, inwestycyjne, tradingowe ani jakiekolwiek inne rekomendacje dostarczane lub zatwierdzone przez TradingView. Więcej informacji znajduje się w Warunkach użytkowania.
Wyłączenie odpowiedzialności
Informacje i publikacje nie stanowią i nie powinny być traktowane jako porady finansowe, inwestycyjne, tradingowe ani jakiekolwiek inne rekomendacje dostarczane lub zatwierdzone przez TradingView. Więcej informacji znajduje się w Warunkach użytkowania.