
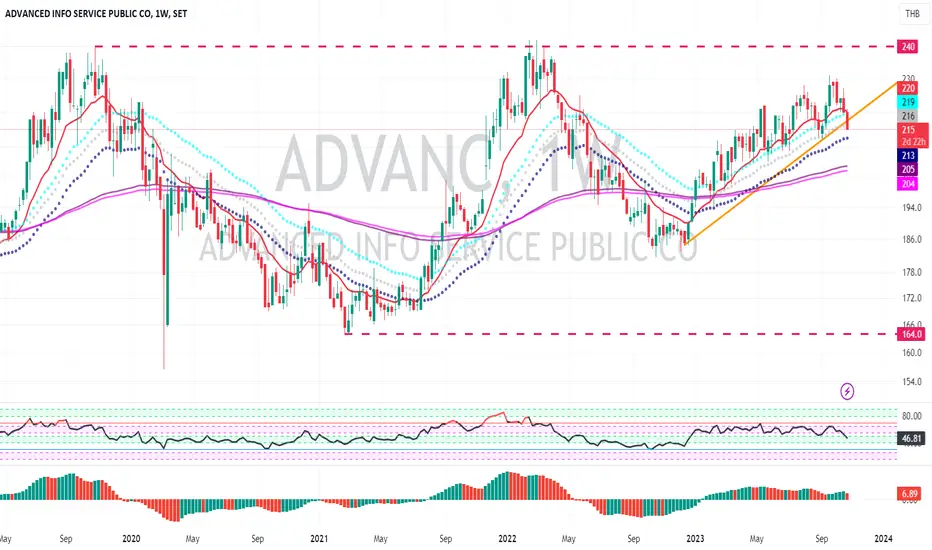
ADVANC , Week Chart , have been sideway in the trading range since 2020
and this week is the first week that price start reverse down and break out the trendline.
RSI and AO show weak momentum signal.
We should monitor how deep that this chart go down by using the daily chart to monitor more detail.
and this week is the first week that price start reverse down and break out the trendline.
RSI and AO show weak momentum signal.
We should monitor how deep that this chart go down by using the daily chart to monitor more detail.

Pragasit Thitaram, CEWA
Wyłączenie odpowiedzialności
Informacje i publikacje nie stanowią i nie powinny być traktowane jako porady finansowe, inwestycyjne, tradingowe ani jakiekolwiek inne rekomendacje dostarczane lub zatwierdzone przez TradingView. Więcej informacji znajduje się w Warunkach użytkowania.
Pragasit Thitaram, CEWA
Wyłączenie odpowiedzialności
Informacje i publikacje nie stanowią i nie powinny być traktowane jako porady finansowe, inwestycyjne, tradingowe ani jakiekolwiek inne rekomendacje dostarczane lub zatwierdzone przez TradingView. Więcej informacji znajduje się w Warunkach użytkowania.