
Trend & Structure (SMA Analysis)
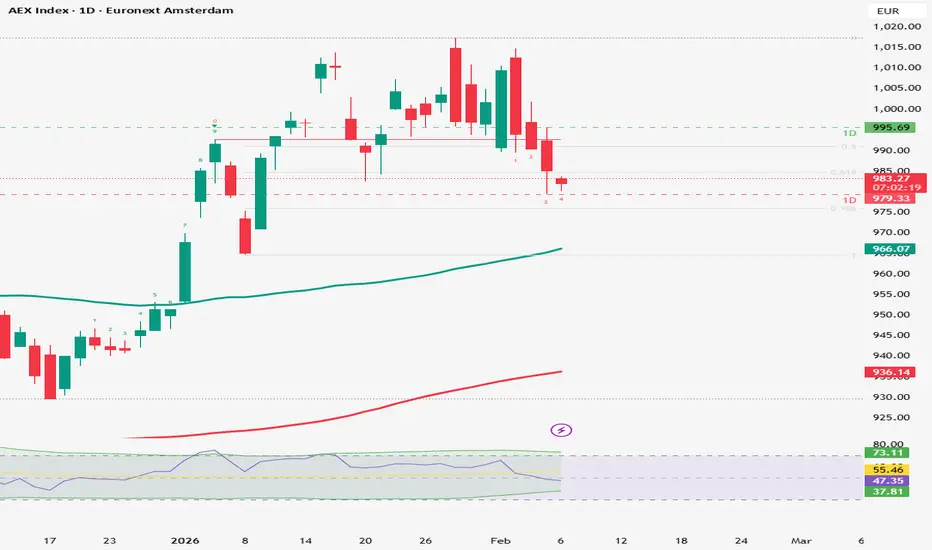
Primary trend:Price trades well above the SMA200, keeping the primary trend bullish despite the current pullback.
Intermediate trend:SMA55 is rising, but price has dipped below it, signaling weakening structure in the intermediate trend. This often suggests consolidation or a corrective phase within a broader uptrend.
Short-term trend:Short-term structure is bearish-biased as the AEX continues to print lower highs and retests support zones.
Key takeaway:
“As long as price remains above the SMA 55 and 200, the trend bias stays bullish.”
Swing Sequencer
Current swing count: 4
Today’s signal: red candle with red Swing Count
Interpretation: The chart shows a continuation of the corrective phase, consistent with the red candle structure. Price is losing upward swing momentum, aligning with a downswing sequence.
Key takeaway:
“A renewed downswing is likely underway unless upward price action reclaims the prior support turned resistance.”
Momentum (RSI)
Interpretations:
Key takeaway:
“RSI at 46.05 is not showing bullish divergence at this stage.”
Key Levels to Watch
Support:
Resistance:
Key takeaway:
“A break bellow 975 opens the door toward SMA55 at 965.”
Outlook for the Next Trading Day
If the AEX holds above 975, a short‑term bounce is possible.However:
A close below 975 opens the path toward 965, and a deeper correction toward the mid‑940 zone remains possible if momentum weakens further. Upside requires a break back above 985, which would signal buyers regaining control.
Disclaimer
All content is for informational and educational purposes only and does not constitute financial advice. Trading involves risk; always conduct your own research.
Primary trend:Price trades well above the SMA200, keeping the primary trend bullish despite the current pullback.
Intermediate trend:SMA55 is rising, but price has dipped below it, signaling weakening structure in the intermediate trend. This often suggests consolidation or a corrective phase within a broader uptrend.
Short-term trend:Short-term structure is bearish-biased as the AEX continues to print lower highs and retests support zones.
Key takeaway:
“As long as price remains above the SMA 55 and 200, the trend bias stays bullish.”
Swing Sequencer
Current swing count: 4
Today’s signal: red candle with red Swing Count
Interpretation: The chart shows a continuation of the corrective phase, consistent with the red candle structure. Price is losing upward swing momentum, aligning with a downswing sequence.
Key takeaway:
“A renewed downswing is likely underway unless upward price action reclaims the prior support turned resistance.”
Momentum (RSI)
- RSI value: 46.05
- Zone: neutral, no oversold signal yet
- Behavior: drifting lower
Interpretations:
- weakening momentum
- sellers gaining short-term control
- no oversold signal yet
- room for continuation of the correction
Key takeaway:
“RSI at 46.05 is not showing bullish divergence at this stage.”
Key Levels to Watch
Support:
- S1: 965
- S2: 950
Resistance:
- R1: 1015
- R2: 1030
Key takeaway:
“A break bellow 975 opens the door toward SMA55 at 965.”
Outlook for the Next Trading Day
If the AEX holds above 975, a short‑term bounce is possible.However:
A close below 975 opens the path toward 965, and a deeper correction toward the mid‑940 zone remains possible if momentum weakens further. Upside requires a break back above 985, which would signal buyers regaining control.
Disclaimer
All content is for informational and educational purposes only and does not constitute financial advice. Trading involves risk; always conduct your own research.

Wyłączenie odpowiedzialności
Informacje i publikacje nie stanowią i nie powinny być traktowane jako porady finansowe, inwestycyjne, tradingowe ani jakiekolwiek inne rekomendacje dostarczane lub zatwierdzone przez TradingView. Więcej informacji znajduje się w Warunkach użytkowania.
Wyłączenie odpowiedzialności
Informacje i publikacje nie stanowią i nie powinny być traktowane jako porady finansowe, inwestycyjne, tradingowe ani jakiekolwiek inne rekomendacje dostarczane lub zatwierdzone przez TradingView. Więcej informacji znajduje się w Warunkach użytkowania.