
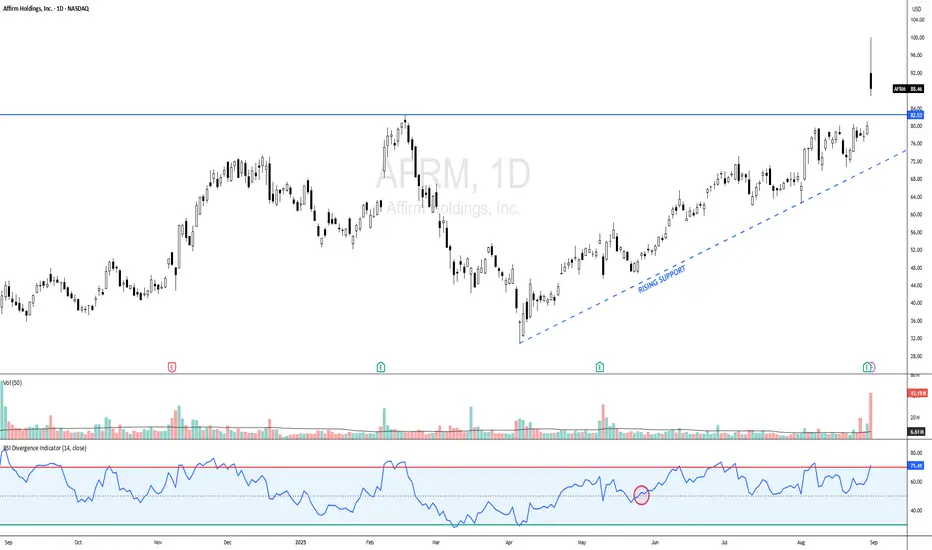
AFRM - CURRENT PRICE :88.46
AFRM made a new 52-week high last Friday with burst in trading activity. The 52-week high resistance level near 82.00 - 83.00 is considered significant resistance level based on the share price history as it had been touched several times. One of the bullish signs for this stock is that the RSI is moving above 50 level steadily since 27 May 2025 - look at the red circle. Take note also that there is a rising support line - indicating demand is getting higher. There is possibility that the stock may trend higher in near term.
ENTRY PRICE : 83.00 - 89.00
TARGET : 97.00 and 104.00
SUPPORT : 78.00
Notes : For chart pattern lovers, look at the heliview chart (bigger picture). There is a CUP & HANDLE pattern !
AFRM made a new 52-week high last Friday with burst in trading activity. The 52-week high resistance level near 82.00 - 83.00 is considered significant resistance level based on the share price history as it had been touched several times. One of the bullish signs for this stock is that the RSI is moving above 50 level steadily since 27 May 2025 - look at the red circle. Take note also that there is a rising support line - indicating demand is getting higher. There is possibility that the stock may trend higher in near term.
ENTRY PRICE : 83.00 - 89.00
TARGET : 97.00 and 104.00
SUPPORT : 78.00
Notes : For chart pattern lovers, look at the heliview chart (bigger picture). There is a CUP & HANDLE pattern !

Wyłączenie odpowiedzialności
Informacje i publikacje nie stanowią i nie powinny być traktowane jako porady finansowe, inwestycyjne, tradingowe ani jakiekolwiek inne rekomendacje dostarczane lub zatwierdzone przez TradingView. Więcej informacji znajduje się w Warunkach użytkowania.
Wyłączenie odpowiedzialności
Informacje i publikacje nie stanowią i nie powinny być traktowane jako porady finansowe, inwestycyjne, tradingowe ani jakiekolwiek inne rekomendacje dostarczane lub zatwierdzone przez TradingView. Więcej informacji znajduje się w Warunkach użytkowania.