
🔮 #AI Analysis 💰💰
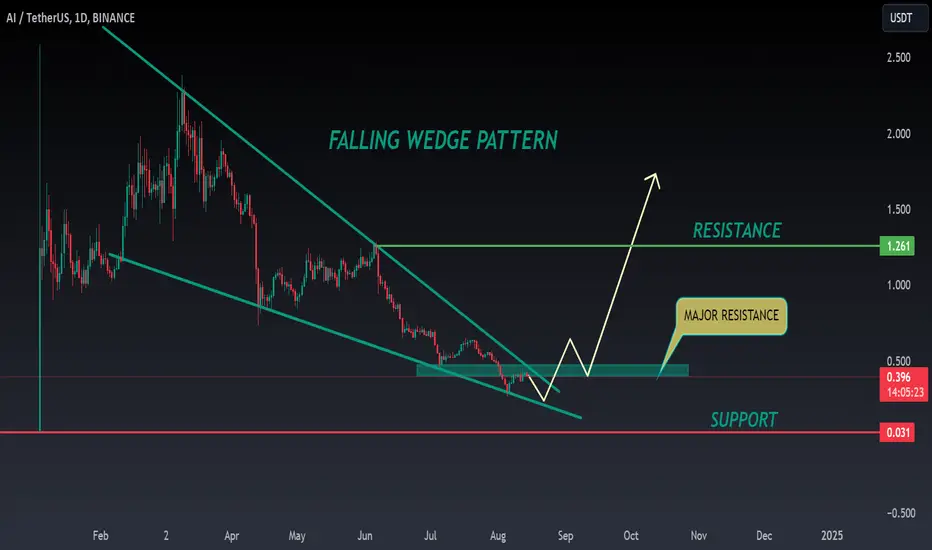
🌟🚀In daily chart we can see a formation "Falling Wedge Pattern" in #AI. Currently #AI is testing its major resistance level. If #AI breaks and holds this resistance then we will see a good bullish move.💲💲
🔖 Current Price: $0.397
⏳ Target Price: $1.260
⁉️ What to do?
- We have marked some crucial levels in the chart. We can trade according to the chart and make some profits in #AI. 🚀💸
#AI #Cryptocurrency #DYOR #PotentialBreakout
🌟🚀In daily chart we can see a formation "Falling Wedge Pattern" in #AI. Currently #AI is testing its major resistance level. If #AI breaks and holds this resistance then we will see a good bullish move.💲💲
🔖 Current Price: $0.397
⏳ Target Price: $1.260
⁉️ What to do?
- We have marked some crucial levels in the chart. We can trade according to the chart and make some profits in #AI. 🚀💸
#AI #Cryptocurrency #DYOR #PotentialBreakout

Powiązane publikacje
Wyłączenie odpowiedzialności
Informacje i publikacje nie stanowią i nie powinny być traktowane jako porady finansowe, inwestycyjne, tradingowe ani jakiekolwiek inne rekomendacje dostarczane lub zatwierdzone przez TradingView. Więcej informacji znajduje się w Warunkach użytkowania.
Powiązane publikacje
Wyłączenie odpowiedzialności
Informacje i publikacje nie stanowią i nie powinny być traktowane jako porady finansowe, inwestycyjne, tradingowe ani jakiekolwiek inne rekomendacje dostarczane lub zatwierdzone przez TradingView. Więcej informacji znajduje się w Warunkach użytkowania.