
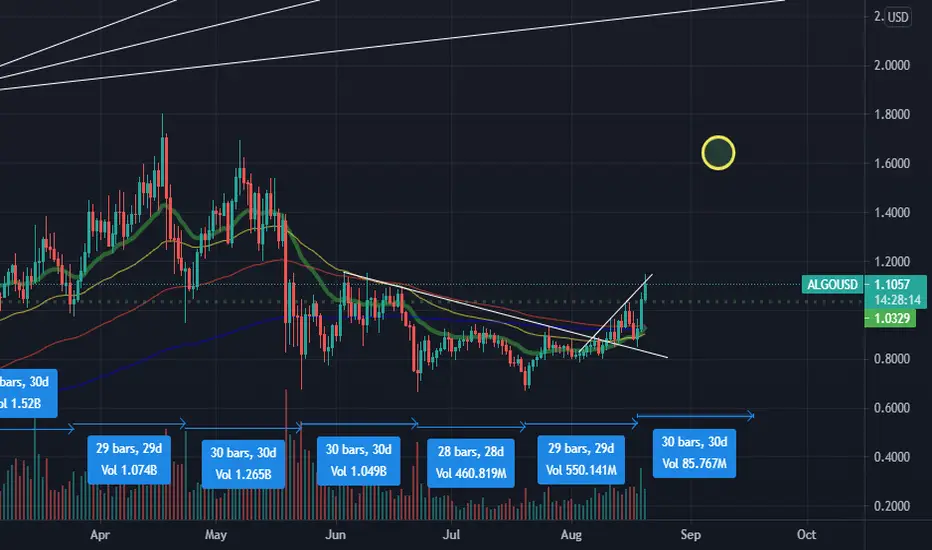
Without fail, Algorand has stuck to this pattern for over 7 months now. Roughly every 30 days is a local bottom. The most recent doesn't seem like a bottom because on the chart it is in the same range algo had been bound to for quite awhile.
My target for the next local top, meaning within the next 18-25 days, is in yellow.
My target for the next local top, meaning within the next 18-25 days, is in yellow.

Wyłączenie odpowiedzialności
Informacje i publikacje nie stanowią i nie powinny być traktowane jako porady finansowe, inwestycyjne, tradingowe ani jakiekolwiek inne rekomendacje dostarczane lub zatwierdzone przez TradingView. Więcej informacji znajduje się w Warunkach użytkowania.
Wyłączenie odpowiedzialności
Informacje i publikacje nie stanowią i nie powinny być traktowane jako porady finansowe, inwestycyjne, tradingowe ani jakiekolwiek inne rekomendacje dostarczane lub zatwierdzone przez TradingView. Więcej informacji znajduje się w Warunkach użytkowania.