
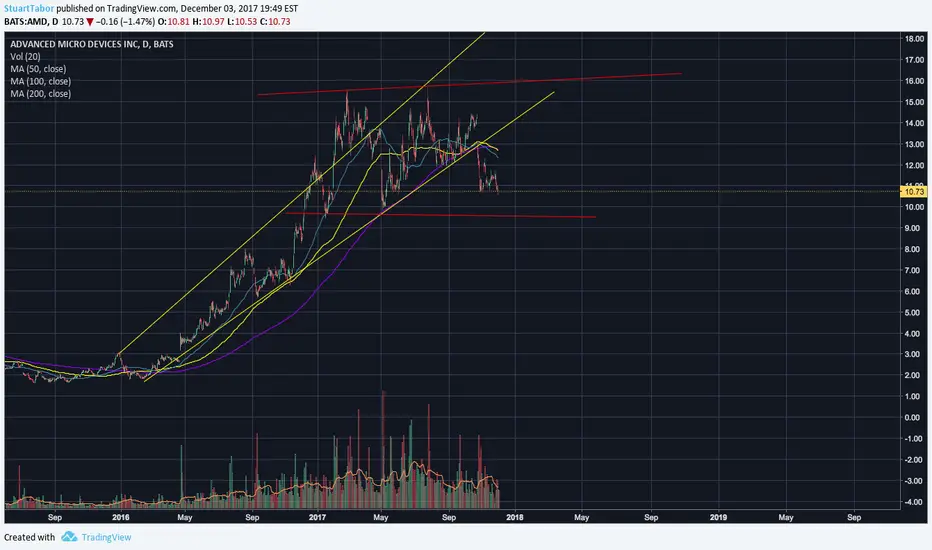
AMD has retreated from its 52week high of $15.65 and is trading at $10.73 going into next week. As indicated on the 1yr chart, it appears that they have dipped below the support trend line and are building a base there. However, they have managed to stay above their most recent lows, marginally, of $9.83. I think that AMD could either pull back towards the red line drawn on the chart (around $10 and then go into a prolonged uptrend based on the growth prospects of the company.) Although they have posted negative earnings, they are expected to double in the next year and continue to grow from there. We can also see that AMD's RSI and MACD are both showing buy signals which could further increase our confidence in this stocks revival.

Wyłączenie odpowiedzialności
Informacje i publikacje nie stanowią i nie powinny być traktowane jako porady finansowe, inwestycyjne, tradingowe ani jakiekolwiek inne rekomendacje dostarczane lub zatwierdzone przez TradingView. Więcej informacji znajduje się w Warunkach użytkowania.
Wyłączenie odpowiedzialności
Informacje i publikacje nie stanowią i nie powinny być traktowane jako porady finansowe, inwestycyjne, tradingowe ani jakiekolwiek inne rekomendacje dostarczane lub zatwierdzone przez TradingView. Więcej informacji znajduje się w Warunkach użytkowania.