
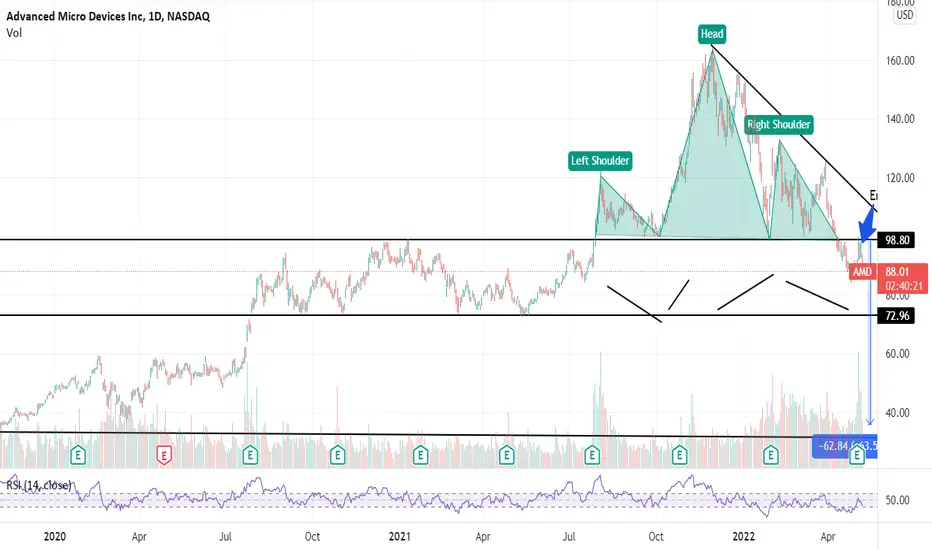
AMD was forming a head and shoulder pattern which is started when it broke the resistance of $98 in Jun 2021 and till Apr 2022 it completed its pattern and it broke down made a low of $84 and again it retests its level of $98-$99 of resistance and came down. To become strong sell the rsi show close below 40 levels currently, it is at 41 levels. Sell below $90 levels Sl is $101 and the target is $74 - $60 and the final target is $36 levels. The time horizon is medium-term.
Fundamentally the company has reported good numbers and being in the semiconductor industry it has demand still intact. But the chart is saying there is a lot of pain ahead.
Overall the market sentiment is negative. So it can be under a lot of pressure.
What are your thoughts guys??
Fundamentally the company has reported good numbers and being in the semiconductor industry it has demand still intact. But the chart is saying there is a lot of pain ahead.
Overall the market sentiment is negative. So it can be under a lot of pressure.
What are your thoughts guys??

Wyłączenie odpowiedzialności
Informacje i publikacje nie stanowią i nie powinny być traktowane jako porady finansowe, inwestycyjne, tradingowe ani jakiekolwiek inne rekomendacje dostarczane lub zatwierdzone przez TradingView. Więcej informacji znajduje się w Warunkach użytkowania.
Wyłączenie odpowiedzialności
Informacje i publikacje nie stanowią i nie powinny być traktowane jako porady finansowe, inwestycyjne, tradingowe ani jakiekolwiek inne rekomendacje dostarczane lub zatwierdzone przez TradingView. Więcej informacji znajduje się w Warunkach użytkowania.