
AMD: Testing All-Time Highs with Precision Fibonacci Extensions
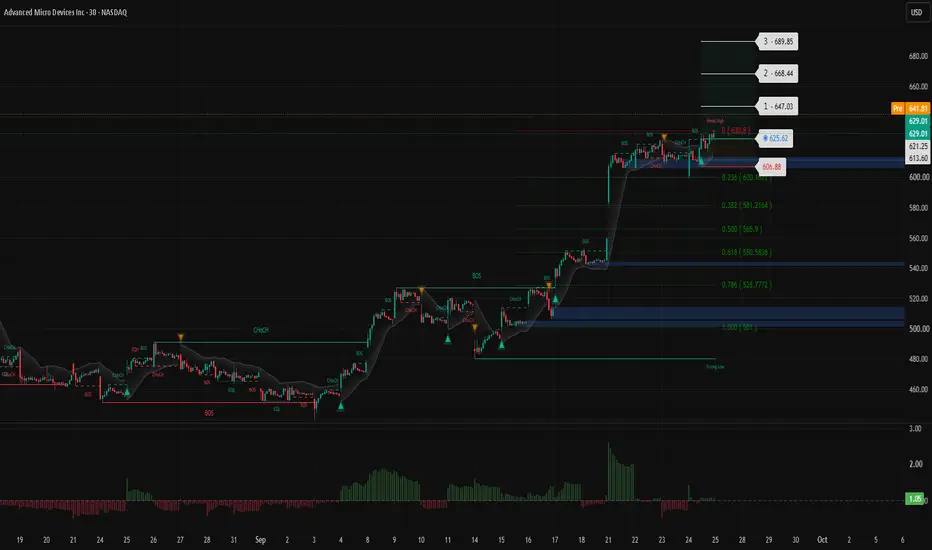
📊 Macro & Technical Analysis (AMD)
Advanced Micro Devices (AMD) is trading at a critical junction as it tests its multi-month major overhead resistance wall [image_cYvUoO.png]. On the macro side, the company's growth trajectory remains stellar, boasting a 107% YoY expansion in its data center business and secured deep AI partnerships [image_sgtqM3.png]. While insider trading profiles show recent profit-taking near the highs, the broader narrative is heavily supported by the projected $3 trillion AI TAM by 2030 [image_sgtqM3.png].
Looking at the precise Fibonacci structural blueprint on the daily chart:
1. Resistance Confrontation: The price action is currently hovering around $625.52, challenging the major psychological and technical All-Time High barrier [image_Gortnu.png, image_sgtqM3.png].
2. Volume Profile: Momentum remains solid, but the immediate trend requires a decisive daily close above this structural shelf to fully confirm a clean, uninhibited breakout [image_Gortnu.png].
3. Invalidation Parameters: Risk is tightly managed with an invalidation level locked at $606.88. This protective stop is strategically anchored just beneath the near-term accumulation cluster to defend against a false breakout scenario.
🛠️ My Trading Plan:
• Entry Zone: Around $625.52 (Trading the immediate momentum as buyers attempt to break and hold above the local overhead ceiling).
• Invalidation (Stop Loss): $606.88 (Placed strictly below the short-term support shelf to preserve capital against mean-reversion forces).
• Target 1 (TP1): $647.03 (First major Fibonacci extension milestone).
• Target 2 (TP2): $668.44
• Target 3 (TP3): $689.85 (Full technical extension target into uncharted blue-sky territory).
💡 Pro-Tip for Chart Layout:
This strategic setup is modeled using the exact rules of the "MariSakel - Fusion System". To see these exact dynamic trend shifts, buy/sell signals, and automated levels directly on your screen, you can search for "MariSakel - Fusion System" under the Indicators tab and apply it to your own chart layout!
What are your thoughts on AMD's breakout potential at these current levels? Let me know in the comments section below, and don't forget to support this analysis with a boost!
*DISCLAIMER: This post is for educational and technical analysis purposes only. It does not constitute investment or financial advice. Always practice strict risk management.*
Advanced Micro Devices (AMD) is trading at a critical junction as it tests its multi-month major overhead resistance wall [image_cYvUoO.png]. On the macro side, the company's growth trajectory remains stellar, boasting a 107% YoY expansion in its data center business and secured deep AI partnerships [image_sgtqM3.png]. While insider trading profiles show recent profit-taking near the highs, the broader narrative is heavily supported by the projected $3 trillion AI TAM by 2030 [image_sgtqM3.png].
Looking at the precise Fibonacci structural blueprint on the daily chart:
1. Resistance Confrontation: The price action is currently hovering around $625.52, challenging the major psychological and technical All-Time High barrier [image_Gortnu.png, image_sgtqM3.png].
2. Volume Profile: Momentum remains solid, but the immediate trend requires a decisive daily close above this structural shelf to fully confirm a clean, uninhibited breakout [image_Gortnu.png].
3. Invalidation Parameters: Risk is tightly managed with an invalidation level locked at $606.88. This protective stop is strategically anchored just beneath the near-term accumulation cluster to defend against a false breakout scenario.
🛠️ My Trading Plan:
• Entry Zone: Around $625.52 (Trading the immediate momentum as buyers attempt to break and hold above the local overhead ceiling).
• Invalidation (Stop Loss): $606.88 (Placed strictly below the short-term support shelf to preserve capital against mean-reversion forces).
• Target 1 (TP1): $647.03 (First major Fibonacci extension milestone).
• Target 2 (TP2): $668.44
• Target 3 (TP3): $689.85 (Full technical extension target into uncharted blue-sky territory).
💡 Pro-Tip for Chart Layout:
This strategic setup is modeled using the exact rules of the "MariSakel - Fusion System". To see these exact dynamic trend shifts, buy/sell signals, and automated levels directly on your screen, you can search for "MariSakel - Fusion System" under the Indicators tab and apply it to your own chart layout!
What are your thoughts on AMD's breakout potential at these current levels? Let me know in the comments section below, and don't forget to support this analysis with a boost!
*DISCLAIMER: This post is for educational and technical analysis purposes only. It does not constitute investment or financial advice. Always practice strict risk management.*
Zlecenie aktywne

Wyłączenie odpowiedzialności
Informacje i publikacje nie stanowią i nie powinny być traktowane jako porady finansowe, inwestycyjne, tradingowe ani jakiekolwiek inne rekomendacje dostarczane lub zatwierdzone przez TradingView. Więcej informacji znajduje się w Warunkach użytkowania.
Wyłączenie odpowiedzialności
Informacje i publikacje nie stanowią i nie powinny być traktowane jako porady finansowe, inwestycyjne, tradingowe ani jakiekolwiek inne rekomendacje dostarczane lub zatwierdzone przez TradingView. Więcej informacji znajduje się w Warunkach użytkowania.